Int. J. Data Envelopment Analysis (ISSN 2345-458X)
Vol.7, No.2, Year 2019 Article ID IJDEA-00422, 18 pages Research Article
Performance Evaluation of Decision Making
Units Using Data Envelopment Model and
Artificial Neural Network
(Case Study: Fars Regional Water
Corporation)
Morteza Shafiee*1, Saeedeh Akbarpoor2, Sara Salari Dargi3
(1,2,3)
Department of Industrial Management,
Economic and Management Faculty, Shiraz Branch, Islamic Azad University, Shiraz,IranReceived 04 April 2018, Accepted 16 October2018
Abstract
One of the problems with using the DEA is the lack of resolution for decision makers. The performance limit obtained by the DEA is also sensitive to statistical perturbations and outliers caused by measurement error or any other external factor, causing the efficiency limit to be shifted and diverting the DEA analysis path. The DEA can also hardly predict the performance of decision-making units in the future. Therefore, artificial neural networks are a good tool to use in such issues because the nature of ANN performance is due to its learning power and generalizability in a way that is more resistant to outliers and perturbations resulting from inaccurate data measurement and can As a useful tool for managers to predict and observe the behavior of their system in the organization in the future. Also, in order to implement the theoretical findings from practical research, 27 district units of Fars Regional Water Company to increase the volume Groundwater was evaluated. Initially, the input-driven CCR model and the Anderson-Peterson (AP) method were used to rank the units in the DEA model, and then the ANN approach was used to evaluate the performance of the units using the hybrid models (DEA - Neuro). The results of the computational efficiency analysis of the units using this model demonstrate the high power of the network in computing and resolving the performance.
*. Corresponding author: Email: [email protected]
Keywords: Performance Evaluation, Decision Making Units, Data Envelopment Analysis, Artificial Neural Network.
1. Introduction
Evaluating the performance of organizations and companies with similar activities and evaluating the results of their performance over a given period is an important and strategic process that while determining the competitive position of organizations has a significant role in continuous improvement and enhancing the quality and effectiveness of management decisions.Data envelopment analysis technique is one of the techniques that is widely used and has a very high contribution to various research in the field of measurement and evaluation [1]. The technique was first developed by Farrell in 1957, using a similar method of measuring efficiency in engineering, to measure the efficiency of a manufacturing unit. In this study, the model included one input and one output [2]. Then in 1978, Charles and his colleagues introduced a fractional programming formulation that was in fact the extension of Farrell's idea of multi-input-multi-output mode. Thus the first model of data envelopment analysis was presented by Charles and colleagues under the acronym CCR (consisting of the first letters of the founders of the model) [3]. Banker and colleagues (1984) proposed a new model by removing the principle of constant-scale returns from the CCR model. This model was briefly called the BCC model (consisting of founders' initials)[4].In general, data envelopment analysis is based on linear programming, which makes comparisons between decision making units (DMU), and is used to measure the efficiency of DMUs that have multiple inputs and multiple outputs [5].The data envelopment analysis method allows performance to change over time and does not require any assumptions about the performance boundary. On the other hand, the performance boundary derived from the DEA is sensitive to statistical perturbations and outliers
caused by measurement error or any other external factor, causing the performance boundary to be displaced and diverting the DEA analysis path [6,1]. For this reason, caution should be exercised in using the DEA to evaluate the performance of other decision-making units. This has led to the recent use of artificial neural networks (ANN) as a good alternative for estimating efficient boundaries for decision making. Because the nature of the performance of artificial neural networks is due to the power of learning and generalization in such a way that they are more resistant to outliers and perturbations resulting from inaccurate data measurement [7]. Also, data envelopment analysis method can hardly predict the performance of decision makers in the future, so using artificial neural network technique can be a useful tool for managers to predict and observe their system behavior in the future [8,9,10,11].
17 harvesting of surface and ground water resources. The units studied in this study consisted of 27 regions that we evaluated the performance of these units during 2016 and 2017.
Accordingly, the structure of the study is that first the Input-oriented CCR coating analysis model and the Anderson-Peterson (AP) method for ranking the efficient units in the framework of data envelopment analysis models are investigated. The weaknesses of the models are identified in terms of calculating and separating the performance of Fars Regional Water Company. In the following study, for performance analysis and evaluation of company performance, a neural network approach for predicting performance in the form of combined models of data envelopment analysis and artificial neural networks (Neuro-DEA) was used. The analytical results of the calculated unit’s efficiency using these models show the high power of the network in the calculation and resolution of Fars Regional Water Company in terms of efficiency.
2.1. Data envelopment analysis
DEA is a mathematical technique for evaluating the performance of decision-making units. In general, data envelopment analysis models are divided into two groups: input-output and output-oriented. Input-oriented models are models that use fewer inputs to obtain the same amount of output without changing
outputs. And the output-driven models are the ones that get the most output without changing the input. In another subdivision, the DEA model is subdivided into multilevel models and cover models Secondary cover models are multiple models The DEA uses the ratio of the sum of the weighted outputs to the sum of the weighted inputs to measure the efficiency [12].
efficiency
m
i ij i s
r
rj r
x v
y u
1
1 (1)
1.2. Artificial Neural Networks
Artificial neural networks (ANNs) are mathematical models They imitate how the human brain works And their ability to extract patterns in observed data without having to assume assumptions about the relationships between variables. In neural networks, neurons are the smallest unit of information processing and form the basis of neural network function
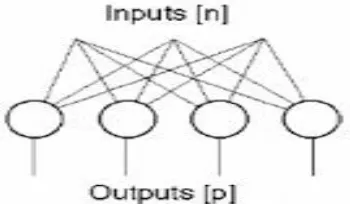
In fact, a neural network is a set of interconnected neurons in different layers That send information to each other. The simplest network only has two input and output layers known as the forward model. This network operates as an input-output system and uses the value of input neurons to calculate the value of output neurons [13]. (Figure 1)
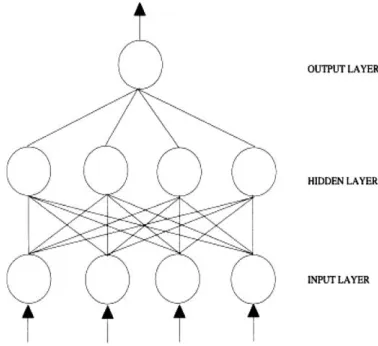
Neural networks with hidden layers known as multilayer perceptron networks. They are more capable than single-layer feedforward neural networks. In addition to the input and output layers, they also have hidden layers. Hidden units have no meaning unlike inbound and outbound units and are merely an intermediate result in the process of calculating output value and acting as output units [14]. (Figure 2) As a whole in interlayer connection, There are two major types of connections between neurons in the network backward and forward. In the forward network, signals flow only in one direction from the
input layer to the latent and ultimately output layers. In the backward network, signals can flow to neurons that have the same layer in the previous layers. Both types of these connections between neurons are shown in Figure 4. The purpose of neural networks is to learn based on logical connections between patterns of input and output parameters, to analyze or to find patterns of input parameters. By providing neural networks with available data, the trained network is obtained by modifying weights or connecting between neurons [15]. (Figure 3)
Figure 2: Forward neural network with hidden layers
Figure 3: Backward and forward Neural Network
19 Numerous studies have been conducted on the use of artificial neural network along with data envelopment analysis. The first studies to compare data envelopment analysis and neural network as two nonparametric methods of performance evaluation Performed by Athanassopoulos and Curram. In this study, a simulated production technique with two inputs and one output was used to evaluate two methods of data envelopment analysis and artificial neural network. The results of this study indicate that despite the differences between the two methods, both methods provide a useful range of information with respect to evaluating bank branch performance [16].
Costa and Markellos Evaluates Performance of Public Transport Services Based on Performance Concept Using Multilayer Perceptron Neural Network with Data Envelopment Analysis and Corrected Least Squares. In this study, it was found that multilayer perceptron neural networks approach to traditional methods is nonparametric, probabilistic and flexible [17].
Pendharkar and Rodger artificial neural network is used for uniform learning predictive functions, It is useful for obtaining screened data and provides relatively satisfactory screened samples. In this study, using data envelopment analysis, the learning data sets were divided into two categories: efficient and inefficient. Then using artificial neural network it was found that performance prediction in efficient data sets is higher than inefficient [18].
Santi and Delgan Santi and Delegan used a neural network to simulate the nonlinear production function and compared its results with more conventional methods such as random boundaries and DEA with different observations and perturbations and showed that neural networks were
more stable than the mentioned methods [19].
Emroozinezhad and Shallie also used back-propagation neural network data analysis and hybrid analysis to solve the problem of large data sets and high inputs and outputs. Artificial neural network evaluates the data set in five large groups and the results are compared with traditional data envelopment analysis [20]. Azadeh et al., Applied data envelopment analysis and artificial neural network and Rough set theory to evaluate the effects of employee attitude attitudes on overall performance Data envelopment analysis has two main roles that first determine the efficient and inefficient units and provide the neural network And finally, it chooses the best reduction (at least subsets of attitudes) through the neural networkThe neural network is also used to determine the minimum set of attitudes performed by the Rough theory set and to predict the overall performance [21].
Guo Xiao in 2011, a study aimed at evaluating airport performance, energy saving construction based on DEA and artificial neural network found that these methods can be used to save energy at airports [22].
Yong-Ming et al., DEA model used auxiliary variable data for sensitivity analysis of decision making units' performance scores and determination of optimal dimensions of inefficient units. Then improved units along with efficient units enter the network process ervous is artificial The optimal results and values of the prediction model are used to reduce energy consumption and guide the ethylene production system and improve energy efficiency [23].
analysis. In this study, for the first time, artificial neural network and dynamic data envelopment analysis were used to predict the performance scores of decision makers in the future. As such, the amount of system inputs and outputs is predicted in the future and then applied to dynamic data envelopment analysis [24].
Vlontzos et al., Using the combined approach of data envelopment analysis and artificial neural network, they analyzed the environmental impacts of EU agricultural policies.In this study, using window analysis, greenhouse gas efficiency assessment and identifying the efficiency changes of EU member states affected by common agricultural policy. The purpose of this study is to identify the positive and negative effects of policies on member countries' performance. Finally, the artificial neural network is used to determine the performance scores of EU member states [25].
3 .Research methodology
In this study, to demonstrate the efficiency of the model and the theoretical findings of the model, it has been practically studied in the real conditions of Fars Regional Water Company and the efficiency of 27 districts of Fars Regional Water Company has been evaluated In the following is the name of the units. The following steps are also carried out for the research, which can be seen in Figure 5:
Step One: Gather information about DMU inputs and outputs In studying real systems for calculating efficiency, the first step is to determine the inputs and outputs of each DMU so that they reflect the efficiency. In analyzing companies' performance, it is important to determine the inputs and outputs, Because every company has a lot
of inputs and outputs, it is difficult to get a large number of them. Also, if some of these inputs and outputs are ignored, they will cause problems in performance analysis.
Step Two: After data collection using the CCR model, the performance of all DMUs is calculated At this point the data needed for network training is provided, This study first used data from all DMUs in 2016 to train the network.
Step 3: Network Training - At this point the neural network is trained using the data of the units selected in the previous step. Step Four: If the training data provided results and accuracy (error rate decreased to the desired level) go to the next step, otherwise go back to the second step to complete the network training pattern. Step 5: Calculate the performance of all DMUs in 2017 using predictive and trained neural network.
Step 6: Compare between the results of the DEA and the Neuro-DEA. (Figure 4)
3.1. Input-oriented CCR DEA Model In this research model, in order to determine the highest efficiency ratio and to involve the inputs and outputs of other decision makers in determining the optimal weights for the units under investigation, the following Input-oriented CCR model was proposed:
s r
rj ry
u MaxZ
1
(2)
m
i ij ix
V t s
1
1 :
.
. (3)
s
r
m
i ij i rj
ry vx j n
u
1 1
,..., 1
0 (4)
0
0
ir
v
21 In this model:
M: Number of DMU entries and S: The number of outputs per DMU and n: The number of DMUs and yrj: DMU output value and xij: DMU Input value and ur: Output Weight vi: input weight.
If this ratio can be solved for each of the decision-making units compared to the others, it is possible to compare these units from the point of view of efficiency and identify the efficient and inefficient units.
3.2. Input and output indicators
Any applied research is required for studies and identification of effective parameters in the research field. For this purpose, in order to identify and extract the effective input and output indices and calculate their cost, as well as assessing the relative efficiency of Fars Regional Water Company units, meetings were held with relevant managers and experts, and important indicators were selected and considered as input and output indicators. Was taken and shown in Table1:
START
Collect all units' data
Calculating unit performance using data envelopment analysis model
Train all DMUs related data
ANN Training
Has the desired result been achieved?
Analysis of the results of artificial neural networks with data envelopment analysis model Performance Computation with Artificial Neural Networks
YES
Table 1: Input and output indicators
Input Indicators 1-Personnel
costs (Wages of patrol teams) 2-Cost of Peru to
Benefit Unauthorized Wells
3-Reduce the cost of appointments 4-The cost of
confiscating unauthorized devices
Output index The volume of water saved
3.3. Neuro-DEA
Inside each of the layers forming the ANN, there are a number of neurons that are linked by weighted junctions. The number of input and output layer neurons usually depends on the number of input and output model variables. But the choice of the number of middle layer neurons is determined by trial and error. Prior to using the ANN model, weights, biases of network neurons are determined. The body of each synthetic neuron consists of two parts, the first part being called a composition function. The application of this section is that after a set of data is defined as neuron input, each input will be multiplied by its corresponding weight initially selected at random, and then all weighted inputs will be assigned to determine The levels of neuron activity are aggregated by the compound function to produce an output that is represented by NET:
NET=∑(𝑋𝑖∗ 𝑊𝑖) + 𝑏 (6)
In the formula above, the parameter b is called the bias, which is used for faster integration of the learning process. The bias is similar to a weighted neuron, but it does not accept any input from other neurons, and its only input is a constant value that transmits it along with its weight, which is equal to b, to the next neurons within the weighted junctions. In the second part of the cell, the .NET output, usually with an additional stimulus function called processing block (SF), is used to generate the neuron output (OUT). The processing block compresses the .NET interval and sets the OUT value to a specified range. In fact, just as a biological
cell needs to reach a certain threshold level to produce a signal, so do the stimulus functions until the combined and weighted inputs reach a certain threshold (T). They produce very small outputs. When the combined inputs reach a certain threshold, the nerve cell is stimulated and produces an output signal. Since the DEA model is nonlinear and the ANNs are highly capable of approximating nonlinear functions, ANNs are a good tool for Use in such matters. This is the basis of the Neuro-DEA model; first, a proper neural network model is simulated. Then, the desired DEA output is used to use the data for initial processing of the network pre-processing and the artificial neural network is trained to learn the reference patterns and calculate the efficiency of the units. The results are then analyzed using the DEA and Neuro-DEA models. In most ideas, combining data envelopment analysis with artificial neural network is important in that it can be designed and synthesized with the information obtained from data envelopment analysis. He then used this trained neural network to evaluate the efficiency of decision-making units in subsequent years or even for new ones that were not previously.
3.4. Artificial neural network input and output data
23 weighted outputs are then inserted into the next layer. Determining the number of hidden layers is a complex problem that usually requires trial and error. Studies have shown that a three-layer ANN layer (an input layer, a middle layer, and an output layer) is predictable with accuracy. The number of hidden layers should be as small as possible. It is proved that each maximum function is approximated by three hidden layers. First, the ANN is trained with a hidden layer, which increases the number of hidden layers if inappropriate. The output layer input (last layer) consists of the output of the last middle layer and is obtained by multiplying the associated weights and using the ANN final output transfer function.
3.5. How to teach artificial neural network
Levenberg-Marquardt (LM) back propagation algorithm was used to train ANN. Because in general function estimation problems with ANN parameters less than 100, the LM algorithm is very efficient and has high speed and accuracy. And in many cases, this algorithm is minimized to error. In the first step, the data on the parameters are provided. Then, the data is processed, calculated and matrixed. Some of this data is used to train ANNs. The rest are used in the testing and validation phase. ANN training is a process whereby the weights and bias of the grid are changed to minimize training error. The process consists of the following steps:
The first stage of input from the input neurons propagates to the output neurons, and then by comparing the network outputs and the actual values, the error value is calculated and then corrected by propagating the error from the output neurons to the input ANN weights such that the ANN training error Decrease. The
sweep cycles are repeated so as to minimize the mean squared error MSE and to increase the correlation coefficient R2 between the values obtained from the DEA and predicted by the ANN and finally to design the desired network. The performance of artificial neural networks is evaluated by means of mean square error (MSE), absolute mean relative error (MARE) and correlation coefficient (R2) according to the following equations by [26]:
n 1 i 2 i , M odel i ,Obs y ) /n
y (
MSE (7)
n
1
i Obs,i i , M odel i , Obs y y y n 1
MARE (8)
n 1 i 2 mean , M odel i , M odel 2 mean , Obs i , Obs n 1 i 2 mean . M odel i , M odel mean ,. Obs i , Obs 2 ) y y ( ) y y ( ) y y )( y y ( (R (9)
In the above equations, the number of data, (yObs,i) and (yM odel,i) is the output measured and the output predicted by the model, and (yObs,mean) and (yM odel,mean) are the average output values measured in the laboratory and the average predicted by the model. In a detailed model, the value is MSE is close to one and the value 2
R close to zero.
4. Computational results and Discussion 4.1. Calculation of Fars Regional Water Company Performance Based on Data Envelopment Analysis
five efficient cities. These units include Darab, Zarrin Dasht, Shiraz, Qirokarzin, Marvdasht. Other units that have achieved a rank below one are ineffective. For 2017, they have achieved seven efficiency units: Eqhlid, Jahrom, Darab, Sepidan, Shiraz, Marvdasht and Qirokarzin, and the rest are inefficient. Tables (2) and (3) summarize the performance values of decision-making units in 2016 and 2017.
Since the number of efficient units in 2016 and 2017 is more than one unit, the
Anderson and Peterson method is used to rank these units. In evaluation by AP method the unit under investigation is excluded from evaluation. Basic models for evaluating each decision unit use the decision unit itself to create the token unit because inefficient units are not very effective in forming an efficient boundary, so eliminating them from the evaluation will not affect the efficiency boundary.
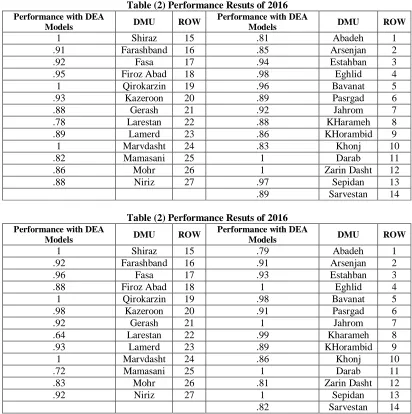
Table (2) Performance Resuts of 2016
ROW DMU
Performance with DEA Models ROW
DMU Performance with DEA
Models 1 Abadeh .81 15 Shiraz 1 2 Arsenjan .85 16 Farashband .91 3 Estahban .94 17 Fasa .92 4 Eghlid .98 18 Firoz Abad .95 5 Bavanat .96 19 Qirokarzin 1 6 Pasrgad .89 20 Kazeroon .93 7 Jahrom .92 21 Gerash .88 8 KHarameh .88 22 Larestan .78 9 KHorambid .86 23 Lamerd .89 10 Khonj .83 24 Marvdasht 1 11 Darab 1 25 Mamasani .82 12 Zarin Dasht 1 26 Mohr .86 13 Sepidan .97 27 Niriz .88 14 Sarvestan .89
Table (2) Performance Resuts of 2016
ROW DMU
Performance with DEA Models ROW
DMU Performance with DEA
Models 1 Abadeh .79 15 Shiraz 1 2 Arsenjan .91 16 Farashband .92 3 Estahban .93 17 Fasa .96 4 Eghlid 1 18 Firoz Abad .88 5 Bavanat .98 19 Qirokarzin 1 6 Pasrgad .91 20 Kazeroon .98 7 Jahrom 1 21 Gerash .92 8 Kharameh .99 22 Larestan .64 9 KHorambid .89 23 Lamerd .93 10 Khonj .86 24 Marvdasht 1 11 Darab 1 25 Mamasani .72 12 Zarin Dasht .81 26 Mohr .83 13 Sepidan 1 27 Niriz .92 14 Sarvestan .82
But since efficient units make up the efficiency boundary, eliminating them will
25 so in this evaluation the unit that scores the most is the efficient unit.
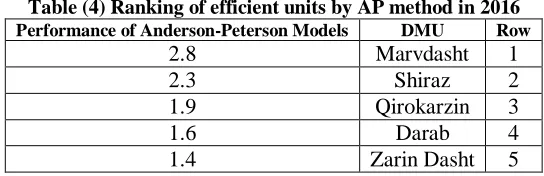
Tables (4) and (5) show the AP performance:
4.2. The results of ANN
In this study, Matlab R2015b software was used to predict the target. The data obtained from DEA model were introduced into the grid as 4 * 27 input matrix and 1 * 27 * output matrix. 70% of the data was used for network design and network training and 30% was allocated for network testing. And the results of 18 data sets were used to develop (train) the artificial neural network model. And the results for 9 simulations were dropped at the end of the task. Since there is no specific global strategy for selecting
artificial neural network architecture and algorithm on different issues, different parts of the neural network have been employed to achieve the most appropriate model in the problem. In this research, ANN model with three input, output and output layers and different transfer functions in these layers was used to determine the most suitable transfer functions in the hidden and output layers in predicting the performance of units. The best transfer function was selected for the input layer to the hidden layer of the Tangent sigmoid function and for the transition from the hidden layer to the output of the Pureline function. Figure (5) shows the structure of the artificial neural network used.
Table (4) Ranking of efficient units by AP method in 2016
Row DMU
Performance of Anderson-Peterson Models
1 Marvdasht 2.8
2 Shiraz
2.3
3 Qirokarzin 1.9
4 Darab
1.6
5 Zarin Dasht 1.4
Table (5) Ranking of efficient units by AP method in 2017
ROW DMU
Performance of Anderson-Peterson Models
1 Marvdasht 2.2
2 Shiraz
1.9
3 Eghlid
1.8
4 Darab
1.7
5 Jahrom 1.5
6 Sepidan 1.3
Figure (5) structure of artificial neural network used in this study
In this study, the number of neurons in the input layer is 4, which is the number of input variables to the model. The number of neurons in the secretory layer was initially assumed to be 1 neuron; and after determining the best network, the number of neurons in the secretory layer was optimized. The number of neurons in the output layer depends on the number of network output parameters. In this research, the output is the model of performance evaluation of district units. So the number of neurons in the output layer is a number. Figure 6 shows the artificial neural network with a hidden
layer as well as an input layer and an output layer.
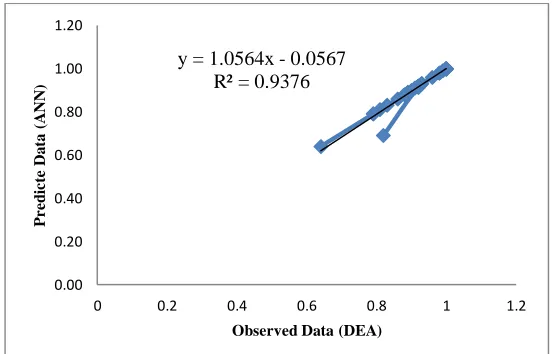
As Figures 7 and 8 show, the results obtained by the artificial neural network model for 2016 (MSE=0 .7 and R2 = 0.92) and for 2017 (MSE =0.68 and R2 =0.93) indicates that the artificial neural network has high ability and high accuracy to predict the target. And the performance of artificial neural network in 2017 is also more accurate because the closer the R2 value is to one and the MSE value is closer to zero the higher the accuracy of the algorithms mentioned above. And the network is more optimized.
27
Figure 7 shows the results of the DEA model performance values and the values predicted by ANN in 2016
Figure 8 shows the results of the DEA model performance values and the values predicted by ANN for 2017
4.3. Comparison of DEA results with artificial neural network
The performance comparison of the units for 2017 and 2016 is derived from the DEA method and the artificial neural network in Fig. 9 and Fig. 10. The values shown in the following figure show that
the calculated ranks for both techniques are negligible.
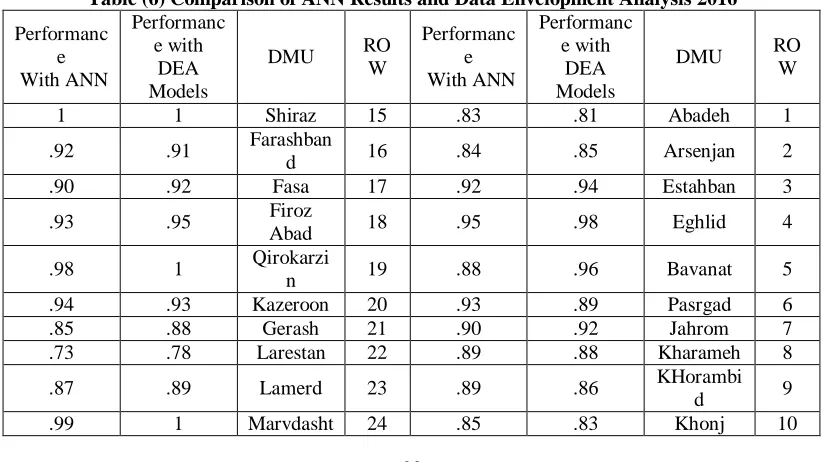
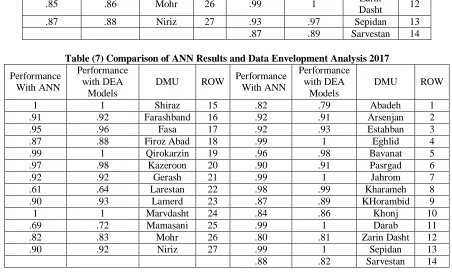
The ANN performance is also evaluated through the mean squared error and the correlation coefficient, which is presented in Table 6 and table 7.
y = 1.0874x - 0.0839 R² = 0.9292
0.000 0.200 0.400 0.600 0.800 1.000 1.200
0 0.2 0.4 0.6 0.8 1 1.2
P
r
e
d
ic
a
te
D
a
r
a
(A
N
N
)
Observed Data (DEA)
y = 1.0564x - 0.0567 R² = 0.9376
0.00 0.20 0.40 0.60 0.80 1.00 1.20
0 0.2 0.4 0.6 0.8 1 1.2
P
r
e
d
ic
te
D
a
ta
(A
N
N
)
Figure 9 compares the performance of units for 2016 derived from the DEA method and artificial neural network
Figure (10) Comparison of unit performance for 2017 derived from DEA method and artificial neural network
Table (6) Comparison of ANN Results and Data Envelopment Analysis 2016
RO W DMU Performanc e with DEA Models Performanc e With ANN RO W DMU Performanc e with DEA Models Performanc e With ANN 1 Abadeh .81 .83 15 Shiraz 1 1 2 Arsenjan .85 .84 16 Farashban d .91 .92 3 Estahban .94 .92 17 Fasa .92 .90 4 Eghlid .98 .95 18 Firoz Abad .95 .93 5 Bavanat .96 .88 19 Qirokarzi n 1 .98 6 Pasrgad .89 .93 20 Kazeroon .93 .94 7 Jahrom .92 .90 21 Gerash .88 .85 8 Kharameh .88 .89 22 Larestan .78 .73 9 KHorambi d .86 .89 23 Lamerd .89 .87 10 Khonj .83 .85 24 Marvdasht 1 .99 0 0.2 0.4 0.6 0.8 1 1.2
0 5 10 15 20 25 30
Effi c ie n c y Number units DEA ANN 0 0.2 0.4 0.6 0.8 1 1.2
0 5 10 15 20 25 30
29 11 Darab 1 .98 25 Mamasani .82 .83 12 Zarin Dasht 1 .99 26 Mohr .86 .85 13 Sepidan .97 .93 27 Niriz .88 .87 14 Sarvestan .89 .87
Table (7) Comparison of ANN Results and Data Envelopment Analysis 2017
ROW DMU Performance with DEA Models Performance With ANN ROW DMU Performance with DEA Models Performance With ANN 1 Abadeh .79 .82 15 Shiraz 1 1 2 Arsenjan .91 .92 16 Farashband .92 .91 3 Estahban .93 .92 17 Fasa .96 .95 4 Eghlid 1 .99 18 Firoz Abad .88 .87 5 Bavanat .98 .96 19 Qirokarzin 1 .99 6 Pasrgad .91 .90 20 Kazeroon .98 .97 7 Jahrom 1 .99 21 Gerash .92 .92 8 Kharameh .99 .98 22 Larestan .64 .61 9 KHorambid .89 .87 23 Lamerd .93 .90 10 Khonj .86 .84 24 Marvdasht 1 1 11 Darab 1 .99 25 Mamasani .72 .69 12 Zarin Dasht .81 .80 26 Mohr .83 .82 13 Sepidan 1 .99 27 Niriz .92 .90 14 Sarvestan .82 .88 5. Conclusion
In this study, to achieve the efficiency of 27 decision makers of Fars Regional Water Company, the Input-oriented DEA (CCR) model was used. Due to the lack of decision-making units, most units became efficient. To solve this problem, Anderson and Peterson techniques were used to rank the units. The problem with this method is that it takes time and volume of computation to achieve the optimal solution. Therefore, the idea of combining data envelopment analysis with artificial neural networks was put forward in order to obtain rational and accurate approximations of the efficiency of decision-making units in the shortest time. By combining the Neuro-DEA model and calculating the efficiency of decision-making units, it was found to be more resolute than the DEA model and can be used to solve larger-scale problems. Its relative advantage is that it does not need to solve a mathematical equation for each
1. Strengthen and establish patrol and inspection teams
2. Promotional control and supervision of the use of water wells without a license for harmful exploitation to the public interest 3. Preparation and installation of smart volume meter – information
4. Digging piezometric wells in the plains 5. Installation of measuring equipment on water sources
6. Preparation of study area database 7. Buying low-efficiency wells
8. Organizing drilling companies and installing GIS on them
There are also suggestions for future research:
1. Conduct comparative studies in different regional water companies about research
2. Do similar research using other statistical models and software and compare the results with the results of this study
3. Neuro-DEA is now required to use basic DEA models as well.
31 Refrence
[1]Wu, D, Yang, Z and Liang, L, “Using DEA-neural network approach to evaluate branch efficiency of a large Canadian Bank.” Expert System with Application, 2005, PP. 1-8.
]2[ Farrell M.J; "The Measurement of productive efficiency", Journal of the Royal Statistical Society, A CXX, Part 3, pp. 253-290, 1957.
[3] A.Charnes, W.W Cooper,E. Rhodes, Measuring the efficiency of decision making units; European journal of operations research, 1978,Vol. 2, pp. 429-444.
[4] A.M.Ghalayini, J.S.Noble, T.J.Crowe, An integrated dynamic performance measurement system for improving manufacturing
competitiveness.International Journal of Production Economics, 1997; Vol.48, pp.25-207.
[5] Celebi, D. and Bayraktar, D. “An integrated neural network and data envelopment analysis for supplier evaluation under incomplete information.” Expert Systems With Applications, 2007, PP. 1-13.
[6] Bauer, P.W. “Recent developments in the econometric of frontiers.” Journal of Econometrics,1990, 46, PP.39-56.
[7] Wang, S. “Adaptive non-parametric efficiency frontier analysis: Aneural network-based model.”Computers and Operation Research,2003, 30, PP. 279-295.
[8] Mostafa, M.M. “Evaluating the competitive market efficiency of top listed
companies in Egypt”, Journal of Economic Studies, 2007, Vol. 34, No. 5, pp. 430-52.
[9] Mostafa, M.M. “A probabilistic neural network approach for modeling and classifying efficiency of GCC banks”, International Journal of Business Performance Management, 2009, Vol. 11, No. 3, pp. 236-258.
[10] Wang, C-H, Lu, Y-H, Huang, C-W, and Lee, J-Y. “R&D, productivity, and market value: an empirical study from high-technology firms”, Omega,2013, Vol. 41, pp. 143-55.
[11] Kwon, H., B. Exploring the predictive potential of artificial neural networks in conjunction with DEA in railroad performance modeling, Int. J. Production Economics,2017, 183, pp. 159–170.
[12] Cattoufi, S. and Muhittin, O. Data envelopment Analysis Literature: a bibliography Update, Saio- Economic planning sciences, 2005, 38, PP. 159-229.
[13]Menhaj, M. Neural Networks Basics, 1st Volume, Publishied by Amirkabir University, 3rd Edition,2005:tehran.
[14] M.shafiei Nikabadi, H. Damghanian, and M. Dehghan. Identifying Key strategies of knowledgs Base companies.2014, Wap journal.
[15] G.R. shalkef .Artifical Neural Networks, 2003: published by chamran ahvaz uiversity, 1st Edition.
[17] Costa, A., Markellos, R.N. Evaluating public transport efficiency with neural network models. Transportation Research, 1997, 5 (5), 301–312.
[18] Pendharkar, P., Rodger, J. Technical efficiency-based selection of learning cases to improve forecasting accuracy of neural networks under monotonicity assumption. Decision Support Systems, 2003, 36 (1), 117–136.
[19] Santin, D. and Delgado, F.J. “The measurement of rechnical efficiency: a neural network approach.”Applied Economic, 2004, 36, PP. 627, 635.
[20] Emrouznejad, A., Shale, E. A. a combined neural network and DEA for measuring efficiency of large scale data sets. Computers and Industrial Engineering, 2009, 56, 249–254.
[21] Azadeh, A., Saberi, M., Tavakkoli Moghaddam, R., (2011), Javanmardi, L., An integrated Data Envelopment Analysis–Artificial Neural Network– Rough Set Algorithm for assessment of personnel efficiency, Expert Systems with Applications, (38), pp. 1985–1373.
[22] Y.Guo Xiao, Performance Evaluation of Airport Construction Energy-saving based on DEA Network Design and Performance Analysis, Procedia Environmental Sciences, 2011, 11, 358-364.
[23] Yong-Ming, H., Zhi-Qiang, G. & Qun-Xiong, Z., Energy optimization and prediction of complex petrochemical industries using an improved artificial neural network approach integrating data envelopment analysis, Energy Conversion and Management, 2016, 124, pp, 73–83.
[24] Shabanpour, H., Yousefi, S. & Farzipoor Saen, R., Forecasting efficiency
of green suppliers by dynamic data envelopment analysis and artificial neural networks, In Press, 2016, pp. 1-10.
[25] Vlontzos, G., and Pardalos, P. M., Assess and prognosticate green house gas emissions from agricultural production of EU countries, by implementing, DEA Window analysis and artificial neural networks, Renewable and Sustainable Energy Reviews,2017, 76, pp. 155–162.