Personal Wellbeing Score (PWS)—a
short version of ONS4: development
and validation in social prescribing
Tim Benson, 1,2 Joe Sladen,1,3 Andrew Liles,4,5 Henry W W Potts2
To cite: Benson T, Sladen J, Liles A, et al. Personal Wellbeing Score (PWS)—a short version of ONS4: development and validation in social prescribing. BMJ Open Quality 2019;8:e000394. doi:10.1136/ bmjoq-2018-000394
Received 31 March 2018 Revised 11 March 2019 Accepted 13 March 2019
1R-Outcomes Ltd, Thatcham, UK 2Institute of Health Informatics,
UCL, London, UK
3Wessex AHSN, Southampton,
UK
4R-Outcomes Ltd, Brighton, UK 5School of Management, Royal
Holloway University of London, Egham, UK
Correspondence to Dr Tim Benson;
tim. benson@ r- outcomes. com © Author(s) (or their employer(s)) 2019. Re-use permitted under CC BY-NC. No commercial re-use. See rights and permissions. Published by BMJ.
AbstrAct
Aims Our aim was to develop a short generic measure of subjective well-being for routine use in patient-centred care and healthcare quality improvement alongside other patient-reported outcome and experience measures.
Methods The Personal Wellbeing Score (PWS) is based on
the Office of National Statistics (ONS) four subjective well-being questions (ONS4) and thresholds. PWS is short, easy to use and has the same look and feel as other measures in the same family of measures. Word length and reading age were compared with eight other measures.
Anonymous data sets from five social prescribing projects were analysed. Internal structure was examined using distributions, intra-item correlations, Cronbach’s α and exploratory factor analysis. Construct validity was assessed based on hypothesised associations with health status, health confidence, patient experience, age, gender and number of medications taken. Scores on referral and after referral were used to assess responsiveness.
Results Differences between PWS and ONS4 include
brevity (42 vs 114 words), reading age (9 vs 12 years), response options (4 vs 11), positive wording throughout and a summary score. 1299 responses (60% female, average age 81 years) from people referred to social prescribing services were analysed; missing values were less than 2%. PWS showed good internal reliability (Cronbach’s α=0.90). Exploratory factor analysis suggested that all PWS items relate to a single dimension. PWS summary scores correlate positively with health confidence (r=0.60), health status (r=0.58), patient experience (r=0.30) and age group (r=0.24). PWS is responsive to social prescribing intervention.
Conclusions The PWS is a short variant of ONS4. It is
easy to use with good psychometric properties, suitable for routine use in quality improvement and health services research.
Background
Subjective well-being refers specifically to how people experience and evaluate their lives and specific domains and activities in their lives.1 2 It has several facets: (1)
eval-uative well-being (or life satisfaction), (2) eudemonic well-being (a sense of purpose and meaning in life) and (3) hedonistic well-being or affect (feelings of happiness, sadness etc). Hedonistic well-being includes both positive experiences, such as happiness, and negative experiences, such as anxiety. Only
the person involved can provide information about his or her personal well-being.
In 2009, the Stiglitz-Sen-Fitoussi Commission on the Measurement of Economic Performance and Social Progress recommended that national statistical agencies collect measures of subjec-tive well-being.3 In 2011, the UK Office of
National Statistics (ONS) introduced four subjective well-being questions (ONS4) in the Annual Population Survey.4–6 These
ques-tions are designated National Statistics and have been approved as a Government Statis-tical Service Harmonised Principle.7 The
four ONS4 questions relate to evaluative well-being, eudemonic well-being and positive and negative affect.8
Focus groups with members of the public conducted by ONS in 2013 found that the term personal well-being is clearer and simpler to understand than subjective well-being. In light of this, both the questions and findings from them have been referred to by ONS as
personal well-being since then.7
The Organisation for Economic Co-op-eration and Development (OECD) has developed a similar measure (OECD core questions), adding an extra affect question about depression.9
developmenT
In 2015, the North-East Hampshire and Farnham (NEHF) NHS Vanguard project (using the brand name Happy, Healthy at Home) was established.10 (Vanguards were projects funded by NHS England to test new care models). The project team identified a requirement for a short, easy-to-use measure of subjective well-being, to be used along-side short generic measures of health status (howRu),11 patient experience (howRwe)12
and health confidence (HCS).13 These
meas-ures share a strong family resemblance. Each measure has four question items and four response options, which are labelled, colour-coded and use emoji. They are generic
on September 12, 2020 by guest. Protected by copyright.
http://bmjopenquality.bmj.com/
on September 12, 2020 by guest. Protected by copyright.
http://bmjopenquality.bmj.com/
on September 12, 2020 by guest. Protected by copyright.
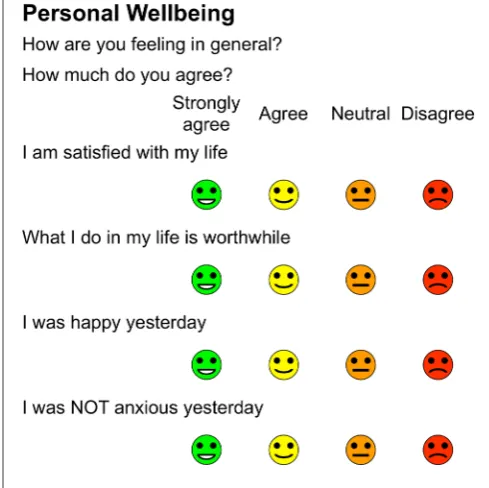
Figure 1 Initial version of Personal Wellbeing Score (2015). Figure 2 Personal Wellbeing Score.
(condition-independent), short and have a low reading age.
We reviewed the subjective well-being literature, and after considering alternatives, including the Short Warwick-Edinburgh Mental Wellbeing Scale,14 the
deci-sion was made to explore the feasibility of adapting the ONS4 questions to the R-Outcomes format. The ONS encourages the use and adaption of ONS4 within other government departments, local government, charities and the private sector.5
Design criteria for person-reported outcome measures include clarity, brevity, suitability for frequent use, multi-modality (suitability for use with multiple data collec-tion modalities including smartphones), responsiveness, good psychometric properties and easily understood scoring.15 16 Results should be easy to understand,
inter-pret and action by all stakeholders, and be comparable for benchmarking.
Initial draft versions of the Personal Wellbeing Score (PWS) were designed and the wording was refined using co-production with NEHF staff and patients. The first version to be tested with patients (2015) is shown in
figure 1. The final version is shown in figure 2.
The principal changes from ONS4 to the final version of PWS and the reasons for these are described below in terms of response options, items and scoring.
response options
The scale was changed from an 11-point scale, anchored at not at all=0 and completely=10, to four options: Strongly agree, Agree, Neutral and Disagree as used in other R-Out-comes measures. The response option Neutral was initially worded Neither agree nor disagree. It was changed to Not sure
because people thought that Neither agree nor disagree was
too clunky. However, Not sure implies lack of certainty and so it was finally changed to Neutral, which received no objections.
The PWS response options relate to the four threshold groups used in ONS4 publications.7 For ONS4 life
satis-faction, worthwhile and happiness scores, responses 9–10 are grouped as Very high, 7–8 as High, 5–6 as Medium
and 0–4 as Low. For anxiety scores, responses 6–10 are grouped as High, 4–5 as Medium, 2–3 as Low and 0–1 as
Very low.
The PWS has no strongly disagree option because in most populations, the results are strongly skewed towards high well-being scores and, in general, scales should approx-imate the actual distribution of the characteristic in the population.17 For example, in a study which used a
5-point variant of ONS4, only 2% of responses chose the option most closely matched to strongly disagree.18
The PWS response options are ordered left to right from best (Strongly agree) to worst (Disagree). However, in ONS4, the response options are ordered left to right from worst-to-best for three ONS4 items, and best-to-worst for anxiety.
PWS response options are usually colour-coded (Strongly agree is green, Agree is yellow, Neutral is orange and Disagree
is red) and annotated with emoji. Using a touch screen, respondents press the emoji representing the appropriate responses. Using paper, they tick, cross or circle them. All PWS items are optional and responses may be left blank.
Items
The ONS4 items were changed to reduce word count and reading age.
The life evaluation question Overall, how satisfied are you with your life nowadays? became I am satisfied with my life.
on September 12, 2020 by guest. Protected by copyright.
The worthwhile (eudemonia) question Overall, to what extent do you feel the things you do in your life are worthwhile?
became What I do in my life is worthwhile.
The positive affect question Overall, how happy did you feel yesterday? became I was happy yesterday.
The initial version (see figure 1) of the original ONS negative affect question Overall, how anxious did you feel yesterday? used the original ONS scale direction but, after input from users, the scale direction was reversed from negative to positive. It became I was NOT anxious yesterday. The potential problems of a double negative (not anxious) are offset by consistency between questions and simpler scoring and reporting.
Scoring
Each PWS item is scored as follows: Disagree=0, Neutral=1,
Agree=2 and Strongly Agree=3. A high score is better than a low score.
The PWS calculates a summary score as the sum of the four item scores, giving a 13-point scale from 0 (4×Disagree) to 12 (4×Strongly agree). ONS4 does not provide a summary score.
For populations, the mean item scores and summary score are transformed to a 0–100 scale; for items: (mean item score)×100/3; for summary score: (mean summary score)×100/12.
A common 0–100 scale allows the mean item and summary scores to be compared on the same scale. A score of 100 is obtained when all respondents choose the highest possible score (the ceiling) and 0 when all choose the lowest possible score (the floor).
meThodS
length and readability
The length and readability of PWS were compared with the standard version of ONS47 and OECD Core
Ques-tions9 and six other measures of well-being and related
concepts, which are used in the UK.19 20 These are ONS4
concise format,19 General Health Questionnaire,21
Short Warwick-Edinburgh Mental Wellbeing Scale,14
Euroqol EQ-5D-3L,22 ICECAP-A,23 and Adult Social Care
Outcomes Tool.24
Readability was measured using the Flesch-Kincaid Readability Grade.25 It has been recommended that
patients should not be asked to complete questionnaires with a reading age of more than 10,26 which corresponds
roughly to Flesch-Kincaid Readability Grade 5.
Testing and validation
We performed secondary analysis of data collected between April 2016 and March 2017 as part of the eval-uation of five social prescribing services in the Wessex region of England (Hampshire and surrounding districts) to examine the psychometric properties and construct validity of PWS.
Social prescribing is an intervention in healthcare, where a general practitioner or other healthcare prac-titioner refers patients with social or practical needs
to a local provider of non-clinical services, via a link worker.27–29
The evaluations used a mixed-methods approach,30
including economic, qualitative and survey methods. Each intervention was broadly similar but with minor differences in case mix, support skills and on-call avail-ability. The choice of measures and method of data collec-tion were agreed with each service in advance.
Each service used its own survey, which included PWS, howRu health status measure, howRwe patient experi-ence measure, health confidexperi-ence score (HCS), two items on service integration (services talk to each other and I don’t have to repeat my story), gender, age in deciles and number of medications being taken.
All surveys were in English and all items were optional. All responses were anonymous. As a general rule, all people seen during the period of the evaluation were asked to complete the surveys. The number of people who declined to participate in the whole survey was not recorded but is understood to be small.
Responses were collected (1) on referral at first visit to the patient’s home, and (2) 1 or 2 months after referral
and after the intervention. The exact dates were not recorded. Some after referral surveys were collected over the telephone in the home, but the mode of data collec-tion was not recorded. Most responses were recorded on a paper copy and transcribed later onto the R-Outcomes server. There was no linkage between responses on referral
and after referral.
Sample size, missing data and distribution: We measured the number of responses and missing data on referral and
after referral. A small number of responses (n=4) without a record of on referral or after referral cohort were excluded. Response distributions and summary statistics (including overall summary score, means, SD and proportion of responses in floor [lowest] and ceiling [highest] states) were calculated on referral, after referral, gender, age group and number of medications taken.
Internal consistency: The degree of interrelatedness among the items, assessed by correlations between the items, was expected to be in the range 0.4 to 0.6, with the strongest correlation between the pairs of items on positive and negative experience, then life evaluation and worthwhileness (convergent validity). We expected Cron-bach’s α to be between 0.7 and 0.9, which would support the use of an aggregate summary score.31
Factor analysis was applied to the whole data set (using an oblique rotation, Promax, as we expected constructs to be correlated) for the individual questions in PWS, health status (howRu), health confidence (HCS) and patient experience (howRwe) and the two additional experience questions asked.
Construct validity is the degree to which the scores of an instrument are consistent with hypotheses, such as internal relationships, relationships to scores of other instruments or differences between relevant groups, based on the assumption that the instrument validly measures the construct to be measured.32 This was
on September 12, 2020 by guest. Protected by copyright.
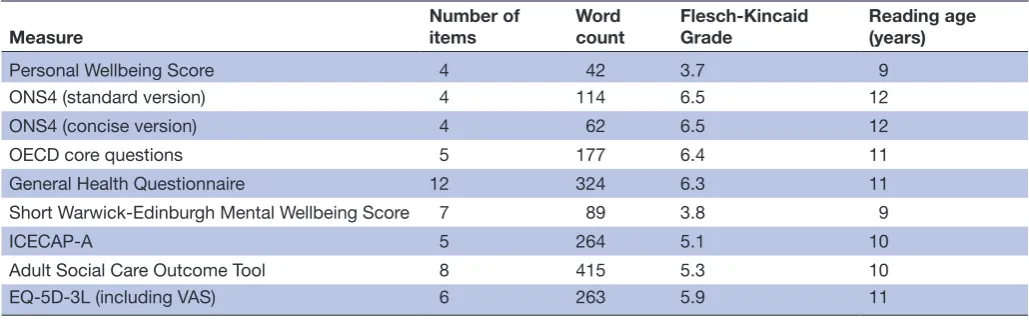
Table 1 Number of items, word count, Flesch-Kincaid Grade and reading age for related measures
Measure Number of items Word count Flesch-Kincaid Grade Reading age (years)
Personal Wellbeing Score 4 42 3.7 9
ONS4 (standard version) 4 114 6.5 12
ONS4 (concise version) 4 62 6.5 12
OECD core questions 5 177 6.4 11
General Health Questionnaire 12 324 6.3 11
Short Warwick-Edinburgh Mental Wellbeing Score 7 89 3.8 9
ICECAP-A 5 264 5.1 10
Adult Social Care Outcome Tool 8 415 5.3 10
EQ-5D-3L (including VAS) 6 263 5.9 11
VAS, visual analogue scale.
assessed by the measure being sensitive to clinical inter-ventions, such as the social prescribing service. We hypothesised that:
► Personal well-being would be lower on referral than
after referral.
► There would be little difference in personal well-being between men and women.
► Personal well-being would be positively associated health status, health confidence and, less strongly, with patient experience.
► Personal well-being would be higher in older people because older people tend to report higher well-being than those of working age.1 33
► Personal well-being would fall with the number of medications taken because well-being is positively correlated with health.
Responsiveness is the ability of an instrument to detect change over time in the construct to be measured. This was assessed by comparing the results of the on referral and
after referral cohorts.
ethics statement
We carried out secondary analysis of data collected as part of routine service evaluation of social prescribing services. The data were anonymous and undertaken to evaluate the current services without randomisation, so ethics approval was not required. No data were collected by the services until after patients had consented and there was no risk to individual participants.34
patient and public involvement
The need for a simple measure of personal well-being was an explicit finding of focus groups with patients organised by the NEHF Vanguard project, which led to the name Happy, Healthy at Home. Patients were asked to complete the surveys and complied willingly. The results of the evaluation projects were provided to participants to request comments and for feedback. This paper is based on secondary analysis of that data.
reSulTS
length and readability
Table 1 shows the number of items, word count, Flesch-Kincaid Grade and estimated reading age for PWS and eight other measures. PWS is shortest with lowest word count (42) and reading age (9).
Sample size, missing data and distribution
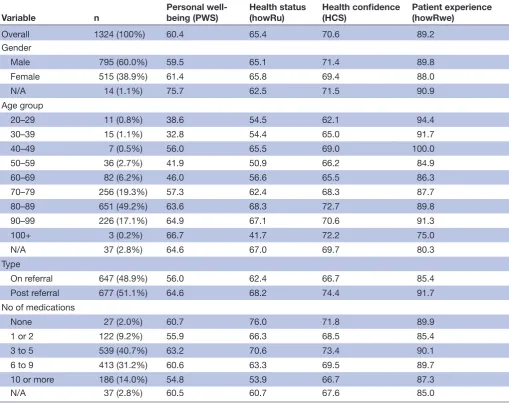
Table 2 shows frequency distributions and mean scores on 0–100 scales for personal well-being (PWS), health status (howRu), health confidence (HCS) and patient experience (howRwe) by gender, age group, encounter type and number of medications taken.
The frequency distribution for each PWS item is shown in table 3. The floor state accounted for 2.8% and the ceiling 15.2%. The distribution of responses covers the whole range, with no indication of problematic floor or ceiling effects.
All items in the survey were optional. Missing values for individual PWS items were between 0.8% and 1.3%. Missing data were identified in 25 (1.9%) across all four PWS items. This is similar to the proportion of missing data on other items, such as health status (howRu, 1.6%), health confidence (HCS, 1.1%), gender (1.1%), age decile (2.8%) and number of medications taken (2.8%).
Internal consistency
The highest inter-item correlations are between the two evaluative items I am satisfied with my life and What I do in my life is worthwhile (r=0.77) and the two experience items I was happy yesterday and I was NOT anxious yesterday
(r=0.73). The lowest inter-item correlation is between I am satisfied with my life and I was NOT anxious yesterday
(r=0.51). Correlations between individual items and the summary PWS score are all in the range r=0.83 to r=0.88.
Cronbach’s α=0.90 is at the top end of the expected range.
on September 12, 2020 by guest. Protected by copyright.
Table 2 Frequency distributions and mean scores for personal well-being (PWS), health status (howRu), health confidence (HCS) and patient experience (howRwe) by gender, age group, encounter type and number of medications taken
Variable n Personal well-being (PWS) Health status (howRu) Health confidence (HCS) Patient experience (howRwe)
Overall 1324 (100%) 60.4 65.4 70.6 89.2
Gender
Male 795 (60.0%) 59.5 65.1 71.4 89.8
Female 515 (38.9%) 61.4 65.8 69.4 88.0
N/A 14 (1.1%) 75.7 62.5 71.5 90.9
Age group
20–29 11 (0.8%) 38.6 54.5 62.1 94.4
30–39 15 (1.1%) 32.8 54.4 65.0 91.7
40–49 7 (0.5%) 56.0 65.5 69.0 100.0
50–59 36 (2.7%) 41.9 50.9 66.2 84.9
60–69 82 (6.2%) 46.0 56.6 65.5 86.3
70–79 256 (19.3%) 57.3 62.4 68.3 87.7
80–89 651 (49.2%) 63.6 68.3 72.7 89.8
90–99 226 (17.1%) 64.9 67.1 70.6 91.3
100+ 3 (0.2%) 66.7 41.7 72.2 75.0
N/A 37 (2.8%) 64.6 67.0 69.7 80.3
Type
On referral 647 (48.9%) 56.0 62.4 66.7 85.4
Post referral 677 (51.1%) 64.6 68.2 74.4 91.7
No of medications
None 27 (2.0%) 60.7 76.0 71.8 89.9
1 or 2 122 (9.2%) 55.9 66.3 68.5 85.4
3 to 5 539 (40.7%) 63.2 70.6 73.4 90.1
6 to 9 413 (31.2%) 60.6 63.3 69.5 89.7
10 or more 186 (14.0%) 54.8 53.9 66.7 87.3
N/A 37 (2.8%) 60.5 60.7 67.6 85.0
Table 3 Frequency counts (%) for each Personal Wellbeing Score item (n=1324)
Strongly agree Agree Neutral Disagree Missing items
I am satisfied with my life 315 (23.8%) 633 (47.8%) 239 (18.1%) 126 (9.5%) 11 (0.8%) What I do in my life is worthwhile 311 (23.5%) 574 (43.4%) 325 (24.5%) 97 (7.3%) 17 (1.3%) I was happy yesterday 312 (23.6%) 623 (47.1%) 234 (17.7%) 142 (10.7%) 13 (1.0%) I was NOT anxious yesterday 303 (22.9%) 525 (39.7%) 276 (20.8%) 205 (15.5%) 15 (1.1%)
Factor analysis results are shown in table 4. A scree plot implies four or six factors, while Kaiser’s crite-rion implies four. This supports the use of four scales measuring distinct constructs: personal well-being (PWS), health status (howRu), health confidence (HCS) and patient experience (howRwe). In this popu-lation, health status subdivides howRu into ‘disability’ and ‘distress’, similar to Rosser’s seminal classification of disability and distress.35 The PWS items are related
and distinct from other questions asked in the survey.
Factor analysis results were broadly the same when repeated on just the on referral and after referral data.
construct validity
The correlation between the PWS summary score and health status (howRu summary score) r=0.58; with health confidence (HCS summary score) r=0.60; with patient experience (howRwe summary score) r=0.30; with age decile r=0.24; with number of medications r=−0.05
on September 12, 2020 by guest. Protected by copyright.
Table 4 Factor analysis results, using oblique rotation, Promax, showing weights over 0.3
Item Factor 1 Factor 2 Factor 3 Factor 4 Factor 5 Factor 6
howRu 1 0.51
howRu 2 0.51
howRu 3 0.77
howRu 4 0.82
PWS 1 0.69
PWS 2 0.67
PWS 3 0.87
PWS 4 0.82
HCS 1 0.61
HCS 2 0.46
HCS 3 0.71
HCS 4 0.71
howRwe 1 0.85
howRwe 2 0.91
howRwe 3 0.88
howRwe 4 0.91
Services talk to each other 0.36 0.42
No need to repeat story 0.61 0.39
Table 5 Mean scores (95% CI) on 0–100 scale for Personal Wellbeing Score (PWS) summary and item scores, on referral and after referral
Variable On referral mean (95% CI) After referral mean (95% CI)
Mean difference
n 633 666
PWS Summary Score 56.0 (53.9 to 58.1) 64.6 (62.8 to 66.5) 8.6
I am satisfied with my life 57.9 (55.5 to 60.3) 66.3 (64.2 to 68.4) 8.4 What I do in my life is worthwhile 57.2 (54.9 to 59.6) 65.2 (63.2 to 67.3) 8.0
I was happy yesterday 56.7 (54.2 to 59.2) 66.0 (63.9 to 68.1) 9.3
I was NOT anxious yesterday 52.5 (49.8 to 55.2) 61.1 (58.8 to 63.5) 8.6
(p=0.08). All correlations other than with number of medications are significant (p<0.00001).
The number of women (60%) is greater than the number of men, but their mean summary PWS score is not statistically different (p=0.20).
Age is skewed to older age groups with 64% of partic-ipants over 80 years old and 16% over 90. Older partici-pants tend to report higher well-being than younger. In this population of people referred to social prescribing, the mean summary PWS score for participants under 70 is 44, which is low (n=146); for those over 70, summary PWS is 63 (n=1118).
responsiveness
The mean scores and 95% CIs of the PWS summary score and each item on 0–100 scale on referral and after referral
are shown in table 5. Differences between on referral and
after referral mean scores are all significant (two-tailed t-test, p<0.00001). The mean scores for people who have
received social prescribing services were higher after the intervention (PWS=65) than before (PWS=56), which demonstrates responsiveness.
dIScuSSIon
Strengths and limitations
The PWS has been adapted from the Office of National Statistics ONS4 to work alongside other R-Outcomes meas-ures. It is shorter (42 vs 114 words) with a lower reading age (9 vs 12 years). People were happy to answer the PWS questions, as indicated by low numbers of missing values. It meets a need for a short practical measure of well-being that can be used routinely at the point of care.
High internal consistency, as measured by inter-item correlations and Cronbach’s α, suggests that it is appro-priate to use a single summary score for this instrument, as well as individual item scores.
on September 12, 2020 by guest. Protected by copyright.
Use of secondary analysis of anonymous data collected for a different primary purpose presented some prob-lems. Data collection methods did not capture how many patients declined to participate although we have anec-dotal evidence that this number was low.
The proportion of missing data for items within the survey was between 0.8% and 1.3%, and 1.9% across all four items. This compares favourably with reported missing value rates for items in SF-36 and EQ-5D of 3.1% and 4.3%, respectively.36 In a sample of 65 000
preoper-ative questionnaires for hip replacement surgery, EQ-5D has 5.2% missing values.37
We only have on referral and after referral cohorts. Anon-ymous data do not allow test–retest reliability, inter-rater reliability or change within individuals to be estimated.
The on referral ratings were collected face-to-face, but some after referral ratings were collected by telephone. There is evidence that telephone surveys may elicit slightly higher ratings for well-being than face-to-face interviews,38
but we have no data about the mode of administration. The study population comprised people receiving social prescribing interventions, mostly over 80, with multiple conditions. Further research is needed to explore the performance of the PWS in other populations.
comparison with existing literature
Our results are consistent with hypotheses to test construct validity. PWS summary scores are strongly related to health confidence and health status, moderately with age group, but not with number of medications taken or gender.
Analysis of ONS4 in the Annual Population Survey shows a strong relationship with self-reported health, employment status and living alone, and a moderate asso-ciation with age.31 39 Our results agree with this for
self-re-ported health status and age, but we have no data about employment status or whether people lived alone (which may be a proxy for loneliness).
A strong association has been reported between subjec-tive well-being and successful goal pursuit, which is likely to be closely associated with health confidence.40 The
PWS score for our data has a strong association with the health confidence, as measured by the HCS.
Personal well-being generally follows a U-shaped pattern, lower in middle age and higher as people get older.1 33 We found this pattern in our population. The
mean PWS of people under 70 years old was lower (43.6) than those over 70 (62.5). This age effect may be excep-tionally strong in our population because people are not referred to social prescribing unless they have problems that may benefit from social prescribing. Such referrals are not common in younger people.
In PWS, all items are worded positively. Factor analysis and internal correlations suggest that all items behave in a similar way. In ONS4, the anxiety item is worded nega-tively, while other items are worded positively. Factor anal-ysis on ONS4 data shows that positively and negatively worded items relate to different factors.18 This is the main
difference between PWS and ONS4. In future research, it is desirable to compare PWS directly against ONS4.
Implications for practice
The PWS questions were asked within a longer survey covering health status, health confidence and patient experience as well as personal well-being. More than 68% of people who completed these surveys were aged over 80, and many were in poor health. This demonstrates the practicality of using the PWS with these populations.
The PWS questions are generic and are worded posi-tively. They are easy to use and, unlike some other measures of mental well-being appear to be highly accept-able, as indicated by the low numbers of missing values.41
The PWS is being used routinely as a key performance indicator in commissioned social prescribing programmes in the Wessex region.42
concluSIonS
The PWS is a short variant of ONS4, designed for routine collection of data about subjective well-being. It is shorter and has a lower reading age than other widely used instru-ments. In evaluation studies of social prescribing, it was responsive to the interventions, easy to use, with few missing values, good psychometric results, strong correla-tion with concurrent measures of health status and health confidence, and construct validity.
Acknowledgements We are grateful to the patients and staff in North East Hampshire and Farnham who contributed to the development of the Personal Wellbeing Score, to social prescribers and patients in Wessex who collected the data, and to Alexis Foster of Sheffield University for valuable suggestions on an earlier draft of this paper.
Contributors TB designed the questionnaire and wrote the first draft of the paper. TB, HWWP and JS performed the analyses. JS and AL were actively involved in the data collection. All authors contributed to the final text, read and approved the final manuscript.
Funding The data were collected as part of evaluations of social prescribing systems by Wessex AHSN (Academic Health Science Network).
Competing interests TB and AL are directors and shareholders in R-Outcomes Ltd, which provides quality improvement and evaluation services using the Personal Wellbeing Score. Please contact R-Outcomes Ltd if you wish to use it. HWWP has received consultancy fees from Crystallise, System Analytic and The HELP Trust and received funding from myownteam and Shift. ms, unrelated to the work reported herein. The authors declare that they have no other conflicting interests. Patient consent for publication Not required.
Provenance and peer review Not commissioned; externally peer reviewed. Data sharing statement No additional data are available.
Open access This is an open access article distributed in accordance with the Creative Commons Attribution Non Commercial (CC BY-NC 4.0) license, which permits others to distribute, remix, adapt, build upon this work non-commercially, and license their derivative works on different terms, provided the original work is properly cited, appropriate credit is given, any changes made indicated, and the use is non-commercial. See: http:// creativecommons. org/ licenses/ by- nc/ 4. 0/.
references
1. Steptoe A, Deaton A, Stone AA. Subjective wellbeing, health, and ageing. Lancet 2015;385:640–8.
on September 12, 2020 by guest. Protected by copyright.
2. National Research Council. Subjective well-being: measuring happiness, suffering and other dimensions of experience. The National Academies Press, 2014.
3. Stiglitz J, Sen A, Fitoussi J-P. Report by the Commission on the Measurement of Economic Performance and Social Progress, 2009. Available: www. stiglitz- sen- fitoussi. fr
4. Dolan P, Metcalfe R. Measuring subjective wellbeing:
recommendations on measures for use by national governments. J
Soc Policy 2012;41:409–27.
5. Tinkler L. The Office for National Statistics experience of collecting and measuring subjective well-being. Statistics in Transition new
series 2015;16:373–96.
6. Allin P, Hand DJ. New statistics for old?—measuring the wellbeing of the UK. J R Stat Soc Ser A Stat Soc 2017;180:3–43.
7. ONS. GSS Harmonised principle—Harmonised concepts and questions for social data sources—personal well-being. v2.0 Government Statistical Service, 2017. Available: https:// gss. civilservice. gov. uk/ wp- content/ uploads/ 2016/ 03/ Personal- Well- being- June- 17- Pending- informing- SPSC. pdf [Accessed 26 Feb 2019].
8. ONS. Personal well-being in the UK QMI Newport: Office for National Statistics 2016.
9. OECD. OECD guidelines on measuring subjective well-being. OECD publishing 2013.
10. Happy healthy at home project web site. Available: http://www. happyhealthyathome. org [Accessed 17 Dec 2017].
11. Benson T, Sizmur S, Whatling J, et al. Evaluation of a new short generic measure of health status: howRu. Inform Prim Care
2010;18:89–101.
12. Benson T, Potts HWW. A short generic patient experience questionnaire: howRwe development and validation. BMC Health
Serv Res 2014;14.
13. Benson T, Potts HW, Bowman C. Development and validation of a short health confidence score. Value in Health 2016;19.
14. Stewart-Brown S, Tennant A, Tennant R, et al. Internal construct validity of the Warwick-Edinburgh mental well-being scale (WEMWBS): a Rasch analysis using data from the Scottish health education population survey. Health Qual Life Outcomes 2009;7. 15. Fitzpatrick R, Fletcher A, Gore S, et al. Quality of life measures
in health care. I: applications and issues in assessment. BMJ
1992;305:1074–7.
16. Mokkink LB, Terwee CB, Patrick DL, et al. The COSMIN checklist for assessing the methodological quality of studies on measurement properties of health status measurement instruments: an
international Delphi study. Qual Life Res 2010;19:539–49. 17. Dillman DA, Smyth JD, Christian LM. Internet, phone, mail, and
mixed-mode surveys: the tailored design method. John Wiley & Sons, 2014.
18. Palmer V, Evans E. Opinions and lifestyle survey: methodological investigation into response scales in personal well-being. Newport: Office for National Statistics, 2015.
19. Peasgood T, Brazier JE, Mukuria C, et al. A conceptual comparison of well-being measures used in the UK. policy research unit in economic evaluation of health and social care interventions (EEPRU) (26), 2014. Available: http:// eprints. whiterose. ac. uk/ 99497 [Accessed 26 Feb 2019].
20. Mukuria C, Rowen D, Peasgood T, et al. An empirical comparison of well-being measures used in the UK. policy research unit in economic evaluation of health and social care interventions (EEPRU) (27), 2016. Available: http:// eprints. whiterose. ac. uk/ 99499/ [Accessed 26 Feb 2019].
21. Goldberg D, Williams P. A user's guide to the GHQ. Windsor: NFER Nelson, 1988.
22. Brooks R. EuroQol: the current state of play. Health Policy
1996;37:53–72.
23. Al-Janabi H, Flynn TN, Coast J. Development of a self-report measure of capability wellbeing for adults: the ICECAP-A. Qual Life Res 2012;21:167–76.
24. Malley JN, Towers A-M, Netten AP, et al. An assessment of the construct validity of the Ascot measure of social care-related quality of life with older people. Health Qual Life Outcomes 2012;10. 25. Kincaid JP, Fishburne Jr RP, Rogers RL, et al. Derivation of new
readability formulas (automated readability index, fog count and Flesch reading ease formula) for navy enlisted personnel. Naval Technical Training Command Millington TN Research Branch, 1975.
26. Paz SH, Liu H, Fongwa MN, et al. Readability estimates for commonly used health-related quality of life surveys. Qual Life Res
2009;18:889–900.
27. Brandling J, House W. Social prescribing in general practice: adding meaning to medicine. Br J Gen Pract 2009;59:454–6.
28. Bickerdike L, Booth A, Wilson PM, et al. Social prescribing: less rhetoric and more reality. A systematic review of the evidence. BMJ Open 2017;7:e013384.
29. Rempel ES, Wilson EN, Durrant H, et al. Preparing the prescription: a review of the aim and measurement of social referral programmes.
BMJ Open 2017;7:e017734.
30. Rutter H, Savona N, Glonti K, et al. The need for a complex systems model of evidence for public health. Lancet 2017;390:2602–4. 31. Streiner D, Norman G. Health measurement scales: a practical guide
to their development and use. 4th edn. Oxford: Oxford University Press, 2008.
32. Mokkink LB, Terwee CB, Patrick DL, et al. The COSMIN study reached international consensus on taxonomy, terminology, and definitions of measurement properties for health-related patient-reported outcomes. J Clin Epidemiol 2010;63:737–45.
33. Steel M. Measuring national being: at what age is personal well-being the highest? Newport: Office for National Statistics, 2016. 34. NHS Health Research Authority. Defining research: research ethics
service guidance to help you decide if your project requires review by a research ethics committee. UK Health Departments’ Research Ethics Service, 2016.
35. Rosser RM, Watts VC. The measurement of hospital output. Int J
Epidemiol 1972;1:361–8.
36. Essink-Bot ML, Krabbe PF, Bonsel GJ, et al. An empirical
comparison of four generic health status measures. the Nottingham health profile, the medical outcomes study 36-item short-form health survey, the COOP/WONCA charts, and the EuroQol instrument. Med Care 1997;35:522–37.
37. Gair D. Finalised patient reported outcome measures (PROMs) in England—data quality note: April 2017 to March 2018. NHS digital 2019.
38. Dolan P, Kavetsos G. Happy talk: mode of administration effects on subjective well-being. J Happiness Stud 2016;17:1273–91. 39. Oguz S, Merad S, Snape D. Measuring national well-being—what
matters most to personal well-being. Newport: Office for National Statistics, 2013.
40. Klug HJP, Maier GW. Linking goal progress and subjective well-being: a meta-analysis. J Happiness Stud 2015;16:37–65. 41. Crawford MJ, Robotham D, Thana L, et al. Selecting outcome
measures in mental health: the views of service users. J Ment Health
2011;20:336–46.
42. Liles A, Darnton P, Sibley A, et al. How we are evaluating the impact of new care models on how people feel in Wessex. Wessex AHSN, 2017. Available: http:// wessexahsn. org. uk/ img/ news/ Evaluating Patient Outcomes in Wessex. pdf [Accessed 26 Feb 2019].
on September 12, 2020 by guest. Protected by copyright.
Correction:
Personal Wellbeing Score (PWS)—a short version
of ONS4: development and validation in social prescribing
Benson T, Sladen J, Liles A, et al. Personal Wellbeing Score (PWS)—a short version of ONS4: development and validation in social prescribing. BMJ Open Quality
2019;8:e000394
The authors want to alert readers to the following error identified in the published version.
The Figure 1 was incorrectly published in which the bottom line of the figure should read “I was anxious yesterday” rather “I was NOT anxious yesterday”. Please refer to the below corrected figure for your reference.
Open access This is an open access article distributed in accordance with the Creative Commons Attribution Non Commercial (CC BY-NC 4.0) license, which permits others to distribute, remix, adapt, build upon this work non-commercially, and license their derivative works on different terms, provided the original work is properly cited, appropriate credit is given, any changes made indicated, and the use is non-commercial. See: http:// creativecommons. org/ licenses/by-nc/4.0/ © Author(s) (or their employer(s)) 2019. Re-use permitted under CC BY-NC. No commercial re-use. See rights and permissions. Published by BMJ.