AUTUMN 2017, Vol 3, No 2, JOURNAL OF HYDRAULIC STRUCTURES Shahid Chamran University of Ahvaz
Journal of Hydraulic Structures J. Hydraul. Struct., 2017; 3(2):62-77
DOI: 10.22055/jhs.2018.24762.1064
Finding the Causes and Evaluating Their Impacts on Urmia
Lake Crisis Using a Comprehensive Water Resources
Simulation Model
Alireza B. Dariane1 Leila Eamen2
Abstract
Urmia Lake in northwestern Iran has been facing critical water level shrinkage in recent years with serious environmental consequences. It is expected that with the current trend, the lake will be completely dried out in a few years from now. This study attempts to assess the impacts of human activities on water level fluctuations of Urmia Lake by developing a comprehensive hydrologic simulation model. Model development and calibration was carefully accomplished by utilizing effective water resources management components in the basin. An important contribution was accomplished by properly estimating the agricultural water demand and consumption in the absence of measured data. Result of long-term simulation reveals that excessive water consumption by inefficient and expanding irrigated agriculture is the main reason for Urmia Lake shrinkage. It was found that main reservoirs are only responsible for 23% of current situation. Whereas, 77% of the current crisis has been caused by miscellaneous agricultural water withdrawals in the basin.
Keywords: Agricultural Development Projects, Comprehensive Water Resources Simulation, Lake Level Fluctuations, Urmia Lake Basin.
Received: 12 August 2017; Accepted: 24 November 2017
1. Introduction
Lakes are fundamental constituent of any ecosystem around the world. The lives of many species and habitats depend on proper functioning of these water bodies. Recent changes in the trend of climatic variables along with over exhausting of limited water resources through intensified irrigated agriculture has resulted in serious escalations in lake ecosystems around the
1 Department of Civil Engineering, K.N. Toosi University of Technology, Valiasr St., Tehran, Iran, Associate Professor, [email protected] (Corresponding author)
AUTUMN 2017, Vol 3, No 2, JOURNAL OF HYDRAULIC STRUCTURES Shahid Chamran University of Ahvaz
globe. Nevertheless, in some cases like the Aral Sea the consequence has been devastating leaving a permanent damage without any hope of reconstructing the original system. Obviously, the first step in solving any problem is to get a proper and sufficient knowledge of the problem itself.
On the other hand, natural systems are very complicated and usually require extensive time, expertise, and nationwide willingness to tackle the problem. This requires having a multi-objective prospective of the problem so that a tradeoff could be made between the expansions of, for example, water utilization projects and the wellbeing of the basin ecosystem. This is another way of setting a balance between the short term benefits from water utilization projects and the long term damages caused by altering the ecosystem of the basin. Through this process the optimum level of developments could be established. Moreover, the consequences of overexploitation of water resources of the basin on key components of the system can be determined through these investigations. Therefore, a comprehensive study should consist of modeling all factors that are important in shaping the future of the basin.
Human activities have a substantial impact on the quantity and quality of water resources of a basin, mainly through extended irrigated agricultural practices. An ongoing population growth, water pollution and lack of efficient water supply system along with competitions among different water use sectors for maximizing their share of water consumption are main factors, besides the climate change, that threaten the sustainability of water resources systems around the world. As a result, the number of basins with water scarcity crisis and irreparable damages, like the Aral Sea basin, is continuously increasing. Under these circumstances, proper management and planning of water resources for allocating the scarce available water becomes very crucial. On the other hand, basin planning that considers only one aspect of water use, such as the agriculture, would eventually intensify the problem by neglecting the role of other sectors of the system. Hence, the right solution would be through adopting an integrated water resources management (IWRM) approach for the basin. Successful IWRM requires strong political supports and is essential for sustainable use of water resources through environmental considerations. One of the first steps in integrated water resources management is to evaluate the amount of water resources and the demands of the basin and go through a long term simulation to find out how the system behaves. This is accomplished by developing comprehensive simulation models.
There are several basin wide simulation models that have been used in IWRM studies. Sulis and Sechi (2013) made a comparison of five generic basin-wide simulating models including AQUATOOL (Valencia Polytechnic University), MODSIM (Colorado State University), RIBASIM (DELTARES), WARGI-SIM (University of Cagliari) and WEAP (Stockholm Environmental Institute) [1]. There is wide range of researchers find the Water Evaluating and Planning system (WEAP) a powerful tool to simulate water resources and demands of river basins and investigate results of different development, water policy and other scenarios on water balance of the basin including Raskin et al. (1992), Levite et al. (2003), Bharati et al. (2009) and Mourad and Alshihabi (2016) [2,3,4,5]. Hashemi et al. (2010) proposed an integrated methodological framework to implement IWRM in Urmia Lake basin [6].
AUTUMN 2017, Vol 3, No 2, JOURNAL OF HYDRAULIC STRUCTURES Shahid Chamran University of Ahvaz
continuous development of irrigated agricultural projects throughout the basin in the past decades along with changes in the trend of precipitation and temperature have worked together to dry up nearly 90% of the Lake surface today [7]. It is also interesting to note that the long term mean LWL of the Lake Urmia, which was about 1276 metre (m) during 1976-1998 period, dropped as much as 4.9 m during 1999-2009 decade [8].
Other studies also point out that the climate change and irrigated agriculture are the main factors affecting Urmia Lake water level [e.g. 9,10,11]. A main problem with the past studies in this basin is the lack of water demand and consumption, mainly agricultural, that made them to use rough estimations. It is evident that without any reliable measured data, rough assumptions could lead us to erroneous results. Therefore, this paper attempts to solve this problem through developing a comprehensive basin-wide simulation model, which once calibrated could be used for the evaluation of different planning scenarios. Also, it would be used to evaluate the impacts of agricultural water use on the LWL by implementing different scenarios. Through this the role of each water use sector (especially agriculture) in causing the current critical situation of the Lake is determined. This information could be used for finding solutions to revive the Lake and also for laying out the future plan of the basin.
1.1. Study Area
Urmia Lake basin with an area of about 52 thousand square kilometres is located in northwestern Iran. Three provinces sharing the basin are west Azerbaijan, east Azerbaijan and Kurdistan. Main rivers discharging into the Lake are Zarrineroud, Simineroud, Ajichay, Shahrchay, Sufichay, Mahabadroud, Godarroud, Ghalechay, Barandouzchay, Nazloochay, Rozechay and Zoolachay. During recent decades various development projects were proposed in the basin. Some of these projects are now in operation while some others are under construction or feasibility study phases. In this study six main operational reservoirs are considered in the simulation model, including Boukan, Mahabad, Shahrchay, Alavian, Hassanlou and Nahand reservoirs. Figure (1) shows the location of Urmia Lake basin, main rivers and main operational reservoirs.
Fig. 1 The location of Urmia Lake basin, main rivers and six operational reservoirs
AUTUMN 2017, Vol 3, No 2, JOURNAL OF HYDRAULIC STRUCTURES Shahid Chamran University of Ahvaz
during 1966-2012 period (Figure 2). As it can be seen from Figure 2, during critical decade of 1995-2004, precipitation mostly remained below the long-term average (360 mm), while at the same time above average temperatures (11°C) were observed, indicating a critical condition on water resources of the basin. High temperatures result in increased agricultural water demand, whereas low precipitations limit the amount of water production in the basin. Together, they can cause severe drought and stressful condition as it was also observed during those years in the region. Year 1995 is also the period where the shrinkage in the Lake Urmia began (see Figure 5) and the lake level continued to fall up to now. It is also interesting to note that although after 2004 the precipitation began to rise above the long-term average (Figure 2), the lake level decline did not stop and continued to fall to more sever lower levels (Figure 5), probably due to persistent more higher than normal temperatures resulting in higher water demands throughout the basin.
Fig. 2 Mean annual temperature and precipitation of the basin
Figure (3) shows total inflow to the Lake during the study period. As it can be seen from this Figure, during critical period of 1995-2012 the inflow to the Lake is mostly below the long-term average (solid line). We can divide the critical period beginning from 1995 into two distinct period of 1995-2004 and 2004-2012. During the first decade-long critical period, precipitation is considerably below average, temperature is slightly above average (Figure 2), and annual lake inflow has sharply dropped below average (i.e., 2904 million cubic metre (mcm)) with an exception in 2002 (Figure 3), probably as a result of consistent precipitation rise which began in 1998 and relatively near normal annual temperature during this year. During the second critical period, temperature is even higher and well above the long-term average, but precipitation has also increased to above normal levels (Figure 2). However, total inflow has continued to stay in below average condition (Figure 3) regardless of higher precipitations, which could be attributed to exceptionally higher temperatures during these years. Regardless of the aforementioned trends and variations in the precipitation trend, the lake level has continued to drop sharply since 1995 throughout the last year in the study period (i.e., 2012).
150 200 250 300 350 400 450 500 550 600 650 7 8 9 10 11 12 13 14 15
1966 1968 1970 1972 1974 1976 1978 1980 1982 1984 1986 1988 1990 1992 1994 1996 1998 2000 2002 2004 2006 2008 2010 2012
R ai n fa ll (m m ) Te m pe ra tur e ( C) Year
AUTUMN 2017, Vol 3, No 2, JOURNAL OF HYDRAULIC STRUCTURES Shahid Chamran University of Ahvaz
Fig. 3 Total inflow to the Lake and its long term average (solid line)
2. Methods
2.1. Simulating Model
Integrated approach in studying water resources systems requires the development of a proper model which is capable of handling different components of the system with the needed precision. In this study, WEAP software was used for developing a model to simulate the interactions among water resources and demands on the one hand and the Urmia Lake level fluctuations on the other. WEAP, developed at the Stockholm Environment Institute, is a policy oriented simulating model which can be used for comprehensive water resources studies. It has an integrated approach in simulating water resources systems [12]. The model, using a linear programming algorithm, is capable of allocating available water among different demand sites with user-defined priorities. In fact, the priorities could be set for both sources (i.e., reservoirs, surface and groundwater) and sinks (i.e., water demand sites).
In this research, observed data during the historical period of 1966-2012 were used for the development and evaluation of Urmia Lake basin model. Spatial information such as the basin boundary, rivers and location of operational reservoirs were first generated in a Geographic Information System (GIS) and then used in the WEAP model. Schematic of WEAP model for Urmia Lake basin is shown in Figure (4).
AUTUMN 2017, Vol 3, No 2, JOURNAL OF HYDRAULIC STRUCTURES Shahid Chamran University of Ahvaz
Fig. 4 Schematic of Urmia Lake basin water resources system model in WEAP
It should be mentioned that in most developing countries, like Iran, surveys and censuses are not processed regularly each year but rather they are gathered every few years. Therefore, valid information about the amounts and characteristics of water resources and demands, mostly for agricultural use, are unavailable in a regular basis and estimating methods should be applied to fill the gaps. Meanwhile, the surveys are very rough and mainly concentrate on large areas. Noting that the size of agricultural fields in Iran is mainly small and unlike many countries farmers own scattered small size fields, an accurate estimation of irrigated area is very challenging.
2.2. Calibration Method
AUTUMN 2017, Vol 3, No 2, JOURNAL OF HYDRAULIC STRUCTURES Shahid Chamran University of Ahvaz
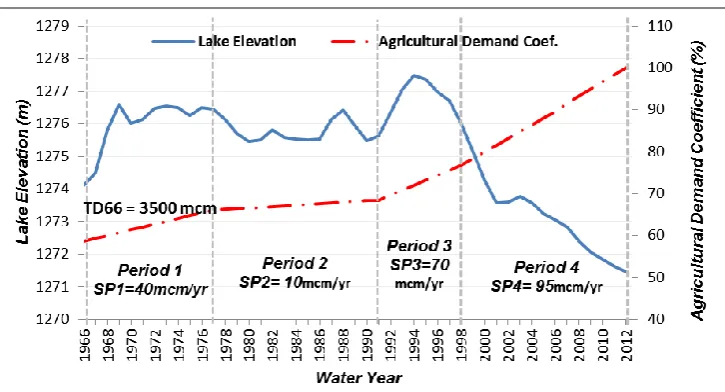
Period 1: 1966-1976 (mean LW L: 1275.81 m) Period 2: 1977-1990 (mean LWL: 1275.80 m) Period 3: 1991-1997 (mean LWL: 1277.12 m) Period 4: 1998-2012 (mean LWL: 1273.14 m)
Fig. 5 Linearized agricultural demand coefficients during four periods
The first period indicates the initial stage with the least development in the basin until 1977 when the Boukan (see Figure 1) as the first major reservoir began to operate. Period 2 includes the beginning of Boukan reservoir operation until 1991 when the Lake water level started to rise (Figure 5) due to increased precipitation (Figure 2) and increased lake inflow (Figure 3). 1977 to 1991 was also the period of imposed Iraq war on Iran where the trend of various project developments including the agriculture was very slow due to the nations’ budgetary limitations. The third period is the era of so called “reconstruction” after the war. It also represents a duration of high water level in the Urmia Lake due to above normal precipitations (Figure 2), below normal temperatures (Figure 2), and mostly above normal inflows (Figure 3). In 1998 the Lake began to fall below its mean LWL of 1276.1 m by that time, a trend which has consistently continued up to now. Thus, the fourth period resembles the period of Lake Urmia shrinkage and desiccation. The calibration process determines both the level of initial agricultural water consumption in year 1966 and the slopes of developments during the above mentioned four periods as shown in Figure 5 through a trial and error process.
AUTUMN 2017, Vol 3, No 2, JOURNAL OF HYDRAULIC STRUCTURES Shahid Chamran University of Ahvaz
volume of the water losses through evaporation. Therefore, the mass balance equation of the Lake is highly sensitive to the rate of evaporation, and in the absence of precise measurements and concerning the uncertainties inherent in the process, must be determined through calibration using the initially estimated values.
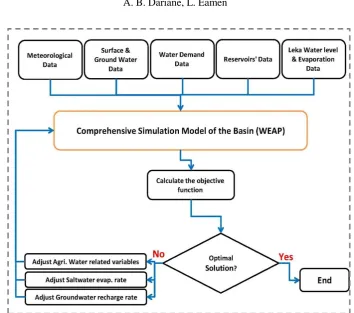
Groundwater recharge is another important parameter in the basin water balance model which must be also determined through calibration process in the absence of any data. The effect of recharging groundwater through precipitation and surface water was included through applying reductions on the river flow as a function of continued droughts. Therefore, the amount of surface water used for recharging groundwater is assumed to be a function of both drought intensity and its persistence. A coefficient was defined and found by calibration to adjust the amount of total water used for recharging the groundwater in each sub-basin under a defined drought condition. Therefore, three main categories are used for accomplishing the model calibration where each may involve several decision variables. These include adjustments on agricultural water demand during each of the above mentioned periods, adjustments on evaporation from lake’s surface (saltwater), and finally adjustments on groundwater recharge rate as function of continued drought period.
The objective of the calibration process is to minimize the sum of errors between the observed and simulated LWLs during the historical period (1966-2012). A trial and error method is used for calibrating the model. Statistical criteria used for evaluating the performance of the model during the calibration and test periods are coefficient of determination (Equation 1), Nash-Sutcliffe efficiency (Equation 2) and Root Mean Square Error (Equation 3).
𝑅2= ( ∑𝑛𝑖=1((𝑂𝐿𝑖−𝑂𝐿̅̅̅̅)(𝑆𝐿𝑖−𝑆𝐿̅̅̅̅)) √∑𝑛𝑖=1(𝑂𝐿𝑖−𝑂𝐿̅̅̅̅)2∑𝑛𝑖=1(𝑆𝐿𝑖−𝑆𝐿̅̅̅̅)2
)
2
(1)
𝑁𝑆𝐸 = 1 −∑𝑛𝑖=1(𝑂𝐿𝑖−𝑆𝐿𝑖)2 ∑𝑛𝑖=1(𝑂𝐿𝑖−𝑂𝐿̅̅̅̅)2
(2)
𝑅𝑀𝑆𝐸 = √∑𝑛𝑖=1(𝑆𝐿𝑖−𝑂𝐿𝑖)2
𝑛 (3)
Where, OLi and SLi are the observed and simulated LWLs at the beginning of month i, and 𝑂𝐿
AUTUMN 2017, Vol 3, No 2, JOURNAL OF HYDRAULIC STRUCTURES Shahid Chamran University of Ahvaz
Fig. 6 Flowchart showing the simulation model structure and its calibration
Figure (7) shows the calibrated and observed LWL of Urmia Lake during the study period (1966-2012). A visual comparison of modeled and observed LWL indicates a good fit. Moreover, the performance of the calibrated model was evaluated by coefficient of determination (R2), Nash-Sutcliffe Index (NSE) and root mean square error (RMSE), where their corresponding values were found as 0.98, 0.97 and 0.005 respectively.
Fig. 7 Simulated and observed LWL of Urmia Lake (1966-2012)
AUTUMN 2017, Vol 3, No 2, JOURNAL OF HYDRAULIC STRUCTURES Shahid Chamran University of Ahvaz
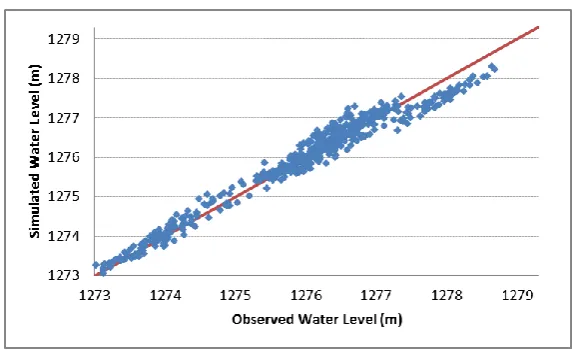
also shown in Figure (8) where the solid line indicates the perfect match.
Fig. 8 Observed and simulated LWL of the Lake
As it can be seen from Figure (8), performance of the model is very good especially for LWLs under 1277 m. However, for water surface elevations above this level the model shows an underestimation trend. It is possible that the bias for high LWLs is due to measurement errors in hydrometric stations during wet years where large floods occur. Another source of error during wet years could be due to less water consumption by crops where part of their demand is met by precipitation. Also, in wet years greater part of irrigation demand could be supplied through groundwater sources that have been replenished by plentiful precipitation. All these may contribute to actually more water flows into the Lake during wet years. The simulation model however is not able to capture such a process due to the lack of precise information. Meanwhile, the overall error and fitness of the model is very good and in accordance with the objectives of this research. The model has been able to closely catch the variations of LWL indicating that the proposed algorithm has been successful.
Furthermore, a comparison of total water demand estimated by the model with few available census data indicates a good agreement in terms of their trend. For example, the ratio of total water demand estimated by the model to the census data during 1996, 2001, and 2006 is respectively 1.3, 1.2, and 1.4, which indicates the precision of the model. Nevertheless, as mentioned earlier the recorded data are expected to underestimate the true water demand of the basin by focusing on major water use projects. On the other hand, the model shows that the true water demand of the basin is about 30% more than that indicated by the recorded data.
2.3. Scenarios
The Lake level study in this paper was initially carried out for revealing the main causes of the current critical situation. These findings can then be used to determine short-term and long-term solutions for restoring the Lake Urmia.
AUTUMN 2017, Vol 3, No 2, JOURNAL OF HYDRAULIC STRUCTURES Shahid Chamran University of Ahvaz
LWL changes through long term model simulation. Water use scenarios are defined as follows:
1. No Operational Reservoirs (NoRes): Impact of operational reservoirs and their water demands (mainly agricultural) is evaluated in this scenario by eliminating them from the system according to their starting operation date.
2. No Other Withdrawals (NoWdr): All other water withdrawals (mainly agricultural) are eliminated to assess their role on Lake level fluctuations.
3. No Reservoirs and No Other Withdrawals (NoRes & Wdr): This scenario is implemented to show the impact of combined actions. In fact, it shows a situation where human related water use activities in the basin are removed and thus indicates the natural and intact basin condition.
It is worthwhile to mention that in Urmia basin nearly 92% of water consumption is used by agriculture, 6% by municipal, and the remaining 2% by industrial sectors. Therefore, agriculture is the main water use sector in the area either through regulated reservoir releases or other types of water withdrawals from surface and groundwater sources.
According to a study the minimum acceptable water level required for the Lake to survive ecologically is found to be 1274 m [14]. The Lake is home to a unique brine shrimp species, artemia urmiana, and supports many species of reptiles, amphibians and mammals [15]. Water levels less than this elevation may cause serious hazards on ecology of the Lake including the artemia population and the basin as well.
3. Results and Discussions
The normal values are usually calculated using the whole study period, i.e., 1966-2012 in this case. However, noting that the lake has entered a completely drying and abnormal situation more than a decade ago, such a calculation would not represent the lake hydrology and the conclusions derived from these figures could be erroneous. For example, long-term mean LWL would be 1275 meters using 1966-2012 period which indicates that years 1968 through 2000 (about consecutive 32 years) are all above normal or otherwise wet periods. The mean LWL, surface area and storage volume calculated using the whole period is 1275.15 m, 5076 km2, and 30335 mcm, respectively. This divides the lake into two distinct period of above normal 1966-2000 and below normal 2001-2012. However, if only the healthy period of the lake is considered, using the years 1966 through 2000 mean LWL, surface area and storage would be 1276.03 m, 5405 km2, and 34944 mcm, respectively. In this case, alternating above and below normal situations are observed. Obviously in both cases the period after year 2000 is considered as abnormally dry.
The calibrated model was used to evaluate the impacts of different human activities on water level fluctuations of the Lake. As explained in the previous section, the role of different activities including reservoir constructions and other miscellaneous water withdrawals on current Lake crisis is investigated.
AUTUMN 2017, Vol 3, No 2, JOURNAL OF HYDRAULIC STRUCTURES Shahid Chamran University of Ahvaz
However, our investigation shows (not included in this paper) that also unlike what official authorities have been claiming the climate change is not to be blamed for the extent of current situation. The current situation is rather a direct consequence of ignoring the principles of sustainable development in the region. At least in the last three decades the development of agriculture industry with a goal of self-sufficiency has been the main objective in the country. Therefore, it is not surprising to see the rapidly growing demand for water and the rushing emergence of various water resources projects in the basin during the “reconstruction” era after the early 1990s when Iran-Iraq war ended. A closer look at the slope of agricultural water demand after 1992 (periods 3 and 4) in Figure 5 makes it clear that water consumption gained a rapid slope after this date.
According to our results, by removing water consumption through “Other Withdrawals” (i.e., NoWdr scenario) the LWL would have risen by 5.2 meters (equivalent to 22,325 mcm in volumetric measures) in 2012. Whereas, for removing water consumptions through operational reservoirs (i.e., NoRes scenario) the rise in LWL would be only 1.9 meters (6,676 mcm of lake water), which indicates much less impact than the aforementioned scenario. As it can be seen from Figure (9), combined removal of “No Other Withdrawals” and “No Operational Reservoirs” scenarios would increase the LWL by about 6.4 meters (29001 mcm of water) in year 2012. Therefore, main reservoirs are only responsible for 23% of current situation. Whereas, miscellaneous agricultural water withdrawals are responsible for 77% of the current Lake Urmia crisis.
Fig. 9 Comparison of LWL under different water resources development scenarios
AUTUMN 2017, Vol 3, No 2, JOURNAL OF HYDRAULIC STRUCTURES Shahid Chamran University of Ahvaz
by “other withdrawals” also increases with time as a result of increased water demand. While removing other withdrawals (i.e., NoWdr) in the first stage raises the LWL by less than 3 meters, in the second (1977-1990), third (1991-1997) and final stage (1998-2012) it raises the LWL by about 3.6, 3.5, and 5.2 meters, respectively. A review of the gap between the observed LWL and NoWdr scenario reveals the growing extent of miscellaneous water use projects in the basin during these years.
Fig. 10 Comparison of LWL under water resources development scenarios at the ending year of four time periods
AUTUMN 2017, Vol 3, No 2, JOURNAL OF HYDRAULIC STRUCTURES Shahid Chamran University of Ahvaz
Fig. 11 Comparison of Urmia Lake surface area under different scenarios at the ending year of four time periods
The results of this study reveal that the number one factor in causing the current Urmia Lake crisis is the miscellaneous water withdrawals throughout the basin by means other than reservoirs. These water withdrawals consist of legal and illegal surface and in specific groundwater. In the surface water, there are also small reservoirs mostly without any documentations and records that were constructed by local authorities mainly during the last three decades. Since these reservoirs are very small and numerous, and mostly without any documentation, we do not include them in “operational reservoirs” category which consists only of large reservoirs in the basin. There are also many illegally constructed wells which are scattered around the basin and in specific near the Lake shores. Nevertheless, the total water utilized through these small projects has much considerable impact on the LWL than the main reservoirs. These projects were made gradually through the time by local people without any concern on their long-term impact. People in the region highly rely on these projects which are twisted with their daily life. Therefore, there seems to be no short-term and quick solution to the problem. However, noting that the current irrigation efficiency in the area is less than 35% and that 92% of the total water utilization is by the agriculture, a long-term solution should aim at modernizing the irrigation system and freeing more water into the Lake.
AUTUMN 2017, Vol 3, No 2, JOURNAL OF HYDRAULIC STRUCTURES Shahid Chamran University of Ahvaz
4. Conclusion
A simulation model was developed using WEAP software to study the water resources system of Urmia Lake basin. A calibration procedure was proposed and carried out using the historical data for 1966-2012 period with NSE equal to 0.97. Further analysis showed that the miscellaneous water withdrawals (mainly through wells, Qanats, and river diversions) play an important role on the hydrology of the Lake Urmia. The operational reservoirs and their corresponding demand sites are the next important factor in causing the current critical situation of the Lake. It was found that by removing other withdrawals (i.e., NoWdr scenario) the LWL would have risen by 5.2 meters (equivalent to 22,325 mcm of lake storage) in 2012. Whereas, for removing water consumptions through operational reservoirs (i.e., NoRes scenario) the rise in LWL would be only 1.9 meters (equivalent to 6,676 mcm of lake storage), which indicates much less impact than the aforementioned scenario. Therefore, main reservoirs are only responsible for 23% of current situation. Whereas, miscellaneous agricultural water withdrawals are responsible for 77% of the current Lake Urmia crisis.
It is suggested that the solution should consist of short-term and long-term comprehensive action plans and should consider all the effective components in the basin.
5. References
[1] Sulis A, Sechi GM (2013) Comparison of generic simulation models for water resources systems. Environmental Modeling & Software, 40, 214-225.
[2] Raksin P, Hansen E, Zhu Z, Stavisky D (1992) Simulation of water supply and demand in the Aral Sea region. Water International, 17(2), 55-67.
[3] Levite H, Sally H, Cour J (2003) Testing water demand management scenarios in a water-stressed basin in South Africa: application of the WEAP model. Physics and Chemistry of the Earth,28, 779-786.
[4] Bharati L, Smakhtin VU, Anand BK (2009) Modeling water supply and demand scenarios: the Godavari-Krishna inter-basin transfer, India. Water Policy, Supplement 1, 140-153.
[5] Mourad KA, Alshihabi O (2016) Assessment of future Syrian water resources supply and demand by the WEAP model, Hydrological Science Journal, 61:2, 393-401.
[6] Hashemi M, O’Connell PE, Amezaga JM, Parkin G (2010) A socio-technical framework for implementing Integrated Water Resources (IWRM) plan in Lake Urmia basin, Iran. In: Managing Consequences of a Changing Global Environment, BHS Third International Symposium, British Hydrological Society, 19-23 July 2010, Newcastle University.
[7] MEHRNEWS (2014) http://www.mehrnews.com/detail/News/2343495, [Accessed 5 August 2014, In Farsi].
[8] Raveshty MA, Maruyama Y (2010) Study of Urmia Lake level fluctuations and predict probable changes using multi-temporal satellite images and ground truth data period (1976-2010). In: Map Asia 2010 & ISG 2010, 26-28 July 2010, Kuala Lumpur, Malaysia. [9] Eimanifar A, Mohebbi F (2007) Urmia Lake (Northwest Iran): a brief review. Saline
AUTUMN 2017, Vol 3, No 2, JOURNAL OF HYDRAULIC STRUCTURES Shahid Chamran University of Ahvaz
[10] Hassanzadeh E, Zarghami M, Hassanzadeh Y (2012) Determining the main factors in declining the Urmia Lake level by using System Dynamics Modeling. Water Resources Management,26, 129-145.
[11] Azizi G, Abbasi F (2013) The climate change technology and management in the drying Lake Urmia. In: EIC Climate Change Technology Conference, 27-29 May 2013, Concordia University, Montreal, Quebec.
[12] Sieber J, Purkey D (2011) WEAP User guide. Stockholm Environmental Institute, U.S. Center.
[13] Mahab-Ghodss Consulting Engineering (2012) Integrated Water Resources Management Study of Urmia Lake basin. (InFarsi).
[14] Regional Council of Lake Urmia Basin Management (2012) Drought risk management plan for Lake Urmia basin. Working group on sustainable management of water resources and agriculture. (In Farsi).