A Monthly Double-Blind Peer Reviewed (Refereed/Juried) Open Access International e-Journal - Included in the International Serial Directories
Indexed & Listed at:
VOLUME NO.3(2013),ISSUE NO.05(MAY) ISSN 2231-5756
INTERNATIONAL JOURNAL OF RESEARCH IN COMMERCE, IT & MANAGEMENT
CONTENTS
CONTENTS
CONTENTS
CONTENTS
Sr.No.
TITLE & NAME OF THE AUTHOR (S)
Page No.
1. PERFORMANCE EFFICIENCY OF AGRICULTURAL MARKET COMMITTEES (AMCS) IN INDIA – DATA ENVELOPMENT ANALYSIS (DEA) APPROACH
E. S. V. NARAYANA RAO, A. A. CHARI & K. NIRMAL RAVI KUMAR
1
2. A STUDY ON COMPETITIVE INDIAN BANKING INDUSTRY WITH REFERENCE TO PRE E-BANKING AND POST E-BANKING
SRI HARI.V, SUNIL RASHINKAR, DR. B. G SATYA PRASAD, DR. SREENIVAS.D.L & AJATASHATRUSAMAL
6
3. ONLINE SERVICE QUALITY AND CUSTOMER SATISFACTION – A STUDY IN INTERNET BANKING
J. NANCY SEBASTINA & DR. N. YESODHA DEVI
10
4. AN EMPIRICAL STUDY ON THE EFFECTS OF COMPUTER OPERATING HOURS ON STUDENT STRESS LEVEL USING TOPSIS METHOD
DR. RAVICHANDRAN. K, DR. MURUGANANDHAM. R & VENKATESH.K
15
5. IMPLICATION OF INNOVATION AND AESTHETICS FOR BUSINESS GROWTH AMONG SMALL AND MEDIUM SCALE ENTERPRISES (SMEs): THE CASE STUDY OF BONWIRE KENTE WEAVING INDUSTRY
DR. GORDON TERKPEH SABUTEY, DR. J. ADU-AGYEM & JOHN BOATENG
27
6. A COMPARATIVE STUDY OF ONLINE OFF-CAMPUS COUNSELING FOR ADMISSION TO ENGINEERING INSTITUTIONS IN INDIA
VIJAY BHURIA & R. K. DIXIT
40
7. CUSTOMER SATISFACTION TOWARDS THE CHARGES AND SERVICES OF THIRD PARTY LOGISTICS SERVICES FOR INTERNATIONAL TRADE – AN EMPIRICAL STUDY
P. NALINI & DR. D. MURUGANANDAM
44
8. GROWTH AND DEVELOPMENT OF MSME IN NORTH-EAST INDIA
CHIKHOSALE THINGO & SUBHRANGSHU SEKHAR SARKAR
49
9. GREEN MARKETING: HABITUAL BEHAVIOUR OF HOUSEHOLDS WITH SPECIAL REFERENCE TO KAKINADA, EAST GODAVARI DISTRICT, ANDHRA PRADESH
DR. V. V. RATNAJI RAO CHOWDARY & R. SREENIVASA RAO
54
10. A GENERALIZED CLASS OF PREDICTIVE ESTIMATORS OF FINITE POPULATION MEAN IN SAMPLE SURVEYS
MANJULA DAS
60
11. FINANCIAL LEVERAGE AND CAPITAL STRUCTURE PLANNING IN SMALL-SCALE INDUSTRIES
DR. VINOD KUMAR YADAV
64
12. IMPACT OF SERVICE QUALITY ON SATISFACTION AND LOYALTY: CASE OF SINJAY RESTAURANT
PRIBANUS WANTARA
69
13. E – COMMERCE RISK ANALYSIS USING FUZZY LOGIC
S. R. BALAJI, R. DEEPA & A. VIJAY VASANTH
74
14. A SECTORWISE ANALYSIS OF NON PERFORMING ASSET IN STATE BANK OF TRAVANCORE
DEVI PREMNATH, BALACHANDRAN .S & GEETHU JAMES
82
15. SOFTWARE DEFECT PREDICTION USING REGRESSION STRATEGY
R. DEEPA & A. VIJAY VASANTH
88
16. SUGGESTED MODEL FOR XBRL ADOPTION
AWNI RAWASHDEH
93
17. PURCHASE PERIOD WITH REFERENCE TO CONSUMERS’ OF HOUSEHOLD COMPUTERS OF VELLORE DISTRICT IN INDIA
DR. D.MARIA ANTONY RAJ
97
18. PRIMARY EDUCATION IN INDIA
DR. T. INDRA
101
19. DEVELOPMENT OF AN ORGANIZATIONAL CAPABILITY PROFILE FOR SMALL BUSINESS FIRMS IN JAMMU AND KASHMIR
AASIM MIR
104
20. LIQUIDITY RISKS MANAGEMENT PRACTICES BY COMMERCIAL BANKS IN BANGLADESH: AN EMPIRICAL STUDY
ARJUN KUMAR DAS, SUJAN KANTI BISWAS & MOURI DEY
107
21. AN ANALYSIS OF COST OF PRODUCTION OF BANANA AND PROFITABILITY AT NARSINGDI AND GAZIPUR DISTRICT IN BANGLADESH
MOSAMMAD MAHAMUDA PARVIN, MD. NOYON ISLAM, FAIJUL ISLAM & MD. HABIBULLAH
113
22. THE ENTREPRENEURSHIP DEVELOPMENT IN VOCATIONAL & TECHNICAL TRAINING (A CASE STUDY: KASHAN)
MARYAM FIROUZI & DR. MOHAMMAD REZA ASGARI
119
23. MANAGING CURRICULUM CHANGE IMPLEMENTATION IN GHANA: DOES GENDER MAKE A DIFFERENCE IN TEACHER CONCERNS?
COSMAS COBBOLD
125
24. OVERCOMING THE PERCEIVED BARRIERS OF E-COMMERCE TO SMALL AND MEDIUM SCALE ENTERPRISES IN GHANA – A PROPOSED MODEL
AMANKWA, ERIC & KEVOR MARK-OLIVER
129
25. ORIGINAL EQUIPMENT MANUFACTURING IN ETHIOP
M. NARASIMHA, R. REJIKUMAR, K. SRIDHAR¬ & ACHAMYELEH AEMRO KASSIE
138
26. AN ANALYSIS OF COST OF PRODUCTION OF GROUNDNUT AND PROFITABILITY AT MANIKGONJ DISTRICT IN BANGLADESH
ABU ZAFAR AHMED MUKUL, FAZLUL HOQUE & MD. MUHIBBUR RAHMAN
144
27. LEVEL OF JOB SATISFACTION OF GARMENTS WORKER: A CASE STUDY ON SAVAR AREA IN DHAKA DISTRICT
MOSSAMAD MAHAMUDA PARVIN, FAZLUL HOQUE, MD. MUHIBBUR RAHMAN & MD. AL-AMIN
151
28. INDIRECT TAX SYSTEM IN INDIA
C. AZHAKARRAJA.
159
29. BOARD MECHANISMS AND PROFITABILITY OF COMMERCIAL BANKS IN KENYA
MUGANDA MUNIR MANINI & UMULKHER ALI ABDILLAHI
162
30. FOOD SECURITY AND PUBLIC DISTRIBUTION SYSTEM IN INDIA: AN ANALYSIS
HARSIMRAN SINGH & JAGDEV SINGH
170
CHIEF PATRON
CHIEF PATRON
CHIEF PATRON
CHIEF PATRON
PROF. K. K. AGGARWAL
Chancellor, Lingaya’s University, Delhi
Founder Vice-Chancellor, Guru Gobind Singh Indraprastha University, Delhi
Ex. Pro Vice-Chancellor, Guru Jambheshwar University, Hisar
FOUNDER
FOUNDER
FOUNDER
FOUNDER PATRON
PATRON
PATRON
PATRON
LATE SH. RAM BHAJAN AGGARWAL
Former State Minister for Home & Tourism, Government of Haryana
Former Vice-President, Dadri Education Society, Charkhi Dadri
Former President, Chinar Syntex Ltd. (Textile Mills), Bhiwani
CO
CO
CO
CO----ORDINATOR
ORDINATOR
ORDINATOR
ORDINATOR
AMITA
Faculty, Government M. S., Mohali
ADVISORS
ADVISORS
ADVISORS
ADVISORS
DR. PRIYA RANJAN TRIVEDI
Chancellor, The Global Open University, Nagaland
PROF. M. S. SENAM RAJU
Director A. C. D., School of Management Studies, I.G.N.O.U., New Delhi
PROF. M. N. SHARMA
Chairman, M.B.A., Haryana College of Technology & Management, Kaithal
PROF. S. L. MAHANDRU
Principal (Retd.), Maharaja Agrasen College, Jagadhri
EDITOR
EDITOR
EDITOR
EDITOR
PROF. R. K. SHARMA
Professor, Bharti Vidyapeeth University Institute of Management & Research, New Delhi
CO
CO
CO
CO----EDITOR
EDITOR
EDITOR
EDITOR
DR. BHAVET
Faculty, Shree Ram Institute of Business & Management, Urjani
EDITORIAL ADVISORY BOARD
EDITORIAL ADVISORY BOARD
EDITORIAL ADVISORY BOARD
EDITORIAL ADVISORY BOARD
DR. RAJESH MODI
Faculty, Yanbu Industrial College, Kingdom of Saudi Arabia
PROF. SANJIV MITTAL
University School of Management Studies, Guru Gobind Singh I. P. University, Delhi
PROF. ANIL K. SAINI
Chairperson (CRC), Guru Gobind Singh I. P. University, Delhi
DR. SAMBHAVNA
VOLUME NO.3(2013),ISSUE NO.05(MAY) ISSN 2231-5756
INTERNATIONAL JOURNAL OF RESEARCH IN COMMERCE, IT & MANAGEMENT
DR. MOHENDER KUMAR GUPTA
Associate Professor, P. J. L. N. Government College, Faridabad
DR. SHIVAKUMAR DEENE
Asst. Professor, Dept. of Commerce, School of Business Studies, Central University of Karnataka, Gulbarga
ASSOCIATE EDITORS
ASSOCIATE EDITORS
ASSOCIATE EDITORS
ASSOCIATE EDITORS
PROF. NAWAB ALI KHAN
Department of Commerce, Aligarh Muslim University, Aligarh, U.P.
PROF. ABHAY BANSAL
Head, Department of Information Technology, Amity School of Engineering & Technology, Amity
University, Noida
PROF. A. SURYANARAYANA
Department of Business Management, Osmania University, Hyderabad
DR. SAMBHAV GARG
Faculty, Shree Ram Institute of Business & Management, Urjani
PROF. V. SELVAM
SSL, VIT University, Vellore
DR. PARDEEP AHLAWAT
Associate Professor, Institute of Management Studies & Research, Maharshi Dayanand University, Rohtak
DR. S. TABASSUM SULTANA
Associate Professor, Department of Business Management, Matrusri Institute of P.G. Studies, Hyderabad
SURJEET SINGH
Asst. Professor, Department of Computer Science, G. M. N. (P.G.) College, Ambala Cantt.
TECHNICAL ADVISOR
TECHNICAL ADVISOR
TECHNICAL ADVISOR
TECHNICAL ADVISOR
AMITA
Faculty, Government M. S., Mohali
FINANCIAL ADVISORS
FINANCIAL ADVISORS
FINANCIAL ADVISORS
FINANCIAL ADVISORS
DICKIN GOYAL
Advocate & Tax Adviser, Panchkula
NEENA
Investment Consultant, Chambaghat, Solan, Himachal Pradesh
LEGAL ADVISORS
LEGAL ADVISORS
LEGAL ADVISORS
LEGAL ADVISORS
JITENDER S. CHAHAL
Advocate, Punjab & Haryana High Court, Chandigarh U.T.
CHANDER BHUSHAN SHARMA
Advocate & Consultant, District Courts, Yamunanagar at Jagadhri
SUPERINTENDENT
SUPERINTENDENT
SUPERINTENDENT
SUPERINTENDENT
SURENDER KUMAR POONIA
CALL FOR MANUSCRIPTS
CALL FOR MANUSCRIPTS
CALL FOR MANUSCRIPTS
CALL FOR MANUSCRIPTS
Weinvite unpublished novel, original, empirical and high quality research work pertaining to recent developments & practices in the area of Computer, Business, Finance, Marketing, Human Resource Management, General Management, Banking, Education, Insurance, Corporate Governance and emerging paradigms in allied subjects like Accounting Education; Accounting Information Systems; Accounting Theory & Practice; Auditing; Behavioral Accounting; Behavioral Economics; Corporate Finance; Cost Accounting; Econometrics; Economic Development; Economic History; Financial Institutions & Markets; Financial Services; Fiscal Policy; Government & Non Profit Accounting; Industrial Organization; International Economics & Trade; International Finance; Macro Economics; Micro Economics; Monetary Policy; Portfolio & Security Analysis; Public Policy Economics; Real Estate; Regional Economics; Tax Accounting; Advertising & Promotion Management; Business Education; Management Information Systems (MIS); Business Law, Public Responsibility & Ethics; Communication; Direct Marketing; E-Commerce; Global Business; Health Care Administration; Labor Relations & Human Resource Management; Marketing Research; Marketing Theory & Applications; Non-Profit Organizations; Office Administration/Management; Operations Research/Statistics; Organizational Behavior & Theory; Organizational Development; Production/Operations; Public Administration; Purchasing/Materials Management; Retailing; Sales/Selling; Services; Small Business Entrepreneurship; Strategic Management Policy; Technology/Innovation; Tourism, Hospitality & Leisure; Transportation/Physical Distribution; Algorithms; Artificial Intelligence; Compilers & Translation; Computer Aided Design (CAD); Computer Aided Manufacturing; Computer Graphics; Computer Organization & Architecture; Database Structures & Systems; Digital Logic; Discrete Structures; Internet; Management Information Systems; Modeling & Simulation; Multimedia; Neural Systems/Neural Networks; Numerical Analysis/Scientific Computing; Object Oriented Programming; Operating Systems; Programming Languages; Robotics; Symbolic & Formal Logic and Web Design. The above mentioned tracks are only indicative, and not exhaustive.
Anybody can submit the soft copy of his/her manuscript anytime in M.S. Word format after preparing the same as per our submission guidelines duly available on our website under the heading guidelines for submission, at the email address: [email protected].
GUIDELINES FOR SUBM
GUIDELINES FOR SUBM
GUIDELINES FOR SUBM
GUIDELINES FOR SUBMISSION OF MANUSCRIPT
ISSION OF MANUSCRIPT
ISSION OF MANUSCRIPT
ISSION OF MANUSCRIPT
1. COVERING LETTER FOR SUBMISSION:
DATED: _____________ THE EDITOR
IJRCM
Subject: SUBMISSION OF MANUSCRIPT IN THE AREA OF.
(e.g. Finance/Marketing/HRM/General Management/Economics/Psychology/Law/Computer/IT/Engineering/Mathematics/other, please specify)
DEAR SIR/MADAM
Please find my submission of manuscript entitled ‘___________________________________________’ for possible publication in your journals.
I hereby affirm that the contents of this manuscript are original. Furthermore, it has neither been published elsewhere in any language fully or partly, nor is it under review for publication elsewhere.
I affirm that all the author (s) have seen and agreed to the submitted version of the manuscript and their inclusion of name (s) as co-author (s).
Also, if my/our manuscript is accepted, I/We agree to comply with the formalities as given on the website of the journal & you are free to publish our contribution in any of your journals.
NAME OF CORRESPONDING AUTHOR: Designation:
Affiliation with full address, contact numbers & Pin Code: Residential address with Pin Code:
Mobile Number (s): Landline Number (s): E-mail Address: Alternate E-mail Address:
NOTES:
a) The whole manuscript is required to be in ONE MS WORD FILE only (pdf. version is liable to be rejected without any consideration), which will start from
the covering letter, inside the manuscript.
b) The sender is required to mentionthe following in the SUBJECT COLUMN of the mail:
New Manuscript for Review in the area of (Finance/Marketing/HRM/General Management/Economics/Psychology/Law/Computer/IT/ Engineering/Mathematics/other, please specify)
c) There is no need to give any text in the body of mail, except the cases where the author wishes to give any specific message w.r.t. to the manuscript. d) The total size of the file containing the manuscript is required to be below 500 KB.
e) Abstract alone will not be considered for review, and the author is required to submit the complete manuscript in the first instance.
f) The journal gives acknowledgement w.r.t. the receipt of every email and in case of non-receipt of acknowledgment from the journal, w.r.t. the submission
of manuscript, within two days of submission, the corresponding author is required to demand for the same by sending separate mail to the journal.
2. MANUSCRIPT TITLE: The title of the paper should be in a 12 point Calibri Font. It should be bold typed, centered and fully capitalised.
3. AUTHOR NAME (S) & AFFILIATIONS: The author (s) full name, designation, affiliation (s), address, mobile/landline numbers, and email/alternate email address should be in italic & 11-point Calibri Font. It must be centered underneath the title.
VOLUME NO.3(2013),ISSUE NO.05(MAY) ISSN 2231-5756
INTERNATIONAL JOURNAL OF RESEARCH IN COMMERCE, IT & MANAGEMENT
5. KEYWORDS: Abstract must be followed by a list of keywords, subject to the maximum of five. These should be arranged in alphabetic order separated bycommas and full stops at the end.
6. MANUSCRIPT: Manuscript must be in BRITISH ENGLISH prepared on a standard A4 size PORTRAIT SETTING PAPER. It must be prepared on a single space and single column with 1” margin set for top, bottom, left and right. It should be typed in 8 point Calibri Font with page numbers at the bottom and centre of every page. It should be free from grammatical, spelling and punctuation errors and must be thoroughly edited.
7. HEADINGS: All the headings should be in a 10 point Calibri Font. These must be bold-faced, aligned left and fully capitalised. Leave a blank line before each heading.
8. SUB-HEADINGS: All the sub-headings should be in a 8 point Calibri Font. These must be bold-faced, aligned left and fully capitalised.
9. MAIN TEXT: The main text should follow the following sequence:
INTRODUCTION
REVIEW OF LITERATURE
NEED/IMPORTANCE OF THE STUDY
STATEMENT OF THE PROBLEM
OBJECTIVES
HYPOTHESES
RESEARCH METHODOLOGY
RESULTS & DISCUSSION
FINDINGS
RECOMMENDATIONS/SUGGESTIONS
CONCLUSIONS
SCOPE FOR FURTHER RESEARCH
ACKNOWLEDGMENTS
REFERENCES
APPENDIX/ANNEXURE
It should be in a 8 point Calibri Font, single spaced and justified. The manuscript should preferably not exceed 5000 WORDS.
10. FIGURES &TABLES: These should be simple, crystal clear, centered, separately numbered & self explained, and titles must be above the table/figure. Sources of data should be mentioned below the table/figure. It should be ensured that the tables/figures are referred to from the main text.
11. EQUATIONS:These should be consecutively numbered in parentheses, horizontally centered with equation number placed at the right.
12. REFERENCES: The list of all references should be alphabetically arranged. The author (s) should mention only the actually utilised references in the preparation of manuscript and they are supposed to follow Harvard Style of Referencing. The author (s) are supposed to follow the references as per the following:
•
All works cited in the text (including sources for tables and figures) should be listed alphabetically.•
Use (ed.) for one editor, and (ed.s) for multiple editors.•
When listing two or more works by one author, use --- (20xx), such as after Kohl (1997), use --- (2001), etc, in chronologically ascending order.•
Indicate (opening and closing) page numbers for articles in journals and for chapters in books.•
The title of books and journals should be in italics. Double quotation marks are used for titles of journal articles, book chapters, dissertations, reports, workingpapers, unpublished material, etc.
•
For titles in a language other than English, provide an English translation in parentheses.•
The location of endnotes within the text should be indicated by superscript numbers.PLEASE USE THE FOLLOWING FOR STYLE AND PUNCTUATION IN REFERENCES: BOOKS
•
Bowersox, Donald J., Closs, David J., (1996), "Logistical Management." Tata McGraw, Hill, New Delhi.•
Hunker, H.L. and A.J. Wright (1963), "Factors of Industrial Location in Ohio" Ohio State University, Nigeria.CONTRIBUTIONS TO BOOKS
•
Sharma T., Kwatra, G. (2008) Effectiveness of Social Advertising: A Study of Selected Campaigns, Corporate Social Responsibility, Edited by David Crowther &Nicholas Capaldi, Ashgate Research Companion to Corporate Social Responsibility, Chapter 15, pp 287-303.
JOURNAL AND OTHER ARTICLES
•
Schemenner, R.W., Huber, J.C. and Cook, R.L. (1987), "Geographic Differences and the Location of New Manufacturing Facilities," Journal of Urban Economics,Vol. 21, No. 1, pp. 83-104.
CONFERENCE PAPERS
•
Garg, Sambhav (2011): "Business Ethics" Paper presented at the Annual International Conference for the All India Management Association, New Delhi, India,19–22 June.
UNPUBLISHED DISSERTATIONS AND THESES
•
Kumar S. (2011): "Customer Value: A Comparative Study of Rural and Urban Customers," Thesis, Kurukshetra University, Kurukshetra.ONLINE RESOURCES
•
Always indicate the date that the source was accessed, as online resources are frequently updated or removed.WEBSITES
SOFTWARE DEFECT PREDICTION USING REGRESSION STRATEGY
R. DEEPA
STUDENT
CHRIST COLLEGE OF ENGINEERING & TECHNOLOGY
PUDUCHERRY
A. VIJAY VASANTH
SR. ASST. PROFESSOR
DEPARTMENT OF COMPUTER SCIENCE & ENGINEERING
CHRIST COLLEGE OF ENGINEERING & TECHNOLOGY
PUDUCHERRY
ABSTRACT
In this paper we apply a machine learning method for the problem of estimating the number of defects called Regression Strategy (RS). RS initially automatically discretizes the number of defects into a number of defective classes, then forms a new model that finds the fault class of a software system. Finally, RS transforms the class output of the model back into a numeric detection. This way includes uncertainty in the models because apart from a certain number of defects, it also outputs a link interval of values, within which this estimate lies, with a certain quality level. To evaluate this method we perform a comparative experiment for analysis of the effectiveness of several machine learning algorithms in a software data. The data was collected and involves applications maintained by a Super Market in India.
KEYWORDS
Regression Technique, Software Engineering, Software Testing, Prediction.
1.0
INTRODUCTION
lthough there are many definition of software quality, it is widely accepted that a software or project with many defects lacks good quality. Understanding the root causes of possible defects as well as identifying general software process areas that may need attention from the initialization of a project could save money, time, work, etc. The possibility of early detection of potential faults of software could help on planning, controlling and executing software development activities.
A cost effective method for analysis of defect is learning from previous mistakes to prevent current one. Today, there exist several data sets that could be mined in order to discover useful knowledge regarding defects [7], [14]. Using this knowledge one should ideally be able to: a) Identify potential fault-prone software, b) Estimate the specific number of faults, and c) Discover the possible causes of faults.
Several data mining methods have been proposed for defect analysis in the past [5], [9], [15] but few of them manage to deal successfully with all of the issues. Regression models estimates are difficult to interpret and also provide the exact number of faults which is too risky, especially in the beginning of a software project when very little data is available. On the other hand classification models that predict possible faults can be comprehensible, but not very helpful, because they give no clue or evidence about the actual number of faults.
These issues led us to the proposal of a different data mining approach, called Regression Strategy (RS) that benefits from the advantages and caters for the disadvantages of regression strategy approaches. RS involves the discretization of the expected variable into a finite number of intervals, the induction of a classification model for predicting such intervals and the transformation of the model's detection back into specific numerical estimates.
To our knowledge, RS has not been applied for software fault prediction in the past, despite the many benefits that it offers. It is a method that considers uncertainty, develops comprehensible results and it is an acceptable alternative to regression problems that need a logical explanation. Additionally the method performs all the tasks of defect prediction, estimation of a particular number, estimation of fault class with suitable suggestion for potential causes of faults. In order to evaluate RS in terms of its correctness, we conducted a comparative evaluation of various algorithms for the implementation of the RS framework with classical regression algorithms used in previous approaches and other state-of-the art regression algorithms from the field of Machine Learning. For the evaluation of all these approaches a data set has been used that works on a maintenance data from super market application [14]. It contains data about the size and defects of each application. The results coming from the application of RS methods show that regression accuracy of the models is competitive to those of regression models and in most cases RS outdates them.
The rest of this paper is discussed as follows. The next section presents an overview of the related work. In Section 3, We present the RS framework along with details concerning the implementation of this method for the issue of software defect prediction. The description of the dataset and the learning algorithms applied to the data sets are found in section 4. Section 5 presents the evaluation results along with the extracted software fault prediction models. Finally, in Section 6, we conclude the paper and present ideas for future work.
2.0
LITERATURE REVIEW
The earliest studies in fault deduction focused on establishing relationships between software complexity, usually measured in coding, and defects. Widely known metrics introduced during 1970s is Halstead’s theory [6] and McCabe’s cyclomatic complexity [13]. The usual drawback of complexity metrics is that they indicate software size as the only predictor of defects. Therefore in 1980s and afterwards research has tried to relate software complexity to sets of different metrics, deriving multivariate regression technique [12], [9], [15]. Regression technique on the other hand presented the disadvantage of giving results difficult to interpret that ignored causal effects. In the 1990s classification models were adopted to solve these issues. Clustering [28], logistic regression [4], [8] and Bayesian nets [5] are applied for the prediction of fault-prone software. Most of the studies estimate potential fault proneness of software components without providing particular number of faults.
In the same decade due to the huge number of research in this area, several studies compared different methods such as regression techniques and classification techniques but each time the most accurate method varied
according to the context of the study. Principal component analysis, discriminant analysis, logistic regression, logical classification models, layered neural networks, and holographic networks are applied in [12], while MARS regression method and classification methods such as rules, CART and Bayesian networks are compared in [15]. Fenton and O’Neil [5] provided a critical literature review and suggested a theoretical framework based on Bayesian networks that could solve the issues founded. They argued that complexity metrics should not be the only predictor of defects, they pointed out that statistical methodologies should also be considered on the quality of data and the method of evaluation and finally they stressed that it is important to identify the relationship between faults and failures.
VOLUME NO.3(2013),ISSUE NO.05(MAY) ISSN 2231-5756
INTERNATIONAL JOURNAL OF RESEARCH IN COMMERCE, IT & MANAGEMENT
As discussed in [5] clearly all of the issues described cannot be solved easily, however modeling the complexities of software development using new probabilistic method presents a positive way towards future. In this study we propose the use of Regression Strategy for modeling uncertainty in software defect prediction. Using this method we have attempted to solve several of this issues discussed in literature such as, interpretability of the results, use of size as the only predictor, combination of results with expert opinion.
3.0
REGRESSION STRATEGY
Supervised Machine Learning considers the issues of approximating a function that gives the value of a target variable y, based on the values of anumber of input variables x1, x2, …, xn. If y takes real values, then the learning task is called regression, while if y takes discrete values then it is called classification. Traditionally, Machine Learning research has focused on the classification work. It would therefore be very interesting to be able to solve regression problems taking advantage of the many machine learning algorithms and methods that exist for classification. It requires a mapping of regression problems into classification problems and back, which has been recently observed by some researchers.
The whole process of Regression Strategy (RS) comprises two critical stages: a) The discretization of the numeric target variable in order to study a classification model, and b) the reverse process of transforming the class output of the model into a numeric prediction.
Three methods for discretization are equal-interval binning, equal-frequency binning and K-means clustering. The first one divides the range of values of a numerical attribute into a predetermined number of equal intervals. The second one divides the range of values into a predetermined number of intervals that contain equal number of instances. The k-means clustering algorithm starts by randomly selecting k values as centers of the ranges. It then assigns all values to the closest of these centers and calculates the new centers as the mean of the values of these ranges. This process is repeated until the same values are assigned to each of the k ranges in two successive iterations.
After conducting the discretization process, any classification algorithm can be used for modeling the data. The next step is to make numeric predictions from the classification model that is produced. It predicts a number of classes which correspond to numerical intervals of the original target variable. There remains the problem of transforming this class to a specific number, in order to assess the regression error of the RS framework. A choice for this number should be a statistic of centrality that summarizes the values of the training instances within each interval.
4.0
IMPLEMENTATION OF REGRESSION STRATEGY
In this study in order to find the actual parameters of the discretization process of the RS framework, we decided to use a wrapper approach [11]. The wrapper approach evaluates the different configurations of an approach by performing cross validation and selects the configuration with the accuracy. Similar to that approach, we executed the discretization process using all three methods and experiment with the number of classes in the range 2 to 1+3.3log(n). The upper bound of the number of classes was proposed in however, this is just a statistical approach for the number of classes, that does not take into account any knowledge about the domain and tends to propose a rather huge number of classes. For this purpose, we used it as an upper bound in the wrapper approach. In total, our implementation evaluates 3*(1+3.3log(n)-2)=9.9log(n) different configurations of the discretization process using 10-fold cross-validation [10]. The 10-fold cross-validation process splits the data into 10-equal disjoint parts and uses 9 of these parts for training the RS framework and one for testing. This is done 10 times, each and every time using a different data for testing. The training data are used initially to discretize the defects (using one of the configurations) and then to train a classification algorithm. The learned model is then applied to the test data. For the transformation of the output of the classification model back to a numeric estimate we use the median of the values in each interval, as it is usually a more robust centrality measure than the mean. So, for each test instance we calculate the absolute difference of the number of defects in this instance with the median value of the predicted class interval. The average differences for all test instances is the Mean. Absolute Error performance metric for numeric prediction. The configuration with the lowest average Mean Absolute Error over all the 10 folds of the cross validation is selected as the configuration to use.
5.0
LEARNING ALGORITHMS & DATA SETS
I firstly describe here the data set that was used in this research. I then present the learning algorithms that were used for RS and ordinary regression on this data set.
5.1. LEARNING ALGORITHMS
We used the WEKA machine learning library as the source of algorithms for research. For the RS framework we used the following classification algorithms as implemented in WEKA with default parameters unless otherwise stated:
• IBk: the k nearest neighbor algorithm [1].
• JRip: the RIPPER rule learning algorithm [3].
• PART: the PART rule learning algorithm [15].
• J48: the C4.5 decision tree learning algorithm [8].
• SMO: the sequential minimal optimization algorithm for training a support vector classifier using RBF kernels [6]. We will further analyze PART, RIPPER and C4.5 algorithms as the results of these algorithms are presented in section 4.
C4.5 outputs a decision tree, while the other two (PART and RIPPER) output a set of classification rules. Each rule has a body, which has one or more conditions under which the rule will fire, and a head which consists of the predicted class of defects. We also present two quantitative measures of the rule's quality: a) support, which is the is the ratio between the number of records that satisfy the rule body and the total number of records in the database, and b) confidence, which is the ratio between the number of database records that satisfy both the rule body and head and the number of records that satisfy just the rule body. We must note here that RIPPER and PART belong to the divide and conquer family of rule learning algorithms. These algorithms learn one rule, remove the example that this rule covers and proceed with the next rule. Any remaining uncovered examples are handled by a default rule that fires without any conditions and predicts the most frequent class among the remaining examples. Therefore the support and confidence of each rule is reported based on the subset of the examples that remained for that rule. This also defines that the rules are presented in the order that they are discovered, and during the run time, they are considered in this order.
For ordinary regression we used the following algorithms as implemented in WEKA with standard parameters unless otherwise stated: Linear: A least median squared linear regression algorithm [9].
• MLP: an algorithm for training a multi-layer perception [2].
• Reg-IBk: the k nearest neighbor algorithm [1], using cross-validation to select the best k value.
• SMOreg: the sequential minimal optimization algorithm of [2] for support vector regression using RBF kernels.
• M5P: an algorithm for producing M5 model trees[7], [2]. This algorithm is used twice, first time for the production of a model tree and another time for the production of a regression tree.
• REPTree: a fast regression tree learner that uses information variance reduction and reduced-error pruning [6]. 5.2. PEKKA DATASET
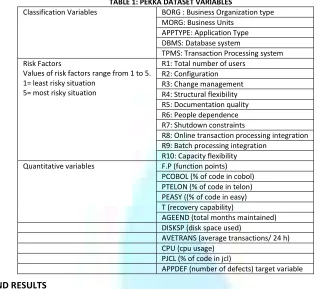
TABLE 1: PEKKA DATASET VARIABLES
Classification Variables BORG : Business Organization type
MORG: Business Units APPTYPE: Application Type DBMS: Database system
TPMS: Transaction Processing system Risk Factors
Values of risk factors range from 1 to 5. 1= least risky situation
5= most risky situation
R1: Total number of users R2: Configuration R3: Change management R4: Structural flexibility R5: Documentation quality R6: People dependence R7: Shutdown constraints
R8: Online transaction processing integration R9: Batch processing integration
R10: Capacity flexibility
Quantitative variables F.P (function points)
PCOBOL (% of code in cobol) PTELON (% of code in telon) PEASY ((% of code in easy) T (recovery capability)
AGEEND (total months maintained) DISKSP (disk space used)
AVETRANS (average transactions/ 24 h) CPU (cpu usage)
PJCL (% of code in jcl)
APPDEF (number of defects) target variable
6.0
OBSERVATION AND RESULTS
In this section we first present the evaluation results and then the classification models that were extracted from the data set will be presented and discussed. The performance of the approaches was measured by their average Mean Absolute Error (MAE) for the 10 folds of the cross-validation process. The MAE function is given below:
MAE = ∑ −
Where n is the number of instances in the test set, P is the actual defect number and E is the predicted one. In addition, for RS we calculated the average classification accuracy of the algorithms which produces the percentage of projects for which the correct defect class has been successfully estimated, the average number of defect classes and the percentage of times that each of the 3 discretization methods was used.
TABLE 2: MAE OF RS & REGRESSION TECHNIQUE Pekka Data Set
Regression Strategy RS SMO 6,69
RIPPER 7,15
PART 7,70
C4.5 8,53
IBk 7,88
Regression SMOreg 7,07
Linear 7,96
REPTree 7,72
M5P regression tree 7,71
M5P model tree 7,28
IBk 8,27
MLP 7,22
Table 2 shows the average Mean Absolute Error of all the approaches on the Pekka dataset. We firstly notice that RS actually manages to get better regression error than the standard regression approaches. Indeed within the top three performers we find two RS approaches (SMO, RIPPER) and only one regression approach (SMOreg). The best average performance is obtained with RS and the SMO algorithm, while the SMOreg algorithm for regression is the second best. Relatively good performance is also obtained by the symbolic algorithms (RIPPER, C4.5 and PART) that produce comprehensible models. Another thing that must be noted is the fact that RS achieves improved performance overall than regression approaches, even though it uses a rough estimation of the actual numbers. Table 3 shows the accuracy of the RS classification algorithms, the mean number of classes in the 10 folds of the cross-validation and the percentage of times that each of the three methods (M1:equal-width, M2: equal-frequency, M3:k-means) was used for discretizing the number of defects. We first notice that the most accurate algorithms are SMO and PART and this has certainly contributed to the corresponding low regression error of RS. However, RS with RIPPER managed to achieve low regression error even though the classification accuracy of RIPPER was relatively low. This shows that apart from the classification accuracy, the actual discretization of defects into intervals is also important for the regression error.
Initially, the RS and regression algorithms have been applied to the whole data set (67 projects). The results when considering the whole data set pointed out the project with ID 55, which presented 163 defects, as an outlier. Almost all classification methods created a fault class with that project as a single member while the rest of the projects were classified into another class. In order to create meaningful models whose results could be exploited the models were recreated omitting the project with ID =55.
TABLE 3: MEAN NUMBER, ACCURACY, AND PERCENTAGE OF DISCRETIZATION METHOD PEKKA
Acc Av. C M1 M2 M3
SMO 0,94 2,00 1,00 0,00 0,00
PART 0,72 4,40 0,60 0,10 0,30 IBk 0,69 2,40 0,40 0,50 0,10
C4.5 0,67 3,90 0,60 0,10 0,30
VOLUME NO.3(2013),ISSUE NO.05(MAY) ISSN 2231-5756
INTERNATIONAL JOURNAL OF RESEARCH IN COMMERCE, IT & MANAGEMENT
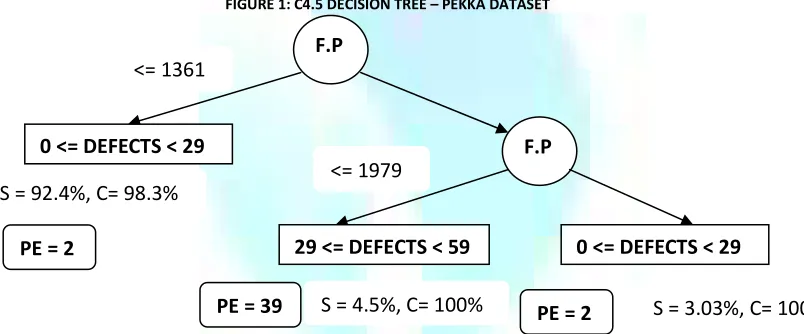
Table 4 presents the rule sets that were produced by RS with the RIPPER and PART algorithms came along with a point estimate in brackets, confidence and support values. In the results of the RIPPER approach function points and CPU usage are the independent predictors of faults. In the results of PART rules set the type of the organization and the unit in which the application is destined play important role in the estimation. The decision tree of Figure 1 has two splitting nodes. The number of function points is the splitting criterion for both nodes. For each suggested class the median number of the class is indicated as the most probable defect number of the class as a point estimate (PE) along with support and confidence values.
TABLE 4: RULE SETS BY RS WITH PART & JRIP ON PEKKA DATASET JRIP list of rules
Body Head (C) (S)
F.P <= 986 9.5 < D <= 59 (20) 87.5 2.12
cpu >=292 2.5 < D <= 9.5 (5) 60.0 5.15
F.P >=671 2.5< D <=9.5 (5) 80.0 7.58
0 <= D <= 0.5 (0) 39.5 65.15 PART list of rules
Body Head (C) (S)
F.P <= 939 and morg = CUSTOMER 0 <= D <= 8.43 (1) 92.31 19.7 F.P <= 939 and borg = RETAIL 0 <= D <= 8.43 (1) 85.71 21.2 morg = PAYMENT and r1=5 0 <= D <= 8.43 (1) 85.71 10.6 cpu <= 506 and r6=2 0 <= D <= 8.43 (1) 85.86 21.4
r5=1 0 <= D <= 8.43 (1) 63.26 5.48
morg= deposit 50.57 < D <= 59 (53) 100.0 3.03
Ageend <= 40 8.4 < D <= 16.86 (11) 66.67 4.55 16.86 < D <= 25.29 (20) 74.55 3.39
A project variable that appears often in the results of the three classification methods is Function Points. This is answerable, as function points is a metric indicative of the size of a software application, and as the size of a software project grows so does its complexity. Software complexity is widely accepted as the primary - cause of faults. An interesting rule is the one indicated by PART decision list that application that are destined for deposit units tend to appear a large number of faults. Probably this can be explained by the fact that the requirements for applications for these units are relatively demanding and strict as a single fault could cause loss of money. Even small defects that otherwise would be ignored in such applications are recorded and fixed. Also the applications that have low CPU usage seem to be less fault proof. Another rule that can be confirmed intuitively is the one that supports that application with equal or less than 60 months of maintenance tend to present many defects. A surprise to us was that only r1, r5 and r6 (number of users, documentation quality and people dependence) appeared from the risk factors.
FIGURE 1: C4.5 DECISION TREE – PEKKA DATASET
One could argue that the predicted defect classes of RS are large and therefore may contain fuzzy information. This argument can be confronted with the fact that RS even when two few fault classes are considered succeeds comparable and even lower regression error from traditional regression models when considering the median value of a class as a point estimate. There are though several advantages by that type of prediction:
• It can provide a better understanding of software defects by automatically dividing their numerical values into significant intervals.
• Apart from a numerical estimate of defects, it also outputs an associated interval of values, within which this estimate lies, with a certain confidence. This way it reduces the level of uncertainty associated with just a point estimate, and provides more knowledge concerning the defects to the end user.
• It allows the production of comprehensible models of software defects that are easily interpretable by project managers and other non-experts in data mining technology.
7.0 CONCLUSION AND FUTURE WORK
In this paper the framework of Regression Strategy (RS) was applied to the problem of defect prediction. Our motivation was to exploit the advantages of classification algorithms in order to solve the main drawbacks of regression algorithms, such as the incomprehensibility of the produced models and their inability to provide a good point estimate of faults. RS provides a complete framework for defect prediction producing as an output a fault class into which the actual fault number may fall in, along with a particular most probable fault number within this class. The representation of the fault knowledge can be in the form of rules and decision trees which are among the most expressive and human readable representations for learned hypotheses.
In general RS as a data mining method offers a convenient way to solve problems that are not explained purely logically but rather probabilistically. Software defect estimation is one of these problems: we are not sure of the factors that affect directly the existence of faults and we expect a support from statistical methods to point out the underlying relationships that appear in fault data. Some of the results of the application of RS technique were expected and confirmed by intuition like the influence of a software application size on the existence of faults. The success of the method is that it provides a framework for discovering potential causes of faults that are not profound like the one that implies that applications for deposit organizations are fault-prone. In addition, we must stress the very good results of RS in terms of regression error. Despite the fact that RS outputs the median of an entire interval as its point estimate of faults, it manages to outperform most of the regression approaches in predictive accuracy.
In the future we intend to apply the proposed methodology to other software data sets [7] involving other software quality attributes in addition to defects. We will also experiment with methods that combine different classification algorithms such as Stacking [7] and Effective Voting [3] for the purpose of increasing the predictive performance of RS.
F.P
F.P
0 <= DEFECTS < 29
29 <= DEFECTS < 59
0 <= DEFECTS < 29
PE = 2
PE = 39
PE = 2
S = 92.4%, C= 98.3%
<= 1979
<= 1361
8.0 REFERENCES
1. Aha, D., Kibler, D.W., and Albert, M.K., “Instance-based learning algorithms”, Machine Learning, Vol. 6, 1991, pp. 37- 66. 2. Bishop, C.M., “Neural Networks for Pattern Recognition”, Oxford University Press, 1995.
3. Cohen, W.W., “Fast Effective Rule Induction”, In Proceedings of the 12th International Conference on Machine Learning, Morgan Kaufmann, 1995, pp. 115– 123.
4. Emam, K.E, Melo, W., Machado, J.C., “The Prediction of Faulty Classes Using Object-Oriented Design Metrics”, Journal of Systems and Software, Vol. 56, 2001, pp. 63-75.
5. Fenton, N., Neil, M., “A Critique of Software Defect Prediction Models”, IEEE Transactions on Software Engineering, Vol 25(5), 1999, pp.675-689. 6. Halstead, M.H, “Elements of Software Science”, Elsevier, North-Holland,1975.
7. International Software Benchmarking Standards Group, http://www.isbsg.org.
8. Kamiya, T., Kusumoto, S., Inoue, K., “Prediction of Faultproneness at Early Phase in Object-Oriented Development”, In Proceedings of the 2nd International Symposium on Object - Oriented Real-Time Distributed Computing, IEEE Computer Society, 1999, pp. 253-258.
9. Khoshgoftaar, T.M., Seliya, M., “Tree-Based Software Quality Estimation Models For Fault Prediction”, In Proceedings of the 8th IEEE International Conference on Software Metrics, 2002, pp. 203-215
10. Kohavi, R, “Wrappers for Performance Enhancement and Oblivious Decision Graphs”. PhD Thesis. Department of Computer Science, 1995, Stanford University.
11. Kohavi, R., “A Study of Cross-Validation and Bootstrap for Accuracy Estimation and Model Selection”`, In Proceedings of the 14th International Joint Conference on Artificial Intelligence, 1995, pp. 1137-1145
12. Lanubile, F., Lonigro, A., Visaggio, G., “Comparing models for identifying fault-prone software components”, In Proceedings of the 7th International Conference on Software Engineering and Knowledge Engineering, 1995, pp.312-319.
13. Maxwell, K., “Applied Statistics for Software Managers”, Prentice-Hall, 2002.
14. McCabe, T.J, “A Complexity Measure,” IEEE Transactions on Software Engineering, Vol. 2 (4), 1976, pp. 308-320.
VOLUME NO.3(2013),ISSUE NO.05(MAY) ISSN 2231-5756
INTERNATIONAL JOURNAL OF RESEARCH IN COMMERCE, IT & MANAGEMENT
REQUEST FOR FEEDBACK
Dear Readers
At the very outset, International Journal of Research in Commerce, IT and Management (IJRCM)
acknowledges & appreciates your efforts in showing interest in our present issue under your kind perusal.
I would like to request you to supply your critical comments and suggestions about the material published
in this issue as well as on the journal as a whole, on our E-mail i.e.
for further
improvements in the interest of research.
If you have any queries please feel free to contact us on our E-mail
.
I am sure that your feedback and deliberations would make future issues better – a result of our joint
effort.
Looking forward an appropriate consideration.
With sincere regards
Thanking you profoundly
Academically yours
Sd/-