A Monthly Double-Blind Peer Reviewed (Refereed/Juried) Open Access International e-Journal - Included in the International Serial Directories
Indexed & Listed at:
VOLUME NO.3(2013),ISSUE NO.02(FEBRUARY) ISSN 2231-5756
INTERNATIONAL JOURNAL OF RESEARCH IN COMMERCE, IT & MANAGEMENT
CONTENTS
CONTENTS
CONTENTS
CONTENTS
Sr.No.
TITLE & NAME OF THE AUTHOR (S)
Page No. 1. IDENTIFICATION OF KEY MOTIVATIONAL FACTORS; AN IMPLEMENTATION OF MASLOW'S HIERARCHY OF NEEDS IN PAKISTANI ORGANIZATIONS
MUHAMMAD TAHIR AKBAR & DR. MUHAMMAD RAMZAN
1 2. PROFITABILITY OF POTATO BASED CROPPING PATTERNS COMPARED TO RICE BASED CROPPING PATTERNS IN MYMENSINGH REGION
ROMAZA KHANUM, MD.SHARIFUL ISLAM & D. AFROZA
5 3. THE IMPACT OF ACCOUNTING INFORMATION SYSTEMS IN THE QUALITY OF FINANCIAL INFORMATION IN THE PRIVATE JORDANIAN UNIVERSITIES:
AN EMPIRICAL STUDY
DR. ATEF A. S. AL-BAWAB
11
4. THE ROLE OF SNNPRS MARKETING AND COOPERATIVE BUREAU IN THE EXPANSION AND DEVELOPMENT OF COOPERATIVES IN SNNPR REGION, ETHIOPIA, AFRICA
DR. S. BALAMURUGAN
18
5. STUDY ON THE HEALTH LIFESTYLE OF SENIOR LEARNERS IN TAIWAN
JUI-YING HUNG & CHIEN-HUI YANG
27 6. EFFECT OF INFORMATION TECHNOLOGY ON CORPORATE FINANCIAL REPORTING IN NIGERIA
AKINYOMI OLADELE JOHN &DR. ENAHORO JOHN A.
31 7. DIAGNOSTIC STUDY ON INTERACTIVE ADS AND ITS RESPONSE TOWARDS THE FM RADIO
EMON KALYAN CHOWDHURY & TAHMINA REZA
36 8. ACCOMMODATION OF ETHNIC QUEST FOR SELF-GOVERNANCE UNDER ETHNIC FEDERAL SYSTEM IN ETHIOPIA: THE EXPERIENCE OF SOUTHERN
REGIONAL STATE
TEMESGEN THOMAS HALABO
42
9. UNIVERSITY PERFORMANCE MEASUREMENT USING THE BALANCED SCORECARD METHOD – SPECIAL FOCUS TO THE LEARNING AND GROWTH PERSPECTIVE
W.M.R.B.WEERASOORIYA
46
10. INDEPENDENT DIRECTORS IN LISTED INDIAN PUBLIC SECTOR ENTERPRISES: AN ANALYTICAL STUDY
MOHINDER SINGH TONK
51 11. RELATIONSHIP BETWEEN EMOTIONAL & SOCIAL COMPETENCES AND TRANSFORMATIONAL LEADERSHIP STYLE
BADRI BAJAJ & DR. Y. MEDURY
56 12. ICT DEVELOPMENTS IN HIGHER EDUCATION IN INDIA: THE ROAD MAP AHEAD
DR. M. K. SINGH & DR. SONAL SHARMA
60 13. CONSUMER SENSITIVITY TOWARDS PRICING OF COSMETIC PRODUCTS: AN EMPIRICAL STUDY
DR. D. S. CHAUBEY, LOKENDRA YADAV & HARISH CHANDRA BHATT
67 14. CONVENIENCE YIELD: EMPIRICAL EVIDENCES FROM INDIAN CHILLI MARKET
IRFAN UL HAQ & DR. K CHANDERASEKHARA RAO
74 15. CELLULAR PHONES: THE HUB OF MODERN COMMUNICATION - AN ANALYTICAL STUDY
DR. A. RAMA & S. MATHUMITHA
78 16. WOMAN LEADERSHIP IN AXIS BANK: A COMPARISON OF WOMAN AND MAN LEADER USING CAMEL MODEL
ARTI CHANDANI & DR. MITA MEHTA
83 17. A STUDY OF ANTS TEAMBUILDING TECHNIQUES AND ITS APPLICATION IN ORGANIZATIONAL WORK TEAMS
AMAR DATT & DR. D. GOPALAKRISHNA
90 18. BASEL II AND INDIAN CREDIT RATING AGENCIES – IMPACT & IMPLICATIONS
RAVI KANT & DR. S. C. JAIN
95 19. A STUDY ON THE CONSUMPTION PATTERN OF BAKERY PRODUCTS IN SOUTHERN REGION OF TAMIL NADU
DR. A. MARTIN DAVID, R. KALYAN KUMAR & G.DHARAKESWARI
101 20. e-COMMERCE: AN INVISIBLE GIANT COMPETITOR IN RETAILING IN EMERGING COUNTRIES
NISHU AYEDEE.
107 21. THE GREAT MATHEMATICIAN SRINIVASA RAMANUJAN
G. VIJAYALAKSHMI
111 22. ISSUES RELATING TRANSITION IPv4 TO IPv6 IN INDIA
ANANDAKUMAR.H
117 23. QUALITY OF WORK-LIFE: A TOOL TO ENHANCE CONFIDENCE AMONG EMPLOYEES
JYOTI BAHL
124 24. GLOBAL RECESSION: IMPACT, CHALLENGES AND OPPORTUNITIES
SHAIKH FARHAT FATMA
128 25. IMPACT OF CELL PHONE ON LIFESTYLE OF YOUTH: A SURVEY REPORT
MALIK GHUFRAN RUMI, PALLAVI TOTLANI & VINSHI GUPTA
133 26. EFFECTIVENESS OF TRAINING IN AUTO COMPONENT INDUSTRY – AN EMPIRICAL STUDY
R.SETHUMADHAVAN
143 27. THE IMPACT ON MARKETING BY THE ADVENT OF WEB 2.0 INTERNET TOOLS
JAYAKUMAR MAHADEVAN
146 28. MARKET INFLUENCE ON THE TECHNOLOGY IN THE ENERGY SECTOR - A STUDY OF INDIAN SCENARIO
MANOHAR SALIMATH C
150 29. SPOT ELECTRICITY PRICE MODELLING AND FORECASTING
G P GIRISH
154 30. AN ANALYTICAL STUDY OF RURAL MARKETING IN INDIA - OPPORTUNITIES AND POSSIBILITY
BASAVARAJAPPA M T
158
CHIEF PATRON
CHIEF PATRON
CHIEF PATRON
CHIEF PATRON
PROF. K. K. AGGARWAL
Chancellor, Lingaya’s University, Delhi
Founder Vice-Chancellor, Guru Gobind Singh Indraprastha University, Delhi
Ex. Pro Vice-Chancellor, Guru Jambheshwar University, Hisar
FOUNDER
FOUNDER
FOUNDER
FOUNDER PATRON
PATRON
PATRON
PATRON
LATE SH. RAM BHAJAN AGGARWAL
Former State Minister for Home & Tourism, Government of Haryana
Former Vice-President, Dadri Education Society, Charkhi Dadri
Former President, Chinar Syntex Ltd. (Textile Mills), Bhiwani
CO
CO
CO
CO----ORDINATOR
ORDINATOR
ORDINATOR
ORDINATOR
AMITA
Faculty, Government M. S., Mohali
ADVISORS
ADVISORS
ADVISORS
ADVISORS
DR. PRIYA RANJAN TRIVEDI
Chancellor, The Global Open University, Nagaland
PROF. M. S. SENAM RAJU
Director A. C. D., School of Management Studies, I.G.N.O.U., New Delhi
PROF. M. N. SHARMA
Chairman, M.B.A., Haryana College of Technology & Management, Kaithal
PROF. S. L. MAHANDRU
Principal (Retd.), Maharaja Agrasen College, Jagadhri
EDITOR
EDITOR
EDITOR
EDITOR
PROF. R. K. SHARMA
Professor, Bharti Vidyapeeth University Institute of Management & Research, New Delhi
CO
CO
CO
CO----EDITOR
EDITOR
EDITOR
EDITOR
DR. BHAVET
Faculty, M. M. Institute of Management, Maharishi Markandeshwar University, Mullana, Ambala, Haryana
EDITORIAL
EDITORIAL
EDITORIAL
EDITORIAL ADVISORY BOARD
ADVISORY BOARD
ADVISORY BOARD
ADVISORY BOARD
DR. RAJESH MODI
Faculty, Yanbu Industrial College, Kingdom of Saudi Arabia
PROF. SANJIV MITTAL
University School of Management Studies, Guru Gobind Singh I. P. University, Delhi
PROF. ANIL K. SAINI
Chairperson (CRC), Guru Gobind Singh I. P. University, Delhi
DR. SAMBHAVNA
VOLUME NO.3(2013),ISSUE NO.02(FEBRUARY) ISSN 2231-5756
INTERNATIONAL JOURNAL OF RESEARCH IN COMMERCE, IT & MANAGEMENT
DR. MOHENDER KUMAR GUPTA
Associate Professor, P. J. L. N. Government College, Faridabad
DR. SHIVAKUMAR DEENE
Asst. Professor, Dept. of Commerce, School of Business Studies, Central University of Karnataka, Gulbarga
ASSOCIATE EDITORS
ASSOCIATE EDITORS
ASSOCIATE EDITORS
ASSOCIATE EDITORS
PROF. NAWAB ALI KHAN
Department of Commerce, Aligarh Muslim University, Aligarh, U.P.
PROF. ABHAY BANSAL
Head, Department of Information Technology, Amity School of Engineering & Technology, Amity
University, Noida
PROF. A. SURYANARAYANA
Department of Business Management, Osmania University, Hyderabad
DR. SAMBHAV GARG
Faculty, M. M. Institute of Management, Maharishi Markandeshwar University, Mullana, Ambala, Haryana
PROF. V. SELVAM
SSL, VIT University, Vellore
DR. PARDEEP AHLAWAT
Associate Professor, Institute of Management Studies & Research, Maharshi Dayanand University, Rohtak
DR. S. TABASSUM SULTANA
Associate Professor, Department of Business Management, Matrusri Institute of P.G. Studies, Hyderabad
SURJEET SINGH
Asst. Professor, Department of Computer Science, G. M. N. (P.G.) College, Ambala Cantt.
TECHNICAL ADVISOR
TECHNICAL ADVISOR
TECHNICAL ADVISOR
TECHNICAL ADVISOR
AMITA
Faculty, Government M. S., Mohali
FINANCIAL ADVISORS
FINANCIAL ADVISORS
FINANCIAL ADVISORS
FINANCIAL ADVISORS
DICKIN GOYAL
Advocate & Tax Adviser, Panchkula
NEENA
Investment Consultant, Chambaghat, Solan, Himachal Pradesh
LEGAL ADVISORS
LEGAL ADVISORS
LEGAL ADVISORS
LEGAL ADVISORS
JITENDER S. CHAHAL
Advocate, Punjab & Haryana High Court, Chandigarh U.T.
CHANDER BHUSHAN SHARMA
Advocate & Consultant, District Courts, Yamunanagar at Jagadhri
SUPERINTENDENT
SUPERINTENDENT
SUPERINTENDENT
SUPERINTENDENT
SURENDER KUMAR POONIA
CALL FOR MANUSCRIPTS
CALL FOR MANUSCRIPTS
CALL FOR MANUSCRIPTS
CALL FOR MANUSCRIPTS
We invite unpublished novel, original, empirical and high quality research work pertaining to recent developments & practices in the area of Computer, Business, Finance, Marketing, Human Resource Management, General Management, Banking, Insurance, Corporate Governance and emerging paradigms in allied subjects like Accounting Education; Accounting Information Systems; Accounting Theory & Practice; Auditing; Behavioral Accounting; Behavioral Economics; Corporate Finance; Cost Accounting; Econometrics; Economic Development; Economic History; Financial Institutions & Markets; Financial Services; Fiscal Policy; Government & Non Profit Accounting; Industrial Organization; International Economics & Trade; International Finance; Macro Economics; Micro Economics; Monetary Policy; Portfolio & Security Analysis; Public Policy Economics; Real Estate; Regional Economics; Tax Accounting; Advertising & Promotion Management; Business Education; Management Information Systems (MIS); Business Law, Public Responsibility & Ethics; Communication; Direct Marketing; E-Commerce; Global Business; Health Care Administration; Labor Relations & Human Resource Management; Marketing Research; Marketing Theory & Applications; Non-Profit Organizations; Office Administration/Management; Operations Research/Statistics; Organizational Behavior & Theory; Organizational Development; Production/Operations; Public Administration; Purchasing/Materials Management; Retailing; Sales/Selling; Services; Small Business Entrepreneurship; Strategic Management Policy; Technology/Innovation; Tourism, Hospitality & Leisure; Transportation/Physical Distribution; Algorithms; Artificial Intelligence; Compilers & Translation; Computer Aided Design (CAD); Computer Aided Manufacturing; Computer Graphics; Computer Organization & Architecture; Database Structures & Systems; Digital Logic; Discrete Structures; Internet; Management Information Systems; Modeling & Simulation; Multimedia; Neural Systems/Neural Networks; Numerical Analysis/Scientific Computing; Object Oriented Programming; Operating Systems; Programming Languages; Robotics; Symbolic & Formal Logic and Web Design. The above mentioned tracks are only indicative, and not exhaustive.
Anybody can submit the soft copy of his/her manuscript anytime in M.S. Word format after preparing the same as per our submission guidelines duly available on our website under the heading guidelines for submission, at the email address: [email protected].
GUIDELINES FOR
GUIDELINES FOR
GUIDELINES FOR
GUIDELINES FOR SUBMISSION OF MANUSCRIPT
SUBMISSION OF MANUSCRIPT
SUBMISSION OF MANUSCRIPT
SUBMISSION OF MANUSCRIPT
1. COVERING LETTER FOR SUBMISSION:
DATED: _____________
THE EDITOR
IJRCM
Subject: SUBMISSION OF MANUSCRIPT IN THE AREA OF .
(e.g. Finance/Marketing/HRM/General Management/Economics/Psychology/Law/Computer/IT/Engineering/Mathematics/other, please specify)
DEAR SIR/MADAM
Please find my submission of manuscript entitled ‘___________________________________________’ for possible publication in your journals.
I hereby affirm that the contents of this manuscript are original. Furthermore, it has neither been published elsewhere in any language fully or partly, nor is it under review for publication elsewhere.
I affirm that all the author (s) have seen and agreed to the submitted version of the manuscript and their inclusion of name (s) as co-author (s).
Also, if my/our manuscript is accepted, I/We agree to comply with the formalities as given on the website of the journal & you are free to publish our contribution in any of your journals.
NAME OF CORRESPONDING AUTHOR: Designation:
Affiliation with full address, contact numbers & Pin Code: Residential address with Pin Code:
Mobile Number (s): Landline Number (s): E-mail Address: Alternate E-mail Address:
NOTES:
a) The whole manuscript is required to be in ONE MS WORD FILE only (pdf. version is liable to be rejected without any consideration), which will start from the covering letter, inside the manuscript.
b) The sender is required to mention the following in the SUBJECT COLUMN of the mail:
New Manuscript for Review in the area of (Finance/Marketing/HRM/General Management/Economics/Psychology/Law/Computer/IT/ Engineering/Mathematics/other, please specify)
c) There is no need to give any text in the body of mail, except the cases where the author wishes to give any specific message w.r.t. to the manuscript. d) The total size of the file containing the manuscript is required to be below 500 KB.
e) Abstract alone will not be considered for review, and the author is required to submit the complete manuscript in the first instance.
f) The journal gives acknowledgement w.r.t. the receipt of every email and in case of non-receipt of acknowledgment from the journal, w.r.t. the submission of manuscript, within two days of submission, the corresponding author is required to demand for the same by sending separate mail to the journal.
2. MANUSCRIPT TITLE: The title of the paper should be in a 12 point Calibri Font. It should be bold typed, centered and fully capitalised.
3. AUTHOR NAME (S) & AFFILIATIONS: The author (s) full name, designation, affiliation (s), address, mobile/landline numbers, and email/alternate email address should be in italic & 11-point Calibri Font. It must be centered underneath the title.
VOLUME NO.3(2013),ISSUE NO.02(FEBRUARY) ISSN 2231-5756
INTERNATIONAL JOURNAL OF RESEARCH IN COMMERCE, IT & MANAGEMENT
5. KEYWORDS: Abstract must be followed by a list of keywords, subject to the maximum of five. These should be arranged in alphabetic order separated bycommas and full stops at the end.
6. MANUSCRIPT: Manuscript must be in BRITISH ENGLISH prepared on a standard A4 size PORTRAIT SETTING PAPER. It must be prepared on a single space and single column with 1” margin set for top, bottom, left and right. It should be typed in 8 point Calibri Font with page numbers at the bottom and centre of every page. It should be free from grammatical, spelling and punctuation errors and must be thoroughly edited.
7. HEADINGS: All the headings should be in a 10 point Calibri Font. These must be bold-faced, aligned left and fully capitalised. Leave a blank line before each heading.
8. SUB-HEADINGS: All the sub-headings should be in a 8 point Calibri Font. These must be bold-faced, aligned left and fully capitalised.
9. MAIN TEXT: The main text should follow the following sequence:
INTRODUCTION
REVIEW OF LITERATURE
NEED/IMPORTANCE OF THE STUDY
STATEMENT OF THE PROBLEM
OBJECTIVES
HYPOTHESES
RESEARCH METHODOLOGY
RESULTS & DISCUSSION
FINDINGS
RECOMMENDATIONS/SUGGESTIONS
CONCLUSIONS
SCOPE FOR FURTHER RESEARCH
ACKNOWLEDGMENTS
REFERENCES
APPENDIX/ANNEXURE
It should be in a 8 point Calibri Font, single spaced and justified. The manuscript should preferably not exceed 5000 WORDS.
10. FIGURES & TABLES: These should be simple, crystal clear, centered, separately numbered & self explained, and titles must be above the table/figure. Sources of data should be mentioned below the table/figure. It should be ensured that the tables/figures are referred to from the main text.
11. EQUATIONS: These should be consecutively numbered in parentheses, horizontally centered with equation number placed at the right.
12. REFERENCES: The list of all references should be alphabetically arranged. The author (s) should mention only the actually utilised references in the preparation of manuscript and they are supposed to follow Harvard Style of Referencing. The author (s) are supposed to follow the references as per the following:
•
All works cited in the text (including sources for tables and figures) should be listed alphabetically.•
Use (ed.) for one editor, and (ed.s) for multiple editors.•
When listing two or more works by one author, use --- (20xx), such as after Kohl (1997), use --- (2001), etc, in chronologically ascending order.•
Indicate (opening and closing) page numbers for articles in journals and for chapters in books.•
The title of books and journals should be in italics. Double quotation marks are used for titles of journal articles, book chapters, dissertations, reports, working papers, unpublished material, etc.•
For titles in a language other than English, provide an English translation in parentheses.•
The location of endnotes within the text should be indicated by superscript numbers.PLEASE USE THE FOLLOWING FOR STYLE AND PUNCTUATION IN REFERENCES: BOOKS
•
Bowersox, Donald J., Closs, David J., (1996), "Logistical Management." Tata McGraw, Hill, New Delhi.•
Hunker, H.L. and A.J. Wright (1963), "Factors of Industrial Location in Ohio" Ohio State University, Nigeria.CONTRIBUTIONS TO BOOKS
•
Sharma T., Kwatra, G. (2008) Effectiveness of Social Advertising: A Study of Selected Campaigns, Corporate Social Responsibility, Edited by David Crowther & Nicholas Capaldi, Ashgate Research Companion to Corporate Social Responsibility, Chapter 15, pp 287-303.JOURNAL AND OTHER ARTICLES
•
Schemenner, R.W., Huber, J.C. and Cook, R.L. (1987), "Geographic Differences and the Location of New Manufacturing Facilities," Journal of Urban Economics, Vol. 21, No. 1, pp. 83-104.CONFERENCE PAPERS
•
Garg, Sambhav (2011): "Business Ethics" Paper presented at the Annual International Conference for the All India Management Association, New Delhi, India, 19–22 June.UNPUBLISHED DISSERTATIONS AND THESES
•
Kumar S. (2011): "Customer Value: A Comparative Study of Rural and Urban Customers," Thesis, Kurukshetra University, Kurukshetra.ONLINE RESOURCES
•
Always indicate the date that the source was accessed, as online resources are frequently updated or removed.WEBSITES
PROFITABILITY OF POTATO BASED CROPPING PATTERNS COMPARED TO RICE BASED CROPPING
PATTERNS IN MYMENSINGH REGION
ROMAZA KHANUM
ASST. PROFESSOR
DEPARTMENT OF AGRICULTURAL ECONOMICS & POLICY
SYLHET AGRICULTURAL UNIVERSITY
SYLHET
MD.SHARIFUL ISLAM
PUBLICATION & LIAISON OFFICER
SOIL RESOURCE DEVELOPMENT INSTITUTE
DHAKA
D. AFROZA
SR. TEACHER
DIN K. G. AND JUNIOR HIGH SCHOOL
DHAKA
ABSTRACT
The study was carried out to evaluate the performance of different cropping patterns for identification of the most profitable cropping pattern during April to May; 2010.The area selected for the study covered four villages. Two villages from Shakhipur upazila of Tangail district and two villages from Bhaluka upazila of Mymensingh district were purposively selected. Sixty (60) farmers were selected randomly for this study. There were four major cropping patterns selected in the study area, namely, Jute-Aman rice-Wheat, Aus rice-Potato-Fallow, Jute-Potato-Fallow and Aus rice-Aman rice-Wheat. It was found that per hectare total human labor used in cultivation of aforesaid patterns were 215, 291, 254 and 253 respectively. Farmers responded to have applied the dose of 469.34, 425.26, 388.21 and 506.39 kg Urea, 318.76, 283.51, 214.83 and 387.44 kg TSP, and 292.32, 351.16, 316.58 and 326.90 kg MP per hectare for the selected patterns, respectively. In terms of economic viability, the Aus rice-Potato-Fallow pattern appeared to have the high potential as replacement for the farmers’ other existing cropping patterns having the highest net return of Tk. 57143.82 per hectare. Based on findings Aus rice-Potato-Fallow pattern might be recommended to the farmers are the economically pattern.
KEYWORDS
Profitability, Economic Viability, Cropping Pattern, Net Return, Competitive Crops.
INTRODUCTION
angladesh is a densely populated agrarian country where agriculture contributes 23.50 percent to the Gross Domestic Product. The total cropped area is estimated to be 13.742 million hectares with an average cropping intensity of about 175.97 percent (BBS, 2008). 8.44 million hectares are cultivable; 2.599 million hectares are utilized for forest of the total cropped area. Homesteads, rivers, tidal creeks, lakes, ponds, and roads cover the rest. Besides, augmentation of new roads and highways, dwelling house, industrialization and land fragmentation, etc. is causing the cropland reduced day by day. So, a little scope is left to increase agricultural output by putting new land under cultivation. Adopting improved cropping patterns, improved management and cultural practices can attain increase in crop output. Rice, the staple food of the people of Bangladesh, occupies about 72.24 percent of the total cropped area and remaining 27.76 percent of total cropped area (i.e. 3.58 percent Jute, 2.11 percent Wheat and 2.23 percent Potato) is devoted to other non-rice crops (BBS, 2008).
Potato (Solanum tuberosum) is the third largest food crop in Bangladesh next to rice and wheat. It is the leading vegetable crop in the world and at present people of at least 40 countries eats potato as their also staple food (Islam, 1987 and Huq et al., 2007). Potato production constitutes 23 percent of total world production of potato, rice and wheat (FAO, 1987 and Roy, 1993). It is very important crop due to its higher yield, diversified use, low risk involvement, excellent potentiality to grow in the soil and agro-climatic conditions of Bangladesh. Expansion of potato hectarage depends on its economic viability compared to its competitive crops. Most of the farmers’ cropping patterns need modification, in particular, in terms of improved varieties, optimum planting schedules, input use and management of individual crops in the patterns. There are some economic studies on cost and returns of potato and some other crops, conducted individually. But little information is available on economic aspects of profitability of alternative cropping patterns. For this reason the present study is an attempt to the relativeprofitability of potato based cropping patterns compared to rice based cropping patterns in Mymensingh region.
OBJECTIVES OF THE STUDY
The specific objectives of the study are: i) to identify different cropping patterns practiced by the farmers; ii) to find out the extent of land resource and other inputs utilized for different patterns according to cropping; iii) to evaluate the performance of different cropping patterns for identification of the most profitable cropping pattern.
MATERIALS AND METHODS
The area selected for the study covered four villages. Two villages from Shakhipur upazila of Tangail district, namely Mucharia Pathar and Gajaria and two villages from Bhaluka upazila of Mymensingh district, namely, Batajore and Gilachala were purposively selected. 60(Sixty) farmers were selected randomly for this study. Before finalizing the questionnaire, it was pre-tested. After pre-testing, the schedule was changed, rearranged, improved and modified in the light of the practical experience gained from the pre-testing. The schedule was then finalized and questions were listed in logical sequence so that the farmers could answer easily. After preparing final schedule primary data were collected from the selected farmers by the author himself. Survey method was used to collect the data. The collected data were coded, tabulated and analyzed for achieving the ultimate objectives of the study. Mainly tabular method using average, percentages were followed to find out the various objectives of the study.
VOLUME NO.3(2013),ISSUE NO.02(FEBRUARY) ISSN 2231-5756
INTERNATIONAL JOURNAL OF RESEARCH IN COMMERCE, IT & MANAGEMENT
RESULTS AND DISCUSSION
A. SOCIO-ECONOMIC CHARACTERISTICS OF THE SAMPLE FARMERS
Family size and composition of the Sample Farmers
In this study, a family has been considered as one which has a group of persons living together and taking their meals jointly from the same kitchen under the administration of the head of the family. The permanent hired labor was not included as a member of the family.
Table 1 show that the average family size of the selected beneficiaries stood at 4.8 members. The estimated family size was lower than the national average of 4.9 (BBS, 2010). The study reveals that the highest number of members (60.62 percent) belonged to the working age group, i.e. above 18 to 60 years, while 23.60 percent of the family members aged above 6 to 18 years. In the case of beneficiaries 50.69 percent members were male and 49.31 percent members were female.
TABLE 1: FAMILY COMPOSITION OF THE BENEFICIARIES ACCORDING TO AGE AND SEX
Type of sex Age
Up to 6 years Above 6 to 18 years Above 18 to 60 years Above 60 years Total Average family size
Male 4.86 10.75 31.25 3.82 50.69 4.90
Female 4.17 12.85 29.17 3.13 49.31 4.75
All 9.03 23.60 60.62 6.95 100 4.80
Source: Field survey, 2010
Farm size of the sample farmers
Thefarm size of a farmer was measured by using the following formula (Yang, 1965): Farm size = cultivated land + rented in + mortgaged in – (rented out + mortgaged out) + homestead. Based on farm size, in this study, farmers were classified into three categories ranging from 0.01 to 1.00, 1.01 to 3.00 and above 3.00 hectare. It was found that 14, 44 and 3 in percentage 23.34, 73.33 and 3.33, respondent farmers were belonged to the farm size 0.01 to 1.00, 1.01 to 3.00 and above 3.00 hectare (Table 2).
TABLE 2: FARM SIZE OF THE SAMPLE FARMERS
Farm size (hectare) Number of respondent farmers Percentage of respondent farmers 0.01 to1.00 14 23.34
1.01 to 3.00 44 73.33 Above 3.00 2 3.33
Source: Field survey, 2010
B. MAJOR CROPPING PATTERNS AND AREA COVERAGE
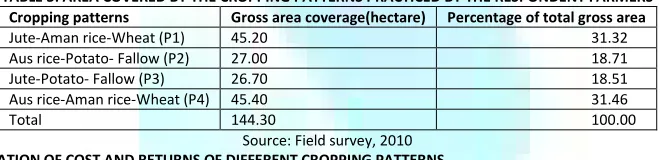
There were four major cropping patterns identified in the study area namely Jute- Aman rice-Wheat, Aus rice-Potato-Fallow, Jute-Potato-Fallow, Aus rice-Aman rice-Wheat having an area of 45.20, 27.00, 26.70 and 45.40 ha, capturing 31.32, 18.71, 18.51 and 31.46 percent of the total area (Table 3). The above mentioned patterns will be abbreviated to P1, P2, P3 and P4 respectively, in the succeeding chapter of this report.
TABLE 3: AREA COVERED BY THE CROPPING PATTERNS PRACTICED BY THE RESPONDENT FARMERS Cropping patterns Gross area coverage(hectare) Percentage of total gross area
Jute-Aman rice-Wheat (P1) 45.20 31.32
Aus rice-Potato- Fallow (P2) 27.00 18.71
Jute-Potato- Fallow (P3) 26.70 18.51
Aus rice-Aman rice-Wheat (P4) 45.40 31.46
Total 144.30 100.00
Source: Field survey, 2010
C. PROCEDURE FOR COMPUTATION OF COST AND RETURNS OF DIFFERENT CROPPING PATTERNS
In this section, methods of costing of various items used in producing different crops have been discussed in order to determine relative profitability of different cropping patterns. In calculating cost, both full cost and cash cost were considered. The cost items classified in calculating the total cost were as follows: cost of human labor, cost of animal labor, cost of seed/ seedling, cost of manure’s, cost of chemical fertilizer, cost of insecticides, cost of irrigation, cost of tools and equipment, interest on operating capital and land rent.
Cost of human labor
TABLE 4: OPERATION-WISE DISTRIBUTION OF HUMAN LABOR FOR PRODUCING DIFFERENT CROPPING PATTERNS ON FULL COST BASIS
Operations Jute-Aman rice-Wheat
(P1)
Aus rice-Potato- Fallow (P2)
Jute-Potato- Fallow (P3) Aus rice-Aman rice-Wheat (P4)
Qty. (man-days/ha)
Tk./ha Qty. (man-days/ha)
Tk./ha Qty. (man-days/ha)
Tk./ha Qty.
(man-days/ha)
Tk./ha
Land preparation 25.05 4982.95 39.51 7902.00 34.31 6862.00 30.23 6046.00
Spading 12.51 2502.00 28.18 5636.00 22.78 4556.00 17.91 3582.00
Transplanting/ Sowing 34.72 6944.00 64.00 12800.00 42.00 8400.00 56.72 11344.00
Weeding 34.34 6868.00 28.35 5670.00 23.65 4730.00 39.04 7808.00
Application of fertilizer and manure 11.26 2252.00 17.77 3554.00 16.27 3254.00 12.76 2552.00
Application of insecticide 5.86 1172.00 6.07 1214.00 5.67 1134.00 6.26 1252.00
Application of irrigation 6.07 1214.00 12.04 2408.00 12.04 2408.00 6.07 1214.00
Harvesting,
carrying and thrashing /washing and drying
71.24 14248.00 77.16 15432.00 76.39 15278.00 72.01 14402.00
Marketing 14.45 2890.00 18.32 3664.00 21.01 4202.00 11.76 2352.00
Total human labor 215.50 43072.95 291.40 58280.00 254.12 50824.00 252.76 50552.00
Source: Field survey, 2010.
TABLE 5: OPERATION-WISE DISTRIBUTION OF HUMAN LABOR FOR PRODUCING DIFFERENT CROPPING PATTERNS ON CASH COST BASIS
Operations Jute-Aman rice-Wheat
(P1)
Aus rice-Potato- Fallow (P2)
Jute-Potato- Fallow (P3) Aus rice-Aman rice-Wheat (P4)
Qty. (man-days/ha)
Tk./ha Qty. (man-days/ha)
Tk./ha Qty. (man-days/ha)
Tk./ha Qty.
(man-days/ha)
Tk./ha
Land preparation 8.27 1654.00 11.71 2342.00 9.51 1902.00 10.47 2094.00
Spading 4.02 804.00 7.42 1484.00 4.22 844.00 7.22 1444.00
Transplanting/ Sowing 21.16 4232.00 26.00 5200.00 15.50 3100.00 31.66 6332.00
Weeding 19.57 3914.00 10.80 2160.00 13.10 2620.00 17.27 3454.00
Application of fertilizer and manure
- - 3.57 714.00 2.37 474.00 1.20 240.00
Application of insecticide - - - -
Application of irrigation 3.57 714.00 4.36 872.00 4.36 872.00 3.57 714.00
Harvesting,
carrying and thrashing/wash ing and drying
44.87 8974.00 32.00 6400.00 33.56 6712.00 43.31 8662.00
Marketing 5.82 1164.00 6.18 1236.00 8.48 1696.00 3.52 704.00
Total human labor 107.28 21456.00 102.04 20408.00 91.10 18220.00 118.22 23644.00
Source: Field survey, 2010
Cost of Animal Labor / Mechanical Power
In Bangladesh, the use of animal labor usually involves a pair of animal and one attendant. Most of the sample farmers used family supplied animal labor, but a few of them used hired animal labor. The measuring unit for animal labor was pair-day, locally called ‘hal’. Animal pair-day was assumed to be five hours of work. Home supplied animal labor was priced at the prevailing hiring rate. Due to scarcity of animal draft power, some farmers used power tiller for land preparation in the study area. During the study period, the average hiring rate of animal labor was Tk. 280 per pair-day and power tiller cost was Tk.2000 per hectare in the study area. For animal and mechanical power together, farmers spent Tk.10243.20, Tk. 7817.60, Tk. 7664.00 and Tk.10396.80 in full cost basis and no cost in cash cost basis for the patterns P1, P2, P3, and P4 respectively (Table 6 & 8).
Cost of Seed /Seedling
Farmers used home supplied seed / seedlings. The cost of home supplied seed / seedlings were valued at the price which farmers would have got if he had sold it to the market. Farmer used the seed / seedling having costs of Tk. 6297.15, Tk. 35899.50, Tk. 33895.95 and Tk. 8300.70 for the patterns P1, P2, P3, and P4 respectively (Table 6). Price of seeds was charged Tk.100 per kg for Jute, average price Tk. 40 per kg for Wheat, Potato, Aus and Aman during the period of study area.
Cost of Manure
For producing different crops, most of the farmers in the study area used manure, such as cow dung, and oilcake from home-supplied and purchased. Use of cow dung as manure was very low. Because, they mostly used cow dung as fuel. Price of oilcake was Tk.18.00/ kg and cow dung was assumed fixed for all farmers at Tk. 0.30/ kg. It was observed from the Table 6 that farmers applied 10451.58, 10254.70, 9928.98 and 10777.30 kg cow dung per hectare amounting Tk. 3135.47, Tk. 3076.41, Tk. 2978.69 and Tk. 3233.19 for the patterns P1, P2, P3, and P4 respectively. Oilcake was not applied for the patterns P1 and P4 but the patterns P2 and P3 were applied same amount of oilcake of 193.56 kg/ ha and costing at Tk. 3484.08 (Table 6).
Cost of Fertilizers
Proper use of fertilizer can enhance agricultural production to a great extent and help to improve soil fertility. Farmers in the study area used three kinds of chemical fertilizers namely Urea, Triple Super Phosphate (TSP) and Muriate of Potash (MP) which were purchased by the farmers. In study area, the cost of fertilizers was charged at the purchase price of fertilizer from the market. Application of Urea was common for all farmers. Farmers responded to have applied the dose of 469.34, 425.26, 388.21 and 506.39 kg Urea, 318.76, 283.51, 214.83 and 387.44 kg TSP and 292.32, 351.16, 316.58 and 326.90 kg MP for the patterns P1, P2, P3, and P4 respectively. Their corresponding costs were estimated at Tk.2581.37, 2338.93, 2135.16 and 2785.15 for Urea, Tk.3825.12, 3402.12, 2577.96 and 4649.28 for TSP and Tk.2630.88, 3160.44, 2849.22 and 2944.10 for MP for the aforementioned patterns, respectively (Table 6 & 8). It is evident from Table 6 that the highest amount of fertilizer (1220.73 kg/ ha) was used for the pattern P4 than those of other patterns practiced by the farmers in the study area.
Cost of Insecticides
In the study area most of the farmers used insecticides, such as Tilt, Agro-vita, Vitaforan, Agnol, Relothin, Opsin, Basudin etc. The costs of insecticides were computed on the basis of the actual prices paid by the farmers. Insecticide costs were Tk.1499.73, Tk. 1629.05, Tk. 1628.71 and Tk. 1500.07 for the patterns P1, P2, P3, and P4 respectively (Table 6 & 8).
Cost of Irrigations
VOLUME NO.3(2013),ISSUE NO.02(FEBRUARY) ISSN 2231-5756
INTERNATIONAL JOURNAL OF RESEARCH IN COMMERCE, IT & MANAGEMENT
Land Rent
The cost of land was different for different crops depending upon their location, topography and fertility of the soil. The cost of land use may be estimated using one of the following three alternative ways:
i. Interest on the average value of land; ii. Rental value, and
iii. Forgoing income from alternative use.
In this study, the cost of land was estimated taking the interest on the average value of land. The interest was charged at the rate of 9 percent per annum. Interest on the average value of land was computed by using the following formula (Hossain, 2000):
C = V x I x T Where,
C = Interest on the average value of land V = value of land
I = Rate of interest per annum T = Length of production period.
It was assumed at Tk. 82585.35, Tk. 44242.26, Tk. 50141.22 and Tk. 76689.39 for the patterns P1, P2, P3, and P4 respectively (Table 6).
Interest on Operating Capital
The operating capital included cash expenses on purchased inputs, such as, human labor, animal power, seeds, manure’s, fertilizers, insecticides, irrigation etc. In estimating this cost the interest rate was assumed to be 9 percent per annum. Interest on operating capital was calculated in accordance with the following formula (Hossain , 2000):
Interest on operating capital = Alit Where,
Al = (total investment)/2 i = interest rate
t = length of the period of crop production
Here, time covered the period from land preparation to harvesting. In this case, interest on operating capital was charged for four months for each crop. Interest on operating capital was calculated at Tk. 1385.97, Tk. 1159.35, Tk. 1288.23 and Tk. 1257.09 for the patterns P1, P2, P3, and P4 respectively (Table 6).
Total Variable Cost and Gross Cost
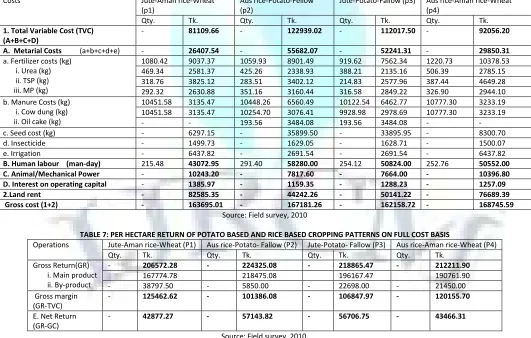
At full cost basis, gross cost and total variable cost were Tk. 163695.01 and Tk. 81109.66 for pattern P1, Tk. 167181.26 and Tk. 122939.02 for pattern P2, Tk. 162158.72 and Tk. 112017.50 concerning pattern P3, and Tk. 168745.59 and Tk. 92056.20 regarding pattern P4, respectively. As land rent was not included in cash cost total variable cost (TVC) and gross cost are same at this cash cost basis. Costs incurred for the patterns P1, P2, P3, and P4, at cash cost basis, were Tk. 41992.07, Tk. 70361.36, Tk. 67482.62 and Tk. 44872.82, respectively (Table 9). It is observed that patterns P2 incurred the highest cost followed by the pattern P3 and pattern P4 incurred the lowest cost preceded by the pattern P1.
TABLE 6: PER HECTARE COST OF POTATO BASED AND RICE BASED CROPPING PATTERNS ON FULL COST BASIS
Costs Jute-Aman rice-Wheat
(p1)
Aus rice-Potato-Fellow (p2)
Jute-Potato-Fallow (p3) Aus rice-Aman rice-Wheat (p4)
Qty. Tk. Qty. Tk. Qty. Tk. Qty. Tk.
1. Total Variable Cost (TVC) (A+B+C+D)
- 81109.66 - 122939.02 - 112017.50 - 92056.20 A. Metarial Costs (a+b+c+d+e) - 26407.54 - 55682.07 - 52241.31 - 29850.31
a. Fertilizer costs (kg) i. Urea (kg) ii. TSP (kg) iii. MP (kg)
1080.42 9037.37 1059.93 8901.49 919.62 7562.34 1220.73 10378.53
469.34 2581.37 425.26 2338.93 388.21 2135.16 506.39 2785.15
318.76 3825.12 283.51 3402.12 214.83 2577.96 387.44 4649.28
292.32 2630.88 351.16 3160.44 316.58 2849.22 326.90 2944.10
b. Manure Costs (kg) i. Cow dung (kg) ii. Oil cake (kg)
10451.58 3135.47 10448.26 6560.49 10122.54 6462.77 10777.30 3233.19 10451.58 3135.47 10254.70 3076.41 9928.98 2978.69 10777.30 3233.19
- - 193.56 3484.08 193.56 3484.08 - -
c. Seed cost (kg) - 6297.15 - 35899.50 - 33895.95 - 8300.70
d. Insecticide - 1499.73 - 1629.05 - 1628.71 - 1500.07
e. Irrigation - 6437.82 - 2691.54 - 2691.54 - 6437.82
B. Human labour (man-day) 215.48 43072.95 291.40 58280.00 254.12 50824.00 252.76 50552.00 C. Animal/Mechanical Power - 10243.20 - 7817.60 - 7664.00 - 10396.80 D. Interest on operating capital - 1385.97 - 1159.35 - 1288.23 - 1257.09 2.Land rent - 82585.35 - 44242.26 - 50141.22 - 76689.39 Gross cost (1+2) - 163695.01 - 167181.26 - 162158.72 - 168745.59
Source: Field survey, 2010
TABLE 7: PER HECTARE RETURN OF POTATO BASED AND RICE BASED CROPPING PATTERNS ON FULL COST BASIS
Operations Jute-Aman rice-Wheat (P1) Aus rice-Potato- Fallow (P2) Jute-Potato- Fallow (P3) Aus rice-Aman rice-Wheat (P4)
Qty. Tk. Qty. Tk. Qty. Tk. Qty. Tk.
Gross Return(GR) i. Main product ii. By-product
- 206572.28 - 224325.08 - 218865.47 - 212211.90
167774.78 218475.08 196167.47 190761.90
- 38797.50 - 5850.00 - 22698.00 - 21450.00
Gross margin (GR-TVC)
- 125462.62 - 101386.08 - 106847.97 - 120155.70
E. Net Return (GR-GC)
- 42877.27 - 57143.82 - 56706.75 - 43466.31
TABLE 8: PER HECTARE COST OF POTATO BASED
Costs Jute-Aman rice-Wheat (P1)
Qty. Tk.
1. Total Variable Costs (TVC) (A+B+C+D)
41992.07 A. Material Costs - 20536.07
a. Fertilizer costs (kg) i. Urea (kg) ii. TSP (kg) iii. MP (kg)
1080.42 9037.37 469.34 2581.37 318.76 3825.12 292.32 2630.88 b. Manure Costs (kg)
i. Cow dung (kg) ii. Oil cake (kg)
- -
- -
- -
c. Seed cost (kg) - 3561.15
d. Insecticide - 1499.73
e. Irrigation - 6437.82
B. Human labour (man-day) 107.28 21456.00 C. Animal/Mechanical Power - -
D. Interest on operating capital - -
2. Land rent - -
Gross Costs (1+2) - 41992.07
TABLE 9: PER HECTARE RETURN OF POTATO BAS
Operations Jute-Aman rice-Wheat (P1)
Qty. Tk. Gross Return (GR)
Main product By-product
- 118041.30
- 95871.30
- 22170.00
Gross Margin (GR-TVC) - 76049.23 E. Net Return (GR-GC) - 76049.23
FIG.1: GROSS RETURN, GROSS COST, GROSS MARGIN, NET RETURN OF
30000
60000
90000
120000
150000
180000
210000
Jute-Aman rice
Wheat (p1)
206572.28
163695.01
125462.62
T
o
ta
l
o
u
tp
u
t
in
T
k
.
Gross Return
COST OF POTATO BASED AND RICE BASED CROPPING PATTERNS ON CASH
Wheat (P1) Aus rice-Potato- Fallow (P2) Jute-Potato- Fallow (P3)
Tk. Qty. Tk. Qty. Tk.
41992.07 - 70361.36 - 67482.62 20536.07 49953.36 - 49262.62
9037.37 1059.93 8901.49 919.62 7562.34
2581.37 425.26 2338.93 388.21 2135.16
3825.12 283.51 3402.12 214.83 2577.96
2630.88 351.16 3160.44 316.58 2849.22
193.56 3484.08 193.56 3484.08
- - - -
193.56 3484.08 193.56 3484.08
3561.15 - 33247.20 - 33895.95
1499.73 - 1629.05 - 1628.71
6437.82 - 2691.54 - 2691.54
21456.00 102.04 20408.00 91.10 18220.00
- - - -
- - - -
- - - -
41992.07 - 70361.36 - 67482.62
Source: Field Survey, 2010
RETURN OF POTATO BASED AND RICE BASED CROPPING PATTERNS ON CASH COST BAS
Wheat (P1) Aus rice-Potato- Fallow (P2) Jute-Potato-Fallow (P3)
Aus rice
Qty. Tk. Qty. Tk. Qty.
118041.30 - 153001.21 - 148918.77 -
95871.30 - 149011.21 - 133474.77 -
22170.00 - 3990.00 - 15444.00 -
76049.23 - 82639.85 - 85714.01 -
76049.23 - 82639.85 - 81436.15 -
Source: Field survey, 2010.
RGIN, NET RETURN OF POTATO BASED CROPPING PATTERNS COMPARED
Aman
rice-Wheat (p1)
Aus
rice-Potato-Fallow (p2)
Jute-Potato-Fallow
(p3)
224325.08
218865.47
212211.9
163695.01
167181.26
162158.72
125462.62
101386.08
106847.97
42877.27
57143.82
56706.75
Cropping Pattern
Gross Return
Gross Cost
Gross Margin
Net Return
ING PATTERNS ON CASH COST BASIS
Fallow (P3) Aus rice-Aman rice-Wheat (P4)
Qty. Tk.
- 44872.82 - 21228.82
1220.73 10378.53 506.39 2785.15 387.44 4649.28 326.90 2944.10
- -
- -
- -
- 2912.40
- 1500.07
- 6437.82
118.22 23644.00
- -
- -
- -
- 44872.82
RNS ON CASH COST BASIS
Aus rice-Aman rice-Wheat (P4)
Qty. Tk. 121810.19 109915.19 11895.00 76937.37 76937.37
G PATTERNS COMPARED TO RICE BASED ON FULL COST BASIS
VOLUME NO.3(2013),ISSUE NO.02(FEBRUARY
INTERNATIONAL JOURNAL OF RESEARCH IN COMMERCE
FIG.2: GROSS RETURN, GROSS COST, GROSS MARGIN, NETD. RELATIVE PROFITABILITY: A COMPARISON
Gross Return
The pattern P2 was superior in terms of economic return in comparison with the other cropping pat
by-product of Tk. 5850.00 followed by the pattern P3, having per hectare amounting Tk. 218865.47 including by patterns, pattern P4 that Tk. 212211.90 including by-product of Tk. 21450.00 and pattern P1 Tk. 206572.28 including by earned (Table 8).
Gross Margin and net Return
Considering full cost, gross margin was estimated at Tk. 125462.62, Tk. 101386.08, Tk. 10684
respectively (Table 6). The net return was estimated at Tk. 57143.82 for the pattern P2, Tk. 56706.75 for the pattern P3, Tk.
42877.27 for the pattern P1 respectively, which have been written in order of highest to lowest. Based upon cash cost, gross margin or net return, whatever it may be, was computed at Tk.82639.85, Tk. 81436.15, Tk. 76937.37 and Tk. 76049.23 regarding the patterns P2, P3, P4, and P1 re
CONCLUSION
In terms of economic viability, the Aus rice-Potato-Fallow pattern appeared to have the greatest potential as replacement for the farmers’ than other cropping patterns. Aus rice-Potato-Fallow had the highest net return compared
recommended to the farmers.
REFERENCES
1. BBS (2008) ‘Agriculture Yearbook of Bangladesh’, the People’s Republic of Bangladesh, Dhaka.
2. BBS (2010) “Population Census” Statistical Year Book of Bangladesh
Bangladesh, Dhaka.
3. FAO (1987) “Production Yearbook 1987”,Food and Agriculture Organization of the United Nations
4. Hossain, M.M.S. (2000) “ A comparative Economic Analysis of Banana and other Crop Production in Some Selected Areas of Mymens District”, M.S. Thesis, Department of Agricultural Economics
5. Huq, A. S., Alam, M.A. S., and Akter, S. (2007) “Supply response of potato in Bangladesh”
6. Islam, M. T. (1987) “An Economic Study of Potato Preservation in Cold Storage in Some Selected Areas of Bangladesh”, M. S. Thesis,
operation and Marketing, Bangladesh Agricultural University, Mymensingh
7. Roy, A. (1993) “Relative profitability of potato based and wheat based cropping patterns in a selected area in Bangladesh”, M.S. Thesis,
Agricultural Economics, Bangladesh Agricultural University, Mymensingh 8. Shiblee, S. M. A. Hafiz, Golam, Y. J., Mahmud, A. K., Rahman,
Journal of Agriculture , Vol. 25 (1 &2) : 21- 34
9. Yang, W. Y. (1965) “Method of Management Investment for Improving Farm Productivity”
30000
60000
90000
120000
150000
180000
Jute-Aman rice
Wheat (p1)
118041.3
41992.07
76049.23
T
o
ta
l
o
u
tp
u
t
in
T
k
.
Gross Return
EBRUARY)INTERNATIONAL JOURNAL OF RESEARCH IN COMMERCE, IT
, GROSS MARGIN, NET RETURN OF POTATO BASED CROPPING PATTERNS COMPARED TO RICE BAS
The pattern P2 was superior in terms of economic return in comparison with the other cropping patterns. Per hectare giving the farmers Tk.224325.08 including product of Tk. 5850.00 followed by the pattern P3, having per hectare amounting Tk. 218865.47 including by-product of Tk. 22698.00 among the rest of the
product of Tk. 21450.00 and pattern P1 Tk. 206572.28 including by
Considering full cost, gross margin was estimated at Tk. 125462.62, Tk. 101386.08, Tk. 106847.97 and Tk. 120155.70 for the patterns P1, P2, P3, and P4 respectively (Table 6). The net return was estimated at Tk. 57143.82 for the pattern P2, Tk. 56706.75 for the pattern P3, Tk.
ively, which have been written in order of highest to lowest. Based upon cash cost, gross margin or net return, whatever it may be, was computed at Tk.82639.85, Tk. 81436.15, Tk. 76937.37 and Tk. 76049.23 regarding the patterns P2, P3, P4, and P1 re
Fallow pattern appeared to have the greatest potential as replacement for the farmers’ than other cropping Fallow had the highest net return compared to other cropping patterns. Based on findings, Aus rice
BBS (2008) ‘Agriculture Yearbook of Bangladesh’, Statistical Year Book of Bangladesh, Bangladesh Bureau of Statistics, Ministr
Statistical Year Book of Bangladesh, Statistics Division, Ministry of Planning, Government of the People’s Republic of
Food and Agriculture Organization of the United Nations, Rome, Italy. Vol. 41( 82).
Hossain, M.M.S. (2000) “ A comparative Economic Analysis of Banana and other Crop Production in Some Selected Areas of Mymens
Department of Agricultural Economics, Bangladesh Agricultural University, Mymensingh.
Huq, A. S., Alam, M.A. S., and Akter, S. (2007) “Supply response of potato in Bangladesh” Bangladesh Journal of Agriculture
, M. T. (1987) “An Economic Study of Potato Preservation in Cold Storage in Some Selected Areas of Bangladesh”, M. S. Thesis, , Bangladesh Agricultural University, Mymensingh-2202 .
ility of potato based and wheat based cropping patterns in a selected area in Bangladesh”, M.S. Thesis, , Bangladesh Agricultural University, Mymensingh-2202.
Shiblee, S. M. A. Hafiz, Golam, Y. J., Mahmud, A. K., Rahman, K. T., Khalilur, S. M. (2000) “Resource utilization in rice based cropping system”
Yang, W. Y. (1965) “Method of Management Investment for Improving Farm Productivity” Food and Agricultural Orga
Aman
rice-Wheat (p1)
Aus
rice-Potato-Fallow (p2)
Jute-Potato-Fallow
(p3)
Aus rice
rice
153001.21
148918.77
121810.19
70361.36
67482.62
76049.23
7
6
0
82639.85
81436.15
4
9
.2
3
8
2
6
3
9
.8
5
8
1
4
3
6
.1
5
Cropping Pattern
Gross Return
Gross Cost
Gross Margin
Net Return
ISSN 2231-5756
& MANAGEMENT
COMPARED TO RICE BASED ON CASH COST BASISterns. Per hectare giving the farmers Tk.224325.08 including product of Tk. 22698.00 among the rest of the product of Tk. 21450.00 and pattern P1 Tk. 206572.28 including by-product of Tk. 38797.50 were farmers
7.97 and Tk. 120155.70 for the patterns P1, P2, P3, and P4 respectively (Table 6). The net return was estimated at Tk. 57143.82 for the pattern P2, Tk. 56706.75 for the pattern P3, Tk. 43466.31 for the pattern P4 and Tk. ively, which have been written in order of highest to lowest. Based upon cash cost, gross margin or net return, whatever it may be, was computed at Tk.82639.85, Tk. 81436.15, Tk. 76937.37 and Tk. 76049.23 regarding the patterns P2, P3, P4, and P1 respectively (Table 9).
Fallow pattern appeared to have the greatest potential as replacement for the farmers’ than other cropping to other cropping patterns. Based on findings, Aus rice-Potato-Fallow pattern should be
, Bangladesh Bureau of Statistics, Ministry of Planning, Government of
, Statistics Division, Ministry of Planning, Government of the People’s Republic of
, Rome, Italy. Vol. 41( 82).
Hossain, M.M.S. (2000) “ A comparative Economic Analysis of Banana and other Crop Production in Some Selected Areas of Mymensingh and Tangail
Bangladesh Journal of Agriculture, Vol. 32 (1): 71.
, M. T. (1987) “An Economic Study of Potato Preservation in Cold Storage in Some Selected Areas of Bangladesh”, M. S. Thesis, Department of
Co-ility of potato based and wheat based cropping patterns in a selected area in Bangladesh”, M.S. Thesis, Department of
K. T., Khalilur, S. M. (2000) “Resource utilization in rice based cropping system” Bangladesh
Food and Agricultural Organization (FAO), Rome, Italy.
Aus rice-Aman
rice-Wheat (p4)
121810.19
44872.82
76937.37
7
6
REQUEST FOR FEEDBACK
Dear Readers
At the very outset, International Journal of Research in Commerce, IT and Management (IJRCM)
acknowledges & appreciates your efforts in showing interest in our present issue under your kind perusal.
I would like to request you to supply your critical comments and suggestions about the material published
in this issue as well as on the journal as a whole, on our E-mail i.e.
for further
improvements in the interest of research.
If you have any queries please feel free to contact us on our E-mail
.
I am sure that your feedback and deliberations would make future issues better – a result of our joint
effort.
Looking forward an appropriate consideration.
With sincere regards
Thanking you profoundly
Academically yours
Sd/-
VOLUME NO.3(2013),ISSUE NO.02(FEBRUARY) ISSN 2231-5756