http://dx.doi.org/10.3926/jiem.1720
Proposition of a Modeling and an Analysis Methodology of Integrated
Reverse Logistics Chain in the Direct Chain
Faycal Mimouni , Abdellah Abouabdellah
Systems Engineering Laboratory, MOSIL, ENSA, University Campus (Morocco)
[email protected], [email protected]
Received: October 2015
Accepted: March 2016
Abstract:
Purpose: Propose a modeling and analysis methodology based on the combination of Bayesian networks and Petri networks of the reverse logistics integrated the direct supply chain.
Design/methodology/approach: Network modeling by combining Petri and Bayesian network
Findings: Modeling with Bayesian network complimented with Petri network to break the cycle problem in the Bayesian network
Research limitations/implications: Demands are independent from returns
Practical implications: Model can only be used on nonperishable products
Social implications: Legislation aspects: Recycling laws; Protection of environment; Client satisfaction via after sale service.
Originality/value: Bayesian network with a cycle combined with the Petri Network
1. Introduction
The issue presented in this work is to propose a modeling methodology and analysis of integrated reverse logistics chain in the direct chain.
Our graphic template will be realized based on the use of Bayesian networks. Indeed, these allow us a better management of returns:
• Represent the components of a return path: product returns;
• Analyze, characterize and integrate the various inherent uncertainties of reverse logistics;
• Represent trajectories evaluation criteria.
Product returns are uncontrollable and unpredictable hence the origin of the difficulty of prior planning for the return logistics. Besides, when returning a product, there are different states of returned products hence the need for a stochastic approach to handle returned products. (Chouinard, 2005)
Indeed, the recovered products vary depending on their state. We distinguish three categories of products returned:
• Convertible Product to raw material: They can be converted into raw material to be reused in the industry;
• Product convertible to finished product: product: they Can Be Transformed into the final product after-sales processing or return;
• Throw Product: product Recovered without any benefit to the industry: they must be rejected.
On a previous study (Mimouni, Abouabdellah & Mharzi, 2015a), we found out that returned products for reparation represent the most beneficial type of returns in the global chain. That is why we chose to focus our work on the impact of the returns on the production process and specially retuned products for reparation. Our study will focus on the relation between the production process and returned products specially the “products for reparation”
2. Literature Review
2.1. Reverse Logistics
The term reverse logistics is the most commonly encountered in the literature when it comes to returns management and processing of recovered products. This name is suggestive of the fact that it allows to refer to the related logistics activities of an organization, but in an opposite direction, as opposed to the regular activities of the supply chain. Given the emergence of the concepts of reverse logistics in the last ten years, it is not surprising that the use of a relatively varied and sketchy terminology. Reverse logistics is often treated in the literature in a given context: specifically address activities or disassembly of products in electronic commerce, or refers often to a definite case study focusing on a particular type return (Lambert & Riopel, 2003).
Thierry, Salomon, Nunnen and Wassenhove (1995) discuss the reverse logistics under the name of managing the recovery (Product recovery management), as:
“The management of products, components and materials used or disposed of that are the responsibility of the manufacturing company. The objective of the management of product recovery is to obtain the maximum economic and environmental value reasonably possible, while reducing the ultimate amount of waste.”
For their part, Beaulieu, Martin and Landry (1999), Beaulieu (2000) have reverse logistics, this time under the term reverse logistics, as:
“A set of management activities to reintroduce non-core assets in sectors with added value.”
In the recent studies, the reverse logistics also known as the Closed Loop Supply Chain (CLSC), (Ramezani, Kimiagari & Karimi, 2014; Govindan, Jafarian, Khodaverdi & Devika, 2014) designed to manage the recycling and recovery process of end-of-life products (Guide & Van Wassenhove, 2009; Das & Posinasetti, 2015). A Closed loop supply chain generally involves a manufacturer taking care for the reverse logistics process. The goods are returned and recovered directly by the original manufacturer or through indirect channels (Ashayeri, Ma & Sotirov, 2015). All the returned goods are resold in primary or secondary market after necessary disposition (Turrisi, Bruccoleri & Cannella, 2013). Essentially, a CLSC extends the normal forward SC by including reverse SC channels for product return, recycling/recovery, remanufacturing, and resale (He, 2015).
2.2. Modeling’s Methodology
The reason why modeling tools from enterprise modeling or modeling frameworks networks are used is because they offer to the manufacturers a static representation of the system,
The modeling tools developed in the enterprise modeling domain are widely used to represent supply chains (Dolgui, Levin & Louly, 2005).
However, these tools apprehend it as a business type of organization and not as an organization of business network type.
Indeed, the properties of the organizational structure such as the autonomy of entities and dynamics of interactions are not usually expressed or implied in these models designed mainly based on systems theory.
The main problems of current methods of modeling methods reside in their static models and vis-à-vis rigidity of stochastic behavior in the example of the random behavior of returns. Firstly, Bayesian networks allow us to better understand the possible scenarios appalling returns to better analyze and follow the return process. However, reverse logistics is known for its cycles (reintroduction of products) that cannot be represented in the Bayesian networks. That is why we tried to complement the model with the Petri network.
In terms of utilizing different approaches in modelling various problems of reverse logistics, the integrity approach is used to construct general methods of modelling. For example:
• Artificial neural network (ANN) (Mazhar, Kara & Kaebernick, 2007);
• Piecewise interval programming (Zhang, Huang & He, 2011);
• Dynamic regression models (Carrasco-Gallego & Ponce-Cueto, 2009);
• Statistical modelling (Pati, Vrat & Kumar, 2010);
• Robust Bayesian belief networks with interval probabilities (Shevtshenko & Wang 2009);
• Engineering economics techniques (Krikke, 2010);
• Combining input–output analysis and Laplace transforms (Bogataj & Grubbström 2013);
• Theory of production frontier (Lai, Wu & Wong, 2013);
• Institutional theory (Ye, Zhao, Prahinski & Li, 2013);
2.3. The Importance of the Study of this Problem
The advantage of the integration of reverse logistics is mainly customer satisfaction. Indeed, the reason for this satisfaction is varied according to Rogers (2001) and Tibenn-Lembke (2002), Carter and Ellram (1998), Langnau (2001) and Dowlatshashi (2000). But the main reasons are the laws in some countries, centered on customer service marketing aspect or interest of some consumers for healthy products to the environment in addition to the economic aspect returns for recycling material and ecological and environmental aspects (Lambert & Riopel, 2003).
Our goal for the graphical modeling based on the use of Bayesian networks is to better understand the random behavior of product returns. Indeed, Bayesian networks allow us to analyze, characterize and integrate the various uncertainties inherent in the field of return logistics. In addition to the Bayesian network, we propose to add the transitions from the Petri networks on different links to better model the process of product return and to better characterize the sorting function.
These transitions will be defined by the limitations set by the user, but in the general case it will cover the cost of the main returns processing and quality potential extract.
Furthermore, previous study has shown that reverse logistics has a big impact not only on the cost but also on delay cause to the production process and on the stocks management, (Mimouni, Abouabdellah & Mharzi, 2014), and also that reverse logistics can be very beneficial at low rates of returns specially in companies producing automotive wiring (Mimouni, Abouabdellah & Mharzi, 2015b).
3. Methodology
4. Approach
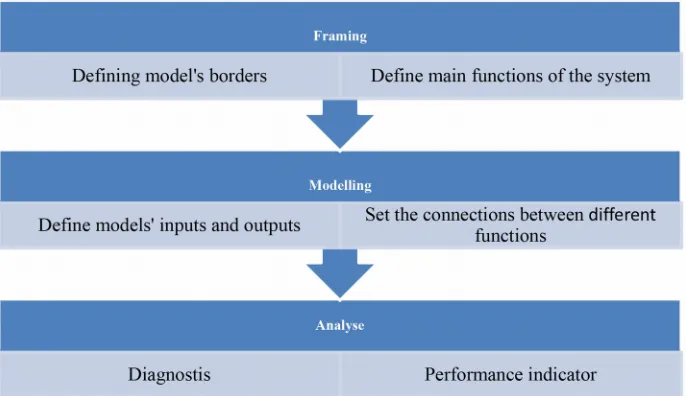
Our methodology for modeling and analysis will follow the following steps:
Figure 1. Modeling methodology
Our methodology will be based on a graphical model to analyze the working process of the reverse logistics integrated in a direct chain.
For this, we will first define the limits of our model in both the direct chain and the reverse chain. Then we will present a global model connecting both chains finally. And finally, we will test and analyze our model in a case study.
4.1. Framing
This initial phase aims to precise the positioning of the methodology within the company. Before beginning the modeling and the analyzing phase, we define and clarify the scope and limitation of our methodology.
Our methodology will focus on the two main chains of logistics: the direct chain and the reverse chain. We will limit our study for the direct chain to three main functions:
• Supply: Acquisition of raw materials and acquisition of raw materials extracted from returned products;
• Manufacturing: Products’ manufacturing and products’ treatment;
Figure 2. Direct chain model
We note that this part (the direct chain) is determinist and has less random behaviors than the reverse logistic.
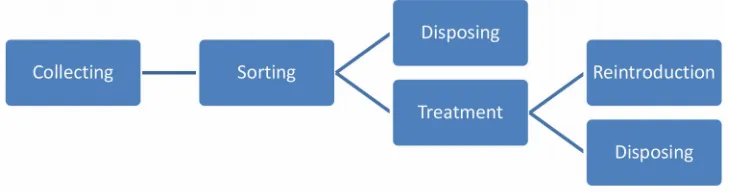
For the reverse chain, we will limit our study to main functions:
• Collecting: Collect returned products from clients;
• Sorting: Sort returned products;
• Treatment: treat returned products;
• Reintroduction: reintroduce returned product to the direct chain after treatment
• Disposing: Disposing of returned products.
Figure 3. Reverse chain model
products represents a portion of the delivered products. The problem in the process “Collecting” resides in the random ratio returned for each month.
4.2. Modeling
The objective is the description of the supply chain through process and graphs. The main challenges lie in achieving an objective representation, precise and clear operation of both the reverse chain and the direct chain including the size, activities and the link between the two chains.
For our graphical model, we will combine both networks: Petri and Bayesian.
• The Petri network will be to define transitions and model deterministic part of the model such as the direct chain;
• The Bayesian network known for modelling stochastic behaviour will be mostly used in the reverse chain to better describe the random behaviour of the returned products and there condition at arrival.
The connection between the direct chain and the reverse chain will be in collecting returned products previously sold and derived to clients and in the reintroduced products either as raw materials or as repaired products.
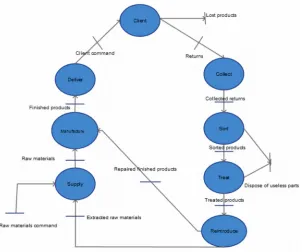
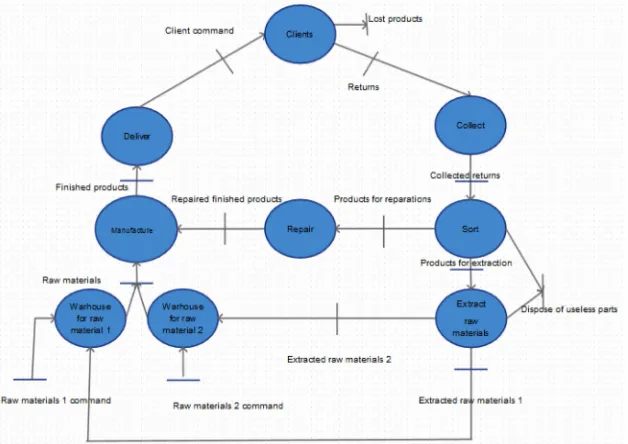
The global model is summarized as follow:
The global model links the two previous chains: direct chain and reverse chain in a single model. As seen on the model, the returned products originate from the delivered products. Moreover, we can divide the client to diverse categories depending on the state and quality of returned products they return.
In Bayesian networks, there are two kinds of random variables: those that are observed and those that are not observed. For example, we can get a returned product (observed variable) but we can never directly observe what kind of benefit we can get from it before sorting process we can only infer that from its source. . In our case the observed variables are the sources of returns and the not observed variables are the state of the returned product. For example, product returned from after sales services are more likely to be beneficial than those collected from clients after usage.
4.3. Analyses
This phase will lead to the development of diagnosis. We will proceed with an analysis of each of the described process to identify the effect of each process on the performance of the complete chain and specially the impact of the reverse chain on the direct one.
For starter, in the analyzed process we begin by presenting the chart of the random behavior of each component in the reverse logistics.
We apply the proposed model in our case study; we aim to analyze both the direct chain and the reverse chain behavior.
Our case study is presented as follow:
In our case, we chose the three most beneficial returns: returned products for reparation and the two most frequently and beneficial extracted raw materials.
The collecting is source of the first function to have a random behavior. For our case study, we will consider the following values for each case scenario depending of the source of the returns:
Collect Returns (ratio) Returns ( value )
Clients 0.2 9200
After sales services 0.15 6900
Collectors 0.3 13800
Lost products 0.35 16100
Table 1. Ratio and values of returns depending on the source of returns
The collecting function influence the behavior of the sorting process seeing that the source also behave on the state of the product. We obtained the following values:
Sort Reparation Extraction Disposed of
Clients 0.37 0.41 0.22
After sales services 0.78 0.17 0.05
Collectors 0 0.32 0.68
Table 2. Ratio of each returned product’s states depending on the sources
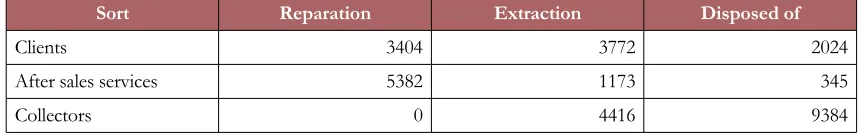
Sort Reparation Extraction Disposed of
Clients 3404 3772 2024
After sales services 5382 1173 345
Collectors 0 4416 9384
Table 3. Values of each returned product’s states depending on the sources
In this process, we have three branches:
• Disposed of products: represents useless returned products;
• Reparation products: represents products that needs simple reparation to be reintroduced directly to the direct as finished products;
Disposed of products are ejected from our model since they aren’t beneficial for the system. Whereas the products for reparation will be sent to the reparation function and then reintroduced to the direct chain as finished products.
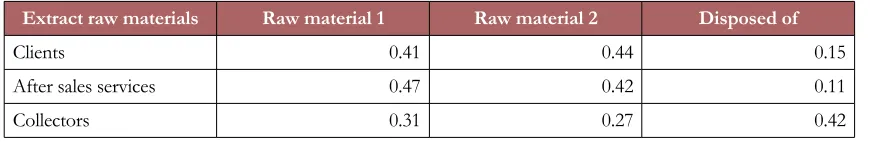
None the less, returned products for extraction still need to go through the extraction process. In this process, we salvage the two chosen raw material noted raw material 1 and raw material 2. Unfortunately, the salvaged materials are random and can’t be determined before head. For our case study, we have the following values:
Extract raw materials Raw material 1 Raw material 2 Disposed of
Clients 0.41 0.44 0.15
After sales services 0.47 0.42 0.11
Collectors 0.31 0.27 0.42
Table 4. Ratio of extracted material depending on the source of returns
Extract raw materials Raw material 1 Raw material 2 Disposed of
Clients 1547 1660 304
After sales services 2560 493 38
Collectors 1369 1192 3941
Table 5. Values of extracted material depending on the source of returns
These extracted materials will be reintroduced in the direct chain as raw materials which will benefit the supply chain by reducing commands for raw materials.
5. Findings and Analysis
With our model, we can follow the flow the reverse logistics with it stochastic behaviour and its impact on the direct chain. Moreover, we can monitor our system with the help of the quantity passing through each transition in our model.
Our model allows us to introduce the Bayesian network on a cyclic model. However, it is only possible when we have determinist process that breaks the stochastic behaviour. In our case, it is the production process since it is independent of the system and is determined via external influence (Market, client demand …).
The reverse chain is linked to the direct chain and our model can help provide an insight to the potential impact of the reverse chain on the direct chain and decrease the randomness on the prevision for the rates of different types of returns.
6. Conclusion and Future Works
We found in our study that our model can be implemented on a reverse chain integrated in the direct chain without having conflict with the Bayesian model since it can’t be used in a cyclic flow. However, we stay dependent of the breaking element that will stop the influence of the random behaviour generated by the reverse chain.
However, our model could be extended with more conditions and choices in the transitions to better optimise the profitability of the reverse logistics (When the treatment cost of a returned product is lower than the acquisition costs).
Reverse logistics is a double-edged sword. It could be a source of savings or a source of additional expense reducing the effectiveness of the company instead of supporting it.
It is for this reason that our model provides a preliminary model to represent and analyse the reverse logistics.
Finally, it would be interesting to extend our model to implement better condition on transition depending on the profitability of the operation on returned product. If the treatment reveals to be expensive, it would be more beneficial to dispose of the returned products and also take into consideration the potential of vehicles routing in the reverse supply chain and stock management.
References
Adenso-Díaz, B., Moreno, P., Gutiérrez, E., & Lozano, S. (2012). An analysis of the main factors affecting bullwhip in reverse supply chains. International Journal of production Economics, 135(2), 917-928.
http://dx.doi.org/10.1016/j.ijpe.2011.11.007
Ashayeri, J., Ma, N., & Sotirov, R. (2015). The redesign of a warranty distribution network with recovery processes. Transportation Research Part E: Logistics and Transportation Review, 77, 184-197.
http://dx.doi.org/10.1016/j.tre.2015.02.017
Bai, C., & Sarkis, J. (2013). Flexibility in Reverse Logistics: A Framework and Evaluation Approach.
Journal of Cleaner Production, 47, 306-318. http://dx.doi.org/10.1016/j.jclepro.2013.01.005
Beaulieu, M., Martin, R., & Landry, S. (1999). Reverse logistics: literature review and typology. Group of Sought. CHAIN notebook, 99-01, Montreal, Canada.
Bogataj, M., & Grubbström, R.W. (2013). Transportation delays in reverse logistics. International Journal of Production Economics, 143(2), 395-402. http://dx.doi.org/10.1016/j.ijpe.2011.12.007
Carrasco-Gallego, R., & Ponce-Cueto, E. (2009). Forecasting the returns in reusable containers’ closed-loop supply chains. A case in the LPG industry. In XIII Congreso de Ingeniería de Organización.
311-320.
Carter, C.R., & Ellram, L.M. (1998). Reverse Logistics: A review of the literature and framework for future investigation. Journal of Business Logistics- Council of Logistics Management, 198(1), 85-102.
Chouinard, M. (2005). Organizational and system architecture of an information support for the integration of reverse logistics in a rehabilitation centre. Paper presented at the Faculty of Graduate Studies at Laval University for obtaining the degree of Master of Science (M.Sc.)
Das, K., & Posinasetti, N.R. (2015). Addressing environmental concerns in closed loop supply chain design and planning. International Journal of Production Economics, 163, 34-47.
http://dx.doi.org/10.1016/j.ijpe.2015.02.012
Dolgui, A., Levin, G., & Louly, M. (2005). Decomposition approach for a problem of lot-sizing and sequencing under uncertainties. International Journal of Computer Integrated Manufacturing, 18(5), 376-385.
http://dx.doi.org/10.1080/09511920500081593
Dowlatshahi, S. (2000). Developing a theory of reverse logistics. Interfaces, 30(3), 143-155.
http://dx.doi.org/10.1287/inte.30.3.143.11670
Govindan, K., Jafarian, A., Khodaverdi, R., & Devika, K. (2014). Two-echelon multiple-vehicle location-routing problem with time windows for optimization of sustainable supply chain network of perishable food. International Journal of Production Economics, 152, 9-28.
http://dx.doi.org/10.1016/j.ijpe.2013.12.028
Guide, V., & Van Wassenhove, L., (2009). The Evolution of Closed-Loop Supply Chain Research.
Operations Research, 57(1), 10-18. http://dx.doi.org/10.1287/opre.1080.0628
He, Y. (2015). Acquisition pricing and remanufacturing decisions in a closed-loop supply chain.
International Journal of Production Economics, 163, 48-60. http://dx.doi.org/10.1016/j.ijpe.2015.02.002
Krikke, H. (2010). Opportunistic versus life-cycle-oriented decision making in multi-loop recovery: an eco-eco study on disposed vehicles. The International Journal of Life Cycle Assessment, 15(8), 757-768.
Lai, K.H., Wu, S.J., & Wong, C.W. (2013). Did Reverse Logistics Practices Hit the Triple Bottom Line of Chinese Manufacturers? International Journal of Production Economics, http://dx.doi.org/10.1016/j.ijpe.2013.03.005
Lambert, S., & Riopel, D. (2003) Reverse Logistics: a review of literature. Department of Mathematics and Industrial Engineering, Ecole Polytechnique de Montreal PO Box 6079, Station Centre-ville Montreal (Quebec) H3C 3A7, Canada
Langnau, L. (2001). A new shade of green for reverse logistics. Material Handling Management, 56(3), MHS2.
Mazhar, M.I., Kara, S., & Kaebernick, H. (2007). Remaining life estimation of used components in consumer products: life cycle data analysis by Weibull and artificial neural networks. Journal of operations management, 25(6), 1184-1193. http://dx.doi.org/10.1016/j.jom.2007.01.021
Mimouni, F., Abouabdellah, A., & Mharzi, H. (2014). Evaluation of performance on reverse logistics of a production line of a direct logistics. Logistics and Operations Management (GOL), 2014 International Conference.
Rabat, Morocco. 133-138. http://dx.doi.org/10.1109/GOL.2014.6887430
Mimouni, F., Abouabdellah, A., & Mharzi, H. (2015a). Study of the reverse logistics’ break-even in a direct supply chain. International Review on Modelling and Simulations (IREMOS), 8(2). ISSN: 1974-9821. Mimouni, F., Abouabdellah, A., & Mharzi, H. (2015b). Proposition of a mathematical model to
measure the minimal rates of return for a beneficial introduction of reverse logistics in a direct chain.
1st International Conference on Electrical and Information Technologies. Marrakech, Morocco. 198-204.
Pati, R.K., Vrat, P., & Kumar, P. (2010). Quantifying bullwhip effect in a closed loop supply chain.
Opsearch, 47(4), 231-253. http://dx.doi.org/10.1007/s12597-010-0024-z
Ramezani, M., Kimiagari, A.M., & Karimi, B. (2014). Closed-loop supply chain network design: A financial approach. Applied Mathematical Modelling, 38(15), 4099-4119.
Rogers, D.S. (2001). Ecommerce Reverse Logistics. University of Nevada, Reno, Reverse Logistics Executive Council.
Shevtshenko, E., & Wang, Y. (2009). Decision support under uncertainties based on robust Bayesian networks in reverse logistics management. International Journal of Computer Applications in Technology, 36(3), 247-258. http://dx.doi.org/10.1504/IJCAT.2009.028047
Tibben-Lembke, R.S. (2002). Life after death: reverse logistics and the product life cycle. International Journal of Physical Distribution & Logistics Management, 32(3), 223-244.
http://dx.doi.org/10.1108/09600030210426548
Turrisi, M., Bruccoleri, M., & Cannella, S. (2013). Impact of reverse logistics on supply chain performance. International Journal of Physical Distribution & Logistics Management, 43(7), 564-585.
http://dx.doi.org/10.1108/IJPDLM-04-2012-0132
Ye, F., Zhao, X., Prahinski, C., & Li, Y. (2013). The impact of institutional pressures, top managers’ posture and reverse logistics on performance—Evidence from China. International Journal of Production Economics, 143(1), 132–143. http://dx.doi.org/10.1016/j.ijpe.2012.12.021
Zhang, Y.M., Huang, G.H., & He, L. (2011). An inexact reverse logistics model for municipal solid waste management systems. Journal of Environmental Management, 92(3), 522-530.
http://dx.doi.org/10.1016/j.jenvman.2010.09.011
Journal of Industrial Engineering and Management, 2016 (www.jiem.org)
Article's contents are provided on an Attribution-Non Commercial 3.0 Creative commons license. Readers are allowed to copy, distribute and communicate article's contents, provided the author's and Journal of Industrial Engineering and Management's