178
Copyright © 2018. IJEMR. All Rights Reserved.
Volume-8, Issue-1 February 2018
International Journal of Engineering and Management Research
Page Number: 178-182
A Study on the Effect of Affluence on Solid Waste Generation in Kota
Dr. Shweta Mathur
Assistant Professor, Department of Occupational Therapy, Maharaj Vinayak Global University, VPO- Dhand, Tehsil- Amer, Jaipur- Delhi National Highway No. 11C, Jaipur, Rajasthan, INDIA
Corresponding Author: [email protected]
ABSTRACT
Waste is a part of the human condition of existence: the higher we soar above the basic level of survival, the greater and more diverse the rejects of civilized living. In areas with low population density waste generation may have been negligible. In higher population areas even largely biodegradable waste had to be dealt with.
Waste management and recycling of waste are rapidly achieving major importance for essentially these two reasons: to maintain an acceptable environment free from excessive pollution and to conserve even scarcer and costlier raw materials and energy. The explosive population growth combined with an increasing appetite for consumer goods, has led to an explosion in the amount of garbage we produce. Virtually every aspect of our daily lives generates waste, and it is impossible to think of any man-made process that does not create some waste. The aim of the present paper is to study the relation between the social affluence and the amount of solid waste generated.
The present study was carried out in Kota where the waste generation rates were compared for different income group colonies. It has been observed that quantity of waste generated in these colonies is influenced by the economic status of the people.
Keywords-- Biodegradable, Waste management, Recycling, Social affluence, Rubbish, Garbage, Refuse, Sustainable development, Landfill, Sewage, Waste generation
I.
INTRODUCTION
Throughout history, waste has been generated by humans. The spectrum ranges from refuse produced by all of us in our daily lives, to highly toxic industrial wastes from the production of specialized goods such as cars, electronics computers, cell phones and plastics. Sometimes this was released back into the ground water with environmental impact like Nor Loch.
The Maya of Central America had a fixed monthly ritual, in which the people of the village would gather together and burn their rubbish in large dumps.
Following the onset of industrialization and the sustained urban growth of large population centers in England, the buildup of waste in the cities caused a rapid deterioration in levels of sanitation and the general quality of urban life. The streets became choked with filth due to the lack of waste clearance regulations. Calls for the establishment of a municipal authority with waste removal powers were mooted as early as 1751 by Corbyn Morris in London, who proposed that "...as the preservation of the health of the people is of great importance, it is proposed that the cleaning of this city, should be put under one uniform public management, and all the filth be...conveyed by the Thames to proper distance in the country".
According to the Associated Chambers of Commerce and Industry (ASSOCHAM) predictions, "India will generate 130 million tonnes of e-waste by 2018 from the current 93.5 million tonnes in 2016. And by 2020, India is expected to generate 260 million tonnes of e-waste".
Waste management rules in India are based on the principles of "sustainable development", "precaution" and "polluter pays". These principles mandate municipalities
and commercial establishments to act in an
environmentally accountable and responsible manner— restoring balance, if their actions disrupt it. The increase in
waste generation as a by-product of economic
development has led to various subordinate legislations for regulating the manner of disposal and dealing with generated waste are made under the umbrella law of Environment Protection Act, 1986 (EPA).
179
Copyright © 2018. IJEMR. All Rights Reserved.
is treated and 31 MT is dumped in landfill sites. SolidWaste Management (SWM) is one among the basic essential services provided by municipal authorities in the country to keep urban centers clean. However, almost all municipal authorities deposit solid waste at a dump yard within or outside the city haphazardly. Experts believe that India is following a flawed system of waste disposal and management.
Around 100 cities are set to be developed as smart cities. Civic bodies have to redraw long term vision in solid waste management and rework their strategies as per changing lifestyles. They should reinvent garbage management in cities so that we can process waste and not landfill it.
Solid waste treatment has necessarily always been more advanced in larger cities like Kota. Disposal problems becomes difficult with increase of population density. Simultaneously there is a greater production of waste per unit area and a decreased proportion of land available for its disposal. Therefore, the history of solid waste management is largely connected with the histories of the larger cities.
II.
REVIEW OF LITERATURE
A.J. Muhich, A.J. Klee and P.W. Britton in 1968 published ―Preliminary Data Analysis‖ in their National Survey of Community Solid Waste Practices. Working for the same D.F. Bender, M.L. Peterson and H. Stierli (1973) published a book entitled, ―Physical, Chemical and Microbiological Methods of Solid Waste Testing‖ which described various methods for the analysis of solid waste. A.D. Bhide in 1975 published a book entitled, ―Studies of Refuse in Indian Cities‖, which described that with industrial progress, growing urban areas and resultant growth in urban solid waste is a relatively new phenomenon in contemporary India. During mid-seventies, the per capita solid waste generation ranged from 150-350 gms/day for various Indian cities; whereas in late eighties, it ranged from 320-530 gms/day.
A.D. Bhide and B.B. Sundaresan in 1983 published a book entitled, Solid Waste Management in Developing Countries‖. They stated that a primary survey in 1971 estimated that the urban population generated 374 gms/capita/day of solid waste. In another survey the quantity of wasteproduced has been found to vary from 200-600 gms/capita/day.
The Environmental Protection Training and Research Institute (EPTRI) estimates of the survey in 1995 for 23 Indian cities places the total municipal waste generation to around 11 million tonnes a year. The survey conducted by Central Pollution Control Board (CPCB) [2000(a)] puts total municipal waste generation from class-I and class-Iclass-I cities to around 18 million tonnes in 1997. This result has been published in ―Management of Municipal Solid Waste‖. It has also stated that the present annual
solid waste generated in Indian cities has increased from 6 millionstonnes in 1947 to 48 million tonnes in 2047. Solid waste management in India is an emerging and engaging area of study. However, the picture is often confusing and solutions fuzzyas information available in public domain is either scanty or scattered.
K.K. Singh (1996) in his publication, ―Potential for energy generation from waste in India‖ stated that the daily per capita sewage generation in India is about 150 liters. The amount of total sewage generated grew to 30 billion liters/day in 1997 from about 5 billion liters/day in 1947.
Shekdar (1999) in ―Municipal Solid Waste Management – the Indian Perspective‖ published that in India, the amount of waste generated per capita is estimated to increase at a rate of 1% - 1.33% annually. A study conducted by the Central Pollution Control Board in 2000(a) on management of the municipal solid waste in the country estimated that waste generation from the present 48 million tonnes is expected to increase to 300 million tonnes per year by the year 2047 (490 gms per capita to 945 gms per capita). The estimated requirement of land for disposal would be 169.6 sq km in 2047 as against 20.2 sq km in 1997.
In connection with much of the published data, the information is of only partial benefit to a designer or planner, since the national averages presented are applicable only very broadly to the entire nation; that is, to adequately design a solid waste management system for a particular locality comprehensive information about the solid waste in that locality must be obtained. An effort in this direction has been made in the present study.
III.
METHODOLOGY
To carry out work in this study entitled ―Effect of Affluence on Solid Waste Generation in Kota‖ six different colonies of Kota were selected for the sake of convenience and systematic study. The selected colonies belonged to three different groups on the basis of economic status of the people residing in particular region. The selected colonies were Kachchi Udiya Basti and Sanjay Nagar (belonging to low income group); Talwandi and Mahaveer Nagar (belonging to middle income group); Vallabh Nagar and Talwandi Posh (belonging to high income group).
180
Copyright © 2018. IJEMR. All Rights Reserved.
To study for the same all the six selected colonieswere visited every alternate day in the morning before the arrival of sweeper. Household waste of the fifty houses in each selected colony were collected and weighed. Data were collected for two years (September 2000 to August 2002) and were analyzed for the comparison of waste generation in different localities year wise (September 2000 – August 2001 and September 2001 – August 2002).
IV.
OBSERVATION AND RESULT
A comparison of waste generation in different housing localities from September 2000 – August 2001 and September 2001 – August 2002 is presented in TABLE 1 and TABLE 2 respectively.
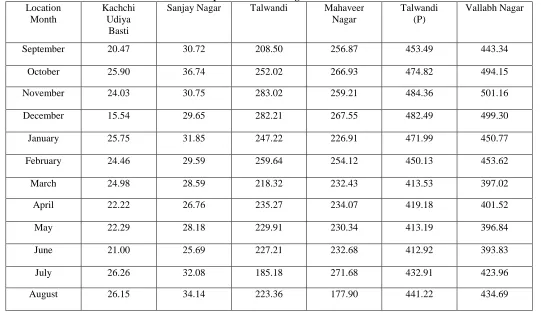
TABLE 1: Comparative waste generation in different housing localities September 2000 – August 2001
Location Month
Kachchi Udiya
Basti
Sanjay Nagar Talwandi Mahaveer
Nagar
Talwandi (P)
Vallabh Nagar
September 20.47 30.72 208.50 256.87 453.49 443.34
October 25.90 36.74 252.02 266.93 474.82 494.15
November 24.03 30.75 283.02 259.21 484.36 501.16
December 15.54 29.65 282.21 267.55 482.49 499.30
January 25.75 31.85 247.22 226.91 471.99 450.77
February 24.46 29.59 259.64 254.12 450.13 453.62
March 24.98 28.59 218.32 232.43 413.53 397.02
April 22.22 26.76 235.27 234.07 419.18 401.52
May 22.29 28.18 229.91 230.34 413.19 396.84
June 21.00 25.69 227.21 232.68 412.92 393.83
July 26.26 32.08 185.18 271.68 432.91 423.96
August 26.15 34.14 223.36 177.90 441.22 434.69
TABLE 2: Comparative waste generation in different housing Localities September 2001 – August 2002
Location Month
Kachchi Udiya
Basti
Sanjay Nagar Talwandi Mahaveer Nagar
Talwandi (P)
Valliabh Nagar
September 21.30 31.37 209.85 285.99 451.06 441.18
October 24.80 35.31 251.00 269.82 475.35 492.72
November 24.32 31.71 281.68 259.42 491.14 501.10
December 21.86 27.85 262.75 232.53 470.65 491.70
January 25.07 30.85 245.81 226.15 472.39 449.33
181
Copyright © 2018. IJEMR. All Rights Reserved.
March 22.65 26.50 220.01 224.11 417.31 406.60
April 21.76 25.64 215.95 221.42 413.29 403.91
May 22.28 23.91 221.06 219.23 389.58 423.81
June 20.22 24.02 223.47 229.87 409.53 394.50
July 27.65 34.38 189.45 267.06 437.24 429.45
August 30.56 34.50 194.35 270.65 441.11 434.36
It was interesting to note that in various locations poverty stricken people have less to waste whereas those coming from middle or upper-class families had enough to throw as waste (TABLE 3). Kachchi Udiya Basti and Sanjay Nagar had comparatively less waste (1177.50 and 1503.00 gms per day) which comes to just 5.08 and 4.68
gms per day per person and 23.55 and 30.06 gms waste per day per house respectively. The table clearly indicates 22269.00 gms waste per house in a posh colony, Talwandi (P) with 90.16 gms waste per day per person and 445.38 gms waste per day per house.
TABLE 3: Total and average waste (in gms) per day per person per house in various locations Location Total No. of person Total waste per day
( ingms)
Average waste per person per day
(in gms)
Average waste per house (In gms)
Kachchi Udiya Basti 232 1177.50 5.08 23.55
Sanjay Nagar 322 1503.50 4.68 30.06
Talwandi 254 11692.50 46.03 233.85
Mahaveer Nagar 245 12115.50 49.45 242.31
Talwandi (P) 247 22269.00 90.16 445.38
Vallabh Nagar 234 22111.00 94.49 442.22
V.
DISCUSSION
The disposal of waste was not a serious problem so long as population was small and the land available for the assimilation of the waste was large. However, the practice of dumping waste on roads, unpaved streets and vacant land in medieval towns served to swell the population of rodents and fleas associated with them functioned as carriers of germs.
Solid wastes are those by-products of a society that are discarded as useless or unwanted. The term is often used as a synonym for urban household waste but it is all inclusive and encompasses the heterogeneous mass of throwaways from the urban community as well as the
more homogeneous accumulations of agricultural,
industrial and mining waste. Though solid waste is a part of the broader part of urbanization directly linked to
economic growth, the difficulties associated with managing solid waste are perhaps most apparent because of their localized influence on the environment, especially on health, well-being and aesthetics. Not so apparent are the linkages between improper solid waste management and the pollution of air, water and soil which makes it difficult to quantify the environmental costs of solid waste. Statistical Analysis
The pooled analysis of waste collected per day per house from various locations of Kota during two years (September 2000 – August 2001 and September 2001 – August 2002) (TABLE 4) show that the mean daily waste collected is maximum in Talwandi (P) (445.39 gms). Statistically this value is at par with Vallabh Nagar. While the mean minimum waste is collected in Kachchi Udiya Basti (23.54 gms) which is statistically at par with Sanjay Nagar.
182
Copyright © 2018. IJEMR. All Rights Reserved.
TABLE 4: Location wise mean daily waste (in gms) per house YEARLOCATION
2000-2001 2001-2002 POOLED
Kachchi Udiya Basti 23.25 23.84 23.54
Sanjay Nagar 30.40 29.73 30.24
Talwandi 237.65 230.04 233.86
Mahaveer Nagar 242.58 242.05 242.28
Talwandi (P) 445.85 444.90 445.39
Vallabh Nagar 440.85 443.60 442.01
SEm± 5.97 5.61 5.37
CD at 5% 16.94 15.89 15.22
VI.
CONCLUSION & NEED FOR
ACTION
The information related to population of Kota shows the total number of people living in the city for a particular period of time. According to the census of 2001, the Kota population is 15, 68, 525 and the population density is 288 per sq. km.
Today Kota city is considered as a progressive industrial place of Rajasthan. Hence, people from various adjoining villages and cities are often found migrating to Kota in search of job opportunities. Since there are several industrial units in the city of Kota, people come with the hope of earning a handsome living for themselves. This leads to increase in the density of population in Kota.
To solve the problem of solid waste management in perspective, it is necessary to gather and present some basic data in regard to the amounts of solid waste which are generated in Kota. These data should be considered necessary for a variety of reasons. First, any future system for collection and disposal of this refuse will have to be geared to the total amount and quantity of the materials produced. Second, the overall management of the developed system for collection and disposal of the refuse will rely quite heavily on preliminary data concerning the quantities and character of that refuse.
Thus, without a comprehensive compilation of data on solid waste generation, it is impossible to fully appreciate the total problem of solid waste management
and also to forecast future needs for management in the area of service.
REFERENCES
[1] Velis, Costas A, David C. Wilson, & Christopher R.
Cheeseman. (2009 April). 19th century London dust-yards:
A case study in closed-loop resource efficiency. Waste
Management,29(4), 1282–1290.
[2] Bhide, A.D. (1975). Studies on refuse in indian cities, Part- II- variation in quality and quality. Indian Journal of
Environmental Health, 17(3), 215-225.
[3] Bhide A.D. & Muley V.U. (1973 Jan). Studies on pollution of ground water by solid wastes. Proc. Symp. on
'Environmental Pollution', CPHERI, Nagpur, 236-243.
[4] Danielson J.A. (1973 May). Air Pollution Engineering
Manual. (2nd ed.). EPA Office of Air & Water
Programmes. Office of Air Quality Planning & Standards, Research Triangle Park.
[5] Florence Nightingale. (1954). Selected Writings of
Florence Nightingale. New York: The Macmillan Co.,
38287.
[6] Singh N., Srivastava K.N., Krishnan R Singh N., Srivastava K.N., Krishnan R.M. & Nijhawan. (1954). Scope for utilisation of slag and related waste from indian iron & steel plants. Proc. Symp. on 'Utilisation of
Metallurgical Wastes', NML, Jamshedpur. 192-210.