ORIGINAL ARTICLE
Correlation between retinal function
and microstructural foveal changes
in intermediate age related macular
degeneration
Serena Fragiotta
*, Carmela Carnevale, Alessandro Cutini and Enzo Maria Vingolo
Abstract
Purpose: To assess foveal microstructural changes influencing retinal sensitivity (RS) and fixation stability using microperimeter MP-1 in intermediate age-related macular degeneration (AMD).
Methods: In this cross-sectional study, 22 eyes of 22 patients (mean age: 75 ± 9.02 years) with intermediate AMD were enrolled. Retinal sensitivity and bivariate contour ellipse area (BCEA) were obtained by microperimetry MP-1 (Humphrey 10-2 68-loci grid) under mesopic conditions. Drusen type, drusenoid pigment epithelial detachment, hyperreflective foci (HF), integrity of external limiting membrane (ELM), inner ellipsoid zone (ISel), RPE/Bruch’s mem-brane complex (RPE/B) and subfoveal choroidal thickness were analyzed in the foveal region and compared with RS and BCEA. Spearman’s rank correlation coefficient was used to evaluate the relationship between variables. Logistic regression analysis was also used to assess morphological predictor influencing RS or BCEA.
Results: RS was strongly and inversely related with the presence of HF (r =−0.66, P = 0.001), integrity of ELM (r =−0.70, P < 0.001), ellipsoid zone (r =−0.45, P = 0.03). Instead, BCEA is positively related to the ellipsoid zone integrity (r = 0.45, P = 0.03). Logistic regression analysis confirmed that disruption of ISel influenced fixation stability (ExpB: 9.69, P = 0.04) but not RS. Instead, the presence of HF and disruption of ELM predicted RS reduction (ExpB: 0.55, P = 0.02 and ExpB: 0.29, P = 0.04, respectively).
Conclusions: The integrity of ELM and the presence of HF are both predictors of RS. The ELM status may be con-sidered a new biomarker of retinal function together with HF. Instead, the integrity of ISel band seems to be a more selective predictor of BCEA than RS.
Keywords: Intermediate age related macular degeneration, Microperimetry, Bivariate contour ellipse area, Retinal sensitivity, Spectral domain optical coherence tomography
© The Author(s) 2017. This article is distributed under the terms of the Creative Commons Attribution 4.0 International License (http://creativecommons.org/licenses/by/4.0/), which permits unrestricted use, distribution, and reproduction in any medium, provided you give appropriate credit to the original author(s) and the source, provide a link to the Creative Commons license, and indicate if changes were made. The Creative Commons Public Domain Dedication waiver (http://creativecommons.org/ publicdomain/zero/1.0/) applies to the data made available in this article, unless otherwise stated.
Background
Large confluent drusen and macular hyperpigmentary changes in intermediate age-related macular degenera-tion (AMD) are well known risk factors for progression to geographic atrophy (GA) and choroidal neovasculari-zation (CNV) [1–3].
Spectral-domain optical coherence tomography (SD-OCT) allows a high definition cross-sectional visuali-zation of microstructural alterations providing a more accurate detection of biomarkers for AMD progression [4, 5]. Microstructural changes investigated in interme-diate AMD as possible biomarker of advanced disease included presence of hyperreflective foci (HF), inner-seg-ment ellipsoid zone integrity (ISel), drusen area, druse-noid pigment epithelial detachment (DPED), and retinal pigment epithelium (RPE) integrity [4–9].
Open Access
*Correspondence: [email protected]
Microperimetry has been considered a useful func-tional test in AMD even superior to convenfunc-tional visual acuity [10–13]. Some microstructural alterations have been related to retinal sensitivity (RS) decline even in intermediate AMD patients [14–16].
Fixation stability is a functional parameter directly related with both visual acuity and RS that allows a more accurate visual function evaluation. In fact, it has been reported that patients with advanced AMD have impaired fixation stability and this may contribute to their poor visual performance [17–19].
However, no study to date has examined the associa-tion between microstructural changes and fixaassocia-tion sta-bility in intermediate AMD. Accordingly, RS and fixation stability have never been included together in a statistical model to determine their respective morphological pre-dictors. Moreover, no other studies considered the rela-tion between the integrity of all three outer retinal bands (ELM, ISel, and RPE) and functional parameters. There-fore, the purpose of this study was to assess the influence of microstructural alterations by high-resolution SD-OCT imaging on RS and fixation stability.
Methods
In this cross-sectional study, 22 eyes of 22 patients (13 female and 9 male) aged 50 years or older with interme-diate AMD (mean age, 75 ± 9.02 years) were enrolled. The criteria for including intermediate AMD eyes were drusen 125 μm or larger, or drusen of 63 μm or larger but smaller than 125 μm and pigmentary abnormalities according to the Beckmann classification [20]. Institu-tional review board (IRB) permission was granted. All procedures adhered to the tenets of the Declaration of Helsinki. Each participant gave informed consent prior to enrollment in the study.
Exclusion criteria included the presence of any choroi-dal neovascularization or geographic atrophy, significant concomitant ocular pathologies such as media opacities, history of vitreoretinal surgery or laser therapy.
All patients underwent a complete ophthalmic exami-nation, including Snellen visual acuity testing, slit-lamp examination, fundus examination, retinography, SD-OCT, and fluorescein angiography and/or indocyanine green angiography as needed. Snellen acuity was con-verted into logarithm of the minimum angle of resolution for statistical analysis.
Imaging
All the SD-OCT scans were obtained using the Hei-delberg Spectralis SD-OCT (software version 5.4.7.0; Heidelberg Engineering). OCT volumes were acquired across a 20° × 15° (5.8 × 4.3 mm) rectangle centered on the fovea. Twenty-five line scans were acquired with
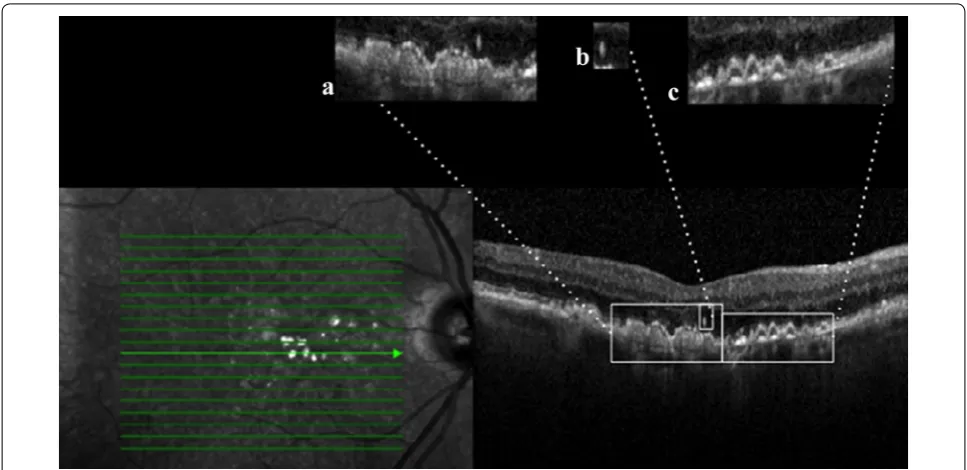
Automatic real time (ART) mode sets at 50 frames. Quality score with signal-to-noise 20 dB or above was obtained before scans acquisition. Central macular thick-ness (CMT) was measured automatically with OCT map-ping software. Enhanced depth imaging (EDI) mode was selected to improve visualization of the choroid. The fol-lowing parameters were collected: (I) types of drusen: (a) conventional (hard/soft); (b) reticular pseudodrusen; (II) Condition of (a) ELM; (b) ISel; (c) RPE; (III) presence/ absence of HF; (IV) presence/absence of DPED; (V) sub-foveal choroidal thickness (SCT). Figure 1 summarized SD-OCT phenotypes analyzed.
Drusenoid pigment epithelial detachment is defined following AREDS criteria as a well-defined, pale yellow or white, large mound consisting of many large drusen or confluent drusen that is at least 350 μm in the narrowest diameter [5]. SD-OCT anatomical landmarks according to IN*OCT consensus were pursued in order to distin-guish outer retinal layers. The innermost discrete hyper-reflective band at the outer border of the outer nuclear layer, and above the ellipsoid zone was considered as external limiting membrane; the hyperreflective band underneath the hyperreflective ELM and the hyporeflec-tive myoid zone was referred as ellipsoid zone; the out-ermost hyperreflective band was defined as RPE/Bruch’s complex [21]. The interdigitation zone (first hyper-reflective band above the RPE) was excluded by analy-sis because it is not always recognizable in the SD-OCT scans, even in healthy eyes [22, 23].
Microperimetry examination
Microperimetry was performed using the MP-1 microp-erimeter (NAVIS, software version 1.7.6; Nidek Technol-ogies, Japan). The examination was conducted by a single experienced examiner (CC) under mesopic condition and pupils were dilated with 1 drop each of tropicamide 1% and phenylephrine 2.5%. Each subject was instructed to maintain fixation on the central target and to press a push-button if any light stimulus was seen.
A red cross of 2° and 1 unit thickness (10 minarc) was used as a fixation target for both preliminary fixation test and microperimetry examination. MP was performed used white background illumination of 4 asb (1.27 cd/m2) and stimulus size Goldmann III, with a projection time of 200 ms. A 68-loci customized grid covering the cen-tral 20°, centered on the fovea was select as pattern. We used a 4-to-2-staircase strategy and the initial project-ing sensitivity was fixed at 16 dB. Patients underwent a brief training at the beginning of each MP and “Pre-test” option was selected. Spherical error was manually typed into the window before starting the examination.
described by Timberlake [24]. The BCEA encompassing 68% of fixation points (±1 standard deviation) was con-sidered for statistical analysis (see also Fig. 2).
Data analysis
It was evaluated microstructure of the central fovea × 1.39 mm2, consisting of 5 consecutive hori-zontal B-scans. Therefore resulting in an area of 0.97 × 1.43 mm2 centered over the fovea. Drusen type, DPED, HF, integrity of ELM, ISel, RPE and subfoveal CT
were analyzed in the foveal region and compared with RS and BCEA.
The condition of those bands was classified as ‘continu-ous’ whenever they were clearly detectable and without interruption. The bands were defined as ‘discontinuous’ if they appeared blurred and/or interrupted. Two expe-rienced ophthalmologists (SF, AC) independently inter-preted the SD-OCT scans masked to the other clinical findings; disagreement between readers was resolved by senior retinal specialist (EMV).
Fig. 1 Composition of the different SD-OCT phenotypes analyzed. A presence of drusenoid pigment epithelial detachment (DPED); B presence of hyperreflective foci (HF); C lack of integrity external limiting membrane (ELM), inner-segment ellipsoid band integrity (ISel), and retinal pigment epithelium (RPE)
Microperimetric software automatically calculates RS map and BCEA values, mean RS was obtained manually drawing a polygon enclosing all the RS points.
The normality of distributions was verified by Shapiro– Wilk normality test. BCEA (deg2) was normalized by log-arithmic transformation when necessary (Shapiro–Wilk test, P < 0.05). Spearman’s rank correlation coefficient was used to evaluate the relationship between variables. Binary logistic regression analysis was also used to assess morphological predictor influencing RS or BCEA. P value less than 0.05 were considered statistically signifi-cant, and P < 0.001 was considered to be highly statisti-cally significant. All calculations were carried out using the SPSS software (ver. 20; SPSS, Inc., Chicago, IL).
Results
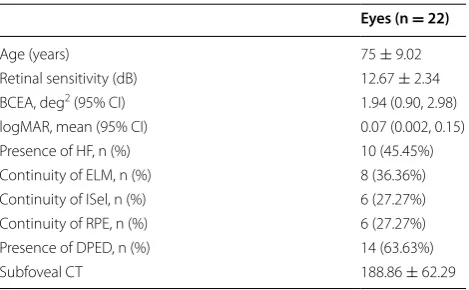
Main characteristics from the participants involved in our cross-sectional study are summarized in Table 1. Drusen sub-classification revealed soft drusen in 12 eyes (54.54%) reticular pseudodrusen in 9 eyes (40.91%), and cuticular drusen in 1 eye (4.54%).
LogMAR acuity was significantly correlated with RS (r = −0.50, P = 0.02). Moreover, a positive significant relationship was found with ellipsoid zone as well as RPE integrity (r = 0.49, P = 0.02 in both cases).
The RS was strongly and inversely related with the presence of HF (r = −0.66, P = 0.001) and integrity of ELM (r = −0.70, P < 0.001) but moderate correlated with ellipsoid zone integrity (r = −0.45, P = 0.03). Instead, BCEA is positively related to the ellipsoid zone integ-rity (r = 0.45, P = 0.03). No relationships were found between drusen type and RS (r = −0.33, P = 0.12) or BCEA (r = −0.17, P = 0.45).
Subfoveal CT was inversely related with drusen type (r = −0.44, P = 0.03), age (r = −0.50, P = 0.02) and ELM
integrity (r = −0.51, P = 0.01) but no with functional parameters. Moreover, the presence of HF was strongly related with ELM integrity (r = 0.83, P < 0.001), but also with ISel and RPE bands (r = 0.56, P < 0.001), and the presence of DPED (r = 0.45, P = 0.03).
Logistic regression analysis confirmed that disruption of ISel influenced fixation stability (ExpB: 9.69, P = 0.04) but not RS. Instead, the presence of HF and discontinuity of ELM predicted RS decrease (ExpB: 0.55, P = 0.02 and ExpB: 0.29, P = 0.04, respectively).
Discussion
In this study we compared microstructural changes with RS and fixation stability using microperimetry. Our find-ings are consistent with previous studies indicating that RS is strictly related to the integrity of ISel band and the presence of HF, but none of these observations have eval-uated the ELM [9, 14, 16, 25]. Interestingly, in our study, RS showed the strongest correlation with ELM discon-tinuity. Moreover, fixation stability analysis adds further interesting information, resulting affected by outer reti-nal bands integrity as well.
Larger drusen may become confluent and are often accompanied by disruption of the ellipsoid zone and ELM [6]. The status of ELM has been associated with visual acu-ity (VA), it was more highly related to VA than was the ellipsoid zone [26]. Not surprisingly, ELM status has been reported as a good indicator for visual prognosis in eyes with neovascular AMD, confirming that the ELM was directly correlated with final VA whereas ellipsoid zone did not [27, 28]. Interestingly, in our study the status of ELM was the strongest predictor of RS. Possibly this is because the integrity of the ELM has a critical role in restoration of the photoreceptor microstructure and alignment [29–31]. We also noted a direct relation between HF and ELM sta-tus; this may be related to the ability of RPE to migrate into outer nuclear layers. However a coordinate opening of ELM during RPE migration remains to be determined [32].
Although both BCEA and RS were significantly corre-lated with ellipsoid zone integrity; by combining micro-structural factors in a logistic regression model to predict BCEA and RS, the discontinuity of ISel band predicts BCEA enlargement but not the RS. These findings are partially in contrast with previous reports that consid-ered RS as the strongest predictor of ellipsoid zone integ-rity [14, 16, 25]. Such discrepancy can be easily explained by the fact that BCEA was never analyzed before in a similar model, thus it may serve as more selective bio-marker of photoreceptor damage than RS. Conversely in stages not involving photoreceptor band, RS is superior to BCEA in detecting functional dysfunction.
The BCEA is a quantitative functional parameters directly related with both visual acuity and RS that allows Table 1 Main characteristics of intermediate age-related
macular degeneration patients
All data are expressed as mean ± SD if not otherwise specified
BCEA bivariate contour ellipse area, logMAR logarithm of the minimum angle of resolution, CI confidence interval, HF hyperreflective foci, ELM external limiting membrane, ISel inner ellipsoid zone, RPE retinal pigment epithelium, DPED drusenoid pigment epithelial, CT choroidal thickness
Eyes (n = 22)
Age (years) 75 ± 9.02
Retinal sensitivity (dB) 12.67 ± 2.34 BCEA, deg2 (95% CI) 1.94 (0.90, 2.98)
logMAR, mean (95% CI) 0.07 (0.002, 0.15) Presence of HF, n (%) 10 (45.45%) Continuity of ELM, n (%) 8 (36.36%) Continuity of ISel, n (%) 6 (27.27%) Continuity of RPE, n (%) 6 (27.27%) Presence of DPED, n (%) 14 (63.63%)
a more accurate quantification in visual function, espe-cially reading speed [17, 19, 33]. It has been reported that BCEA decline progressively during geographic atrophy progression [34]. Moreover, patients with scotoma usu-ally develop a discrete of eccentric fixation called pre-ferred retinal locus (PRL) and also an increase in fixation stability area, contributing to a poor visual performance [17–19, 33]. Accordingly, we may speculate that fixation stability may be early affected in AMD even if a signifi-cant scotoma is not detected.
In summary, this study confirms that AMD can for-merly cause visual dysfunction in the intermediate stages. Further, our findings provide additional morpho-func-tional information that deserves further investigations. ELM band status is strongly associated with RS and it may represent a new predictive factor of retinal func-tion together with previously known hyperreflective foci. Moreover, BCEA seems to be a selective biomarker of photoreceptor damage greater than RS.
Various limitations of this study must be considered. First, our study included a small sample size. Second, morphological analysis is limited to the foveal region and it does not provide any point-to-point correlation. Despite these limitations, our goal was to understand which morphological factors influence RS but especially fixation stability that is essentially a foveal function. Fur-ther studies will be needed to understand if functional damage may be an early predictor of neovascular conver-sion. It may help to identify high-risk patients who may benefit of early therapeutic and rehabilitative strategies.
Authors’ contributions
All the authors contributed significantly to this research. SF designed the study, participated in data acquisition, performed statistical analysis of data and drafted the manuscript. EMV contributed to the design, clinical analysis and interpretation, coordination and the revision of the manuscript. AC and CC performed data collection and gathering and drafted the manuscript. All authors read and approved the final manuscript.
Acknowledgements None.
Competing interests
The authors declare that they have no competing interests.
Availability of data and materials
The dataset supporting the conclusion of this article is included within the Additional file 1 of the article.
Consent to participate
Included patients gave their written informed consent. Additional file
Additional file 1. Study dataset.
Consent to publication
This study does not contain any individual patients’ data in any forms. Thus, consent for publication was not needed.
Ethics approval
This cross-sectional clinical study was conducted at the Department of Medical-Surgical Sciences and Biotechnologies and it was approved by the Institutional Review Board (IRB). It adhered to the tenets of the declaration of Helsinki.
Received: 11 December 2016 Accepted: 21 February 2017
References
1. Klein ML, Ferris FL, Armstrong J, Hwang TS, Chew EY, Bressler SB, et al. Retinal precursors and the development of geographic atrophy in age-related macular degeneration. Ophthalmology. 2008;115:1026–31. 2. Group A-REDSR. A randomized, placebo-controlled, clinical trial of
high-dose supplementation with vitamins C and E, beta carotene, and zinc for age-related macular degeneration and vision loss: AREDS report no. 8. Arch Ophthalmol. 2001;119:1417–36.
3. Davis MD, Gangnon RE, Lee LY, Hubbard LD, Klein BE, Klein R, et al. The age-related eye disease study severity scale for age-related macular degeneration: AREDS report no. 17. Arch Ophthalmol. 2005;123:1484–98.
4. Christenbury JG, Folgar FA, O’Connell RV, Chiu SJ, Farsiu S, Toth CA. Age-related eye disease study 2 ancillary spectral domain optical coherence tomography study group. Progression of intermediate age-related macular degeneration with proliferation and inner retinal migration of hyperreflective foci. Ophthalmology. 2013;120:1038–45.
5. Cukras C, Agrón E, Klein ML, Ferris FL, Chew EY, Gensler G, et al. Natural history of drusenoid pigment epithelial detachment in age-related macular degeneration: age-related eye disease study report no. 28. Ophthalmology. 2010;117:489–99.
6. Schuman SG, Koreishi AF, Farsiu S, Jung SH, Izatt JA, Toth CA. Photo-receptor layer thinning over drusen in eyes with age-related macular degeneration imaged in vivo with spectral-domain optical coherence tomography. Ophthalmology. 2009;116:488–96.
7. Ouyang Y, Heussen FM, Hariri A, Keane PA, Sadda SR. Optical coherence tomography-based observation of the natural history of drusenoid lesion in eyes with dry age-related macular degeneration. Ophthalmology. 2013;120:2656–65.
8. de Sisternes L, Simon N, Tibshirani R, Leng T, Rubin DL. Quantitative SD-OCT imaging biomarkers as indicators of age-related macular degenera-tion progression. Invest Ophthalmol Vis Sci. 2014;55:7093–103. 9. Landa G, Su E, Garcia PM, Seiple WH, Rosen RB. Inner segment-outer
segment junctional layer integrity and corresponding retinal sensitiv-ity in dry and wet forms of age-related macular degeneration. Retina. 2011;31:364–70.
10. Midena E, Radin PP, Pilotto E, Ghirlando A, Convento E, Varano M. Fixa-tion pattern and macular sensitivity in eyes with subfoveal choroidal neovascularization secondary to age-related macular degeneration: a microperimetry study. Semin Ophthalmol. 2004;19:55–61.
11. Querques L, Querques G, Forte R, Souied EH. Microperimetric correlations of autofluorescence and optical coherence tomography imaging in dry age-related macular degeneration. Am J Ophthalmol. 2012;153:1110–5. 12. Wu Z, Ayton LN, Guymer RH, Luu CD. Low-luminance visual acuity and
microperimetry in age-related macular degeneration. Ophthalmology. 2014;121:1612–9.
13. Tran BK, Herbort CP. Discrepancy between visual acuity and microperim-etry in amd patients: visual acuity appears as an inadequate parameter to test macular function. Klin Monbl Augenheilkd. 2015;232:529–32. 14. Wu Z, Ayton LN, Luu CD, Guymer RH. Relationship between retinal
• We accept pre-submission inquiries
• Our selector tool helps you to find the most relevant journal
• We provide round the clock customer support
• Convenient online submission
• Thorough peer review
• Inclusion in PubMed and all major indexing services
• Maximum visibility for your research
Submit your manuscript at www.biomedcentral.com/submit
Submit your next manuscript to BioMed Central
and we will help you at every step:
16. Hartmann KI, Bartsch DU, Cheng L, Kim JS, Gomez ML, Klein H, et al. Scan-ning laser ophthalmoscope imaging stabilized microperimetry in dry age-related macular degeneration. Retina. 2011;31:1323–31.
17. Tarita-Nistor L, González EG, Markowitz SN, Steinbach MJ. Fixation charac-teristics of patients with macular degeneration recorded with the mp-1 microperimeter. Retina. 2008;28:125–33.
18. Tarita-Nistor L, González EG, Mandelcorn MS, Lillakas L, Steinbach MJ. Fixation stability, fixation location, and visual acuity after successful macular hole surgery. Invest Ophthalmol Vis Sci. 2009;50:84–9. 19. Grenga PL, Fragiotta S, Meduri A, Lupo S, Marenco M, Vingolo EM.
Fixa-tion stability measurements in patients with neovascular age-related macular degeneration treated with ranibizumab. Can J Ophthalmol. 2013;48:394–9.
20. Ferris FL, Wilkinson CP, Bird A, Chakravarthy U, Chew E, Csaky K, et al. Committee BIfMRC. Clinical classification of age-related macular degen-eration. Ophthalmology. 2013;120:844–51.
21. Staurenghi G, Sadda S, Chakravarthy U, Spaide RF. Panel INfOCTIO. Proposed lexicon for anatomic landmarks in normal posterior segment spectral-domain optical coherence tomography: the INOCT consensus. Ophthalmology. 2014;121:1572–8.
22. Fleckenstein M, Charbel Issa P, Helb HM, Schmitz-Valckenberg S, Finger RP, Scholl HP, et al. High-resolution spectral domain-OCT imaging in geographic atrophy associated with age-related macular degeneration. Invest Ophthalmol Vis Sci. 2008;49:4137–44.
23. Pircher M, Götzinger E, Findl O, Michels S, Geitzenauer W, Leydolt C, et al. Human macula investigated in vivo with polarization-sensitive optical coherence tomography. Invest Ophthalmol Vis Sci. 2006;47:5487–94. 24. Timberlake GT, Sharma MK, Grose SA, Gobert DV, Gauch JM, Maino JH.
Retinal location of the preferred retinal locus relative to the fovea in scan-ning laser ophthalmoscope images. Optom Vis Sci. 2005;82:177–85. 25. Acton JH, Smith RT, Hood DC, Greenstein VC. Relationship between retinal layer thickness and the visual field in early age-related macular degeneration. Invest Ophthalmol Vis Sci. 2012;53:7618–24.
26. Oishi A, Hata M, Shimozono M, Mandai M, Nishida A, Kurimoto Y. The significance of external limiting membrane status for visual acuity in age-related macular degeneration. Am J Ophthalmol. 2010;150(27–32):e21. 27. Roberts P, Mittermueller TJ, Montuoro A, Sulzbacher F, Munk M, Sacu S, et al. A quantitative approach to identify morphological features relevant for visual function in ranibizumab therapy of neovascular AMD. Invest Ophthalmol Vis Sci. 2014;55:6623–30.
28. Coscas F, Coscas G, Lupidi M, Dirani A, Srour M, Semoun O, et al. Restora-tion of outer retinal layers after aflibercept therapy in exudative AMD: prognostic value. Invest Ophthalmol Vis Sci. 2015;56:4129–34.
29. Abràmoff MD, Garvin MK, Sonka M. Retinal imaging and image analysis. IEEE Trans Med Imaging. 2010;3:169–208.
30. Wakabayashi T, Oshima Y, Fujimoto H, Murakami Y, Sakaguchi H, Kusaka S, et al. Foveal microstructure and visual acuity after retinal detachment repair: imaging analysis by Fourier-domain optical coherence tomogra-phy. Ophthalmology. 2009;116:519–28.
31. Theodossiadis PG, Grigoropoulos VG, Theodossiadis GP. The significance of the external limiting membrane in the recovery of photoreceptor layer after successful macular hole closure: a study by spectral domain optical coherence tomography. Ophthalmologica. 2011;225:176–84.
32. Zanzottera EC, Messinger JD, Ach T, Smith RT, Freund KB, Curcio CA. The project MACULA retinal pigment epithelium grading system for histology and optical coherence tomography in age-related macular degeneration. Invest Ophthalmol Vis Sci. 2015;56:3253–68.
33. Crossland MD, Culham LE, Kabanarou SA, Rubin GS. Preferred retinal locus development in patients with macular disease. Ophthalmology. 2005;112:1579–85.