R E S E A R C H
Open Access
Rock-water interaction processes based on
geochemical modeling and remote sensing
applications in hyper-arid environment:
cases from the southeastern region of
Egypt
Mohamed Yousif
1*and Abdel Hameed M. El-Aassar
2Abstract
Background:The interaction between rocks and groundwater can be considered as multi-faceted processes in hydrogeology where the groundwater chemistry can be resulted from leaching and/or minerals dissolution. The scientific approach of this study based on testing the contribution of remote sensing in providing information related to rock-groundwater interaction along with the outputs of the geochemical model. The current research aims to explore the impacts of lithologic nature and structural geology on the groundwater chemistry. The mentioned objective is significant for the future sustainable development of groundwater in hyper-arid regions. Therefore, both geology and geochemistry of water-bearing formations along the flow path to the studied aquifers were identified. The area was chosen as an example from hyper-arid region to carry out this scientific approach.
Results:The obtained results indicate the existence of three main aquifers: Quaternary alluvial (salinity 1253 mg/l to 18,854 mg/l), Nubian Sandstone (salinity 311 mg/l to 14,388 mg/l), and fractured basement (salinity 320 mg/l to 19,375 mg/ l). The results of speciation modeling showed that studied aquifers are supersaturated with gibbsite, goethite, hematite, magnetite, aragonite, calcite, dolomite, and alunite. Nubian aquifer specifically has homogeneity results due to the similarity of water-bearing and geology of watersheds (ferruginous sandstone and ironstone). Remote sensing data and digital elevation model analyses were used for generation of the thematic layers which is affecting the groundwater occurrences and quality such as geology, geomorphology, structural lineaments, slope, flow direction, drainage lines, and elevations. Conclusions:The current research concluded that the groundwater chemistry can be a signature of the rock-water interaction. The potential implications of the research are represented through a priority map for groundwater exploration for both hydro-geophysical investigation and testing wells in order to evaluate the groundwater capabilities where the data from the recorded wells were used to calibrate this map.
Keywords:Rock-water interaction, Hydro-geochemistry, Groundwater, Geology, Remote sensing, GIS
* Correspondence:[email protected]
1Geology Department, Desert Research Centre, P.O. Box 11753, El Matariya, Cairo, Egypt
Full list of author information is available at the end of the article
Bulletin of the National
Research Centre
© The Author(s). 2018Open AccessThis article is distributed under the terms of the Creative Commons Attribution 4.0 International License (http://creativecommons.org/licenses/by/4.0/), which permits unrestricted use, distribution, and reproduction in any medium, provided you give appropriate credit to the original author(s) and the source, provide a link to the Creative Commons license, and indicate if changes were made.
Background
Water scarcity in the hyper-arid region, such as the south-eastern Egypt, represents the main challenge to the hydro-geologists where they should work to evaluate and protect any source of water. The deficiency of water re-sources in these hyper-arid regions could affect different ac-tivities (including economics and humans); therefore, numerous efforts are essential to avoid any of the expected disasters and conflicts which might occur as a result of
lim-ited water resources (Gheith and Sultan 2002). The
decision-makers in Egypt have an important challenge to manage water resource for sustainable development (Ahmed and Abdelmohsen2018).In this regard, the consid-eration of the processes which affect groundwater and its chemistry through rocks interactions becomes critical and necessary. Water lack is the main problem affecting the sustainable development plans in the southeastern region of Egypt where the water delivered to the Red Sea Gover-norate is either from the Nile River through pipes or
de-pending on seawater desalinization (Abdel Moneim2005).
The precipitation is negligible over the South Eastern Des-ert without any source of recharge (e.g., Lake Nasser and Northern Sudan Platform) (Ahmed and Abdelmohsen
2018). Accordingly, groundwater is considered as an alter-native solution to face these problems, and therefore, the area attracted many authors such as Abdel Moneim (2005), Yousef et al. (2009), Shawky et al. (2012), Soussa et al. (2012), and Khalil (2014) to investigate geology and water resources. The groundwater contains different types of minerals carried in solution where the types and concentra-tion of these minerals are mainly condiconcentra-tional on multi-factors such as rocks chemistry, surface and ground-water interactions, the geologic setting of the preferred pathways for groundwater flow, and any other sources for water pollution. The groundwater chemistry represents the final product of the interaction between water and rocks belonging to different geological times. These interpret why groundwater contains varieties of many dissolved chemical constituents with different types and concentrations. The main objective of the current research is to explore the im-pacts of lithologic nature and structural geology on the groundwater chemistry. The mentioned objective is signifi-cant for the future sustainable development of groundwater in hyper-arid regions. In this context, the research has been carried out to investigate the processes resulted from the interaction between different rocks and groundwater. In this manuscript, rock terms are expressing about two types of meaning: the water-bearing formation and the rocks which formed the watersheds that affect the groundwater. The presented scientific approach of this study is based on exploring the integration of remote sensing and satellite ap-plications in providing spatial information related to rock-water interaction processes along with the outputs and results of the geochemical model.
Site descriptions
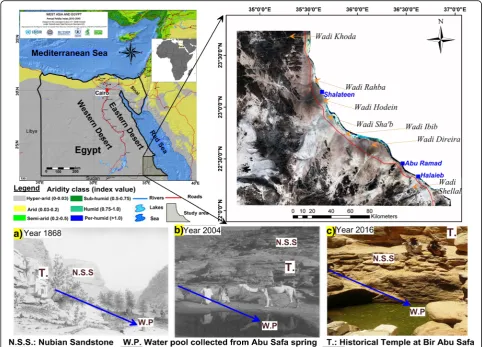
The study area is falling in the hyper-arid zone of Egypt
according to the aridity index map (ICARDA 2010)
which reveals the shortage of water resources supplied to this area. This is compatible with Gravity Recovery and Climate Experiment (GRACE) data which proved high groundwater depletion rates over the southern
parts of Egypt and Libya (Mohamed et al. 2017). The
southeastern region of Egypt represents one of the promising regions which is not subjected to intensive development projects yet due to the scarcity of water or inability to use. The area under investigation covers
about 22,000 km2and is located along the Red Sea coast
as a part of the Eastern Desert of Egypt (Fig. 1). The
study area lies between latitude 22° N and 23° 40′N and
longitude 34° 50′E and 37° E. The temperature reaches
its maximum in the summer and ranges between 45 and 50 °C (Ageeb et al.2007). The rainfall plays an important role as it is considered the main source for the aquifer recharge. The average annual rainfall ranges from 3 to
50 mm/year (Embaby et al.2016), while relative
humid-ity ranges between 28 and 52% (Hassanein et al.2004).
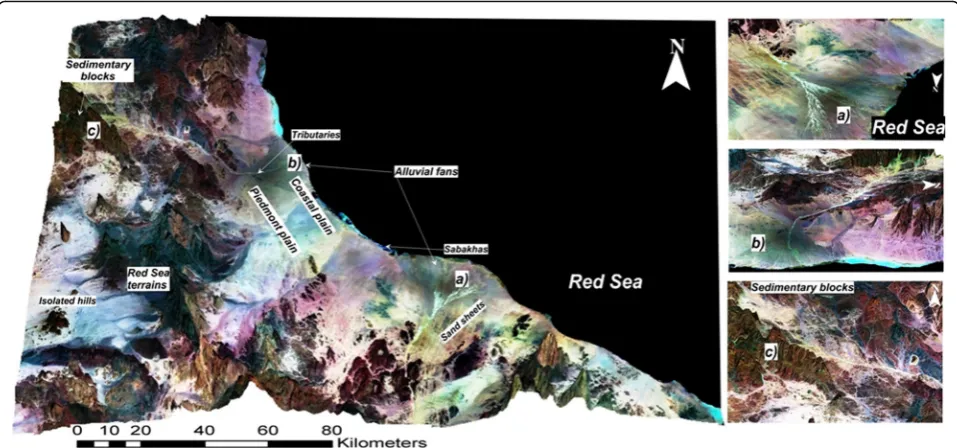
Geomorphology
The study area can be classified into the following geo-morphic unit, as shown in (Fig.2):
– Coastal plain—it extends westward of the Red Sea shoreline for a distance ranging from 5 to 25 km. The plain is covered by sand sheets, alluvial, and deltaic deposits. Along the shoreline, the plain is characterized by the presence of sabkha patches. It is partly covered by bushes and scrubs.
– Red Sea terrains—it borders the coastal plain and partly the Piedmont Plain. The Red Sea terrains are covered by the mountains oriented in a northwest-southeast direction parallel to the Red Sea shoreline. The elevation is variable from 388 to 1419 m above sea level. The slope ranges from15 to 30 m/km due east.
– Isolated hills—few isolated hills are spreading over the study area, such as Gabal Umm Rasin and Gebel Elba. These hills are composed mainly of
Precambrian basement rocks of different types.
– Sedimentary blocks—these blocks are located in a limited area in the west side where it is composed of Cretaceous rocks belonging to Nubian Sandstone.
– Wadies and alluvial fans—the area under consideration is dissected by about nine main wadies which drain their surface water to the Red Sea eastwards. Most of these wadies are of small areas and short lengths.
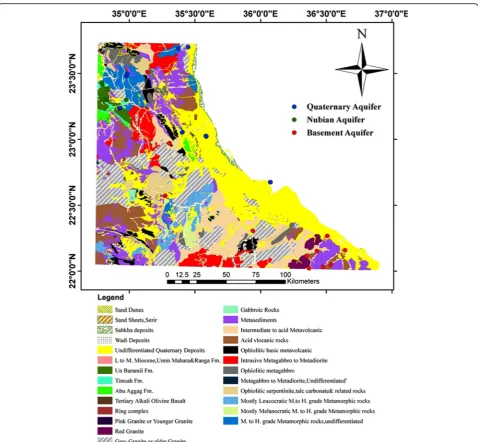
Geology of the study area
To the west of the coastal zone, the area is covered com-pletely (except the area of sedimentary blocks) by base-ment rocks, which consist mainly of granites, gneisses, schists, and quartzite of Precambrian age (Fig. 3). These basement rocks are overlain non-conformably by about 430 m of thick sandstone succession of Nubian facies (Elewa (2000). The sandstones consist of three formations, namely Abu-Agag, Timsah, and Umm Barmeil formations at the top. Towards the southwest, the sandstone in general dips due east and southeast. Isolated patches of Miocene sediments are located as rare exposures which consist mainly of alternating limestone and marl. Quater-nary sediments comprising wadi fills and alluvial wadi de-posits cover a vast area. Most of the wadies are filled with
alluvial deposits with a thickness that varies between few meters and about 20 m. Generally, the thickness increases from west to east. Numerous traverse faults have NW-SE and E-W direction. On the other hand, a small group of minor faults exists in a NE-SW direction.
Methods Fieldwork
During fieldwork, the geomorphologic and geologic set-tings of the study area were determined. Thirty sites of the study area were investigated in detail with regard to geology where the surface outcrops were identified. A total of 75 rock samples from different geological units were collected and described. The field data were used for an area-wide interpretation based on Landsat
satel-lite images and geologic map (Conoco 1987). Also, a
field trip was achieved during the summer of 2016. Though this fieldwork, the groundwater samples have been collected (37 groundwater samples representing three aquifers). The site locations have been acquired
using Global Positing System (GPS), while other mea-surements including reduction potential (redox poten-tial, oxidation/reduction potenpoten-tial, “Eh”), the hydrogen ion concentration (pH), and the electrical conductivity (EC) were achieved in situ. Also, the hydrological data including depth to water table, total well depth, and water-bearing formations, as well as corresponding geo-morphologic units, were also determined. The main fac-tors which affect the groundwater quality and occurring were elucidated in the site where each water sample has a special case which subjected to investigation.
Chemical analyses
The total of 37 groundwater samples was analyzed at the water analysis unit of the central laboratory of Desert Research Center (DRC, Cairo, Egypt) according to
ASTM 2002. The chemical analyses of the collected
water samples included the determination of EC, total dissolved salts (TDS), pH, and concentrations of major cations (Na+, K+, Mg2+, Ca2+) and major anions (Cl−,
SO42−, CO32−, HCO3−) by ion chromatography
(ICS-1100, Dionex, Sunnyvale, CA, USA). Also, the trace element (Al, B, Cd, Co, Cr, Cu, Fe, Mn, Mo, Ni, Pb, Ti, Sr, P, V, and Zn) concentrations of the water samples were determined using inductively coupled argon plasma (ICAP, Thermo 6500).
Geochemical modeling and rocks geochemistry
The obtained chemical analyses which included the con-centrations of both major and trace elements are
repressing the input data for the geochemical modeling
of the PHREEQC code (Parkhurst and Appelo 1999;
USGS). The PHREEQC code is used to calculate the sat-uration indices (SI) for minerals of interest, where this index determines whether a solution has a thermo-dynamic potential for further dissolution or precipitation of a mineral. The saturation indices (SI) of the relevant mineral are determined through the equation SI = log (IAP/KT), where IAP is the ion activity products and KT is the solubility product of a mineral for a given temperature. The other parameters such as Eh and pH were also included in the database before the model run-ning. The outputs of the model were tabulated where we focused on the minerals that saturated the studied ground-water. On the other hand, the geochemistry of the water-bearing formation and watersheds in the study area were obtained from different sources which include the works of Hassan (2015), Abd El-Naby and Frisch (2006), Khalil (1997), Farouk et al. (2015), and Shahin et al. (2016).
GIS and remote sensing
The digital elevation model (DEM) of the Shuttle Radar Topography Mission (SRTM-C) and the Enhanced The-matic Mapper Plus (ETM+) images were used to obtain data for the current research. The obtained data from the satellite images was employed for the visual inter-pretation of surface features and geology as well as the structural lineaments. All DEM data and satellite images were projected to the Universal Transverse Mercator (UTM) with the WGS84 datum. After processing of SRTM-C data by constructing a mosaic to extract the
watersheds, the hydrology tools of ESRI Arc GIS v.10.4 were used to identify and fill all sinks in the resulting mosaic. Many GIS data layers were obtained through the analyses of DEM including watersheds, slope, flow direc-tion, drainage networks, elevadirec-tion, and aspect as well as the three-dimensional layer (3D) to illustrate the main landforms as well as geological and geomorphological units. Landsat GeoCover ETM+ (2000) with a spatial resolution of 14.5 m (band combination 742) was used
with the geological map of (Conoco1987) to determine
the geology of the study area. Structural lineaments were extracted through band combination (741 and 754 of the ETM+) where the edge detection filtering in ERDAS IMAGIN 9.3 depends on the variation of digital pixel
values. The geological map was also used to elucidate the lineaments structures (faults and/or fractures).
Results
Results are presented according to the before-mentioned workflow.
Groundwater occurrences
In the current study, three aquifers were chosen to be subjected for investigation where they are providing
some suitable groundwater (Table1). These aquifers are
from young to old as follows:
Fig. 3Geologic map of the study area, Conoco map (1987), showing the locations of the wells from the three studied aquifers
Quaternary aquifer
The aquifer is composed of sands, mudstone, and differ-ent sizes of gravels (granules, pebbles, and boulders) de-rived from the basement rocks especially that located along the surface water path and in the vicinities of the wells (Fig. 4). This aquifer is mainly recharged from the
occasional runoff water of the intermittent streams; its deposits belong to the Pleistocene and the recent. This aquifer is covering most of the wadi floor with alluvial deposits, which can be subdivided into two groups:
The first group is the wadi fillings in the depressions over alluvial fans and along alluvial courses. These sediments
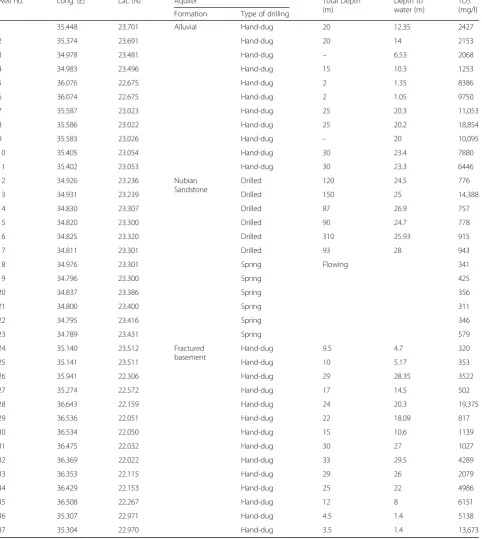
Table 1Hydrogeological data of the wells tapping the studied aquifers
Well no. Long. (E) Lat. (N) Aquifer Total Depth
(m)
Depth to water (m)
TDS (mg/l) Formation Type of drilling
1 35.448 23.701 Alluvial Hand-dug 20 12.35 2427
2 35.374 23.691 Hand-dug 20 14 2153
3 34.978 23.481 Hand-dug – 6.53 2068
4 34.983 23.496 Hand-dug 15 10.3 1253
5 36.076 22.675 Hand-dug 2 1.35 8386
6 36.074 22.675 Hand-dug 2 1.05 9750
7 35.587 23.023 Hand-dug 25 20.3 11,053
8 35.586 23.022 Hand-dug 25 20.2 18,854
9 35.583 23.026 Hand-dug – 20 10,095
10 35.405 23.054 Hand-dug 30 23.4 7880
11 35.402 23.053 Hand-dug 30 23.3 6446
12 34.926 23.236 Nubian
Sandstone
Drilled 120 24.5 776
13 34.931 23.239 Drilled 150 25 14,388
14 34.830 23.307 Drilled 87 26.9 757
15 34.820 23.300 Drilled 90 24.7 778
16 34.825 23.320 Drilled 310 25.93 915
17 34.811 23.301 Drilled 93 28 943
18 34.976 23.301 Spring Flowing 341
19 34.796 23.300 Spring 425
20 34.837 23.386 Spring 356
21 34.800 23.400 Spring 311
22 34.795 23.416 Spring 346
23 34.789 23.431 Spring 579
24 35.140 23.512 Fractured
basement
Hand-dug 9.5 4.7 320
25 35.141 23.511 Hand-dug 10 5.17 353
26 35.941 22.306 Hand-dug 29 28.35 3522
27 35.274 22.572 Hand-dug 17 14.5 502
28 36.643 22.159 Hand-dug 24 20.3 19,375
29 36.536 22.051 Hand-dug 22 18.09 817
30 36.534 22.050 Hand-dug 15 10.6 1139
31 36.475 22.032 Hand-dug 30 27 1027
32 36.369 22.022 Hand-dug 33 29.5 4289
33 36.353 22.115 Hand-dug 29 26 2079
34 36.429 22.153 Hand-dug 25 22 4986
35 36.508 22.267 Hand-dug 12 8 6151
36 35.307 22.971 Hand-dug 4.5 1.4 5138
have a variable thickness which occurred overlie sediment-ary and basement rocks. The second group is coral and beach sand deposits where the alluvial sediments are of special hydrogeologic significance. It is covered by sand all over the area and sometimes by silt and gravel. The Qua-ternary aquifer is explored through 11 wells where the total depth ranges from 2 to 30 m, and the depth to water is varying between 1.05 and 23.4 m (Table1).
Nubian Sandstone Aquifer of Upper Cretaceous ages
The Nubian Sandstone Aquifer occupies mostly an area of Wadi Hodein Basin; in such rocks, faults and slight folding were associated with the Red Sea Rifting blocks. These blocks act as independent aquifers, which flowing naturally in the form of springs (six springs) with the
discharge rates up to 21 m3/h. Most of the groundwater
of the Nubian Sandstone is slightly fresh. The aquifer consists of sandstone which is fine to coarse-grained
with clay and siltstone intercalation (Fig. 5). On the
other hand, six wells were drilled penetrating the Nubian Sandstone Aquifer up to 310 m, while the depth to water ranges between 24.5 and 28 m. The hydrologic pa-rameters of this aquifer were deduced from pumping
tests carried out by Elewa (2000). He stated that the
transmissivity ranges from 2.72 to 72.4 m2/day, and the recharge processes are mainly due to the direct infiltra-tion from rainfall and partly from surface runoff through the fractured sandstone. This is confirmed through con-tinuous discharge from the springs (since 1868).
Fractured basement rock of Precambrian age
This aquifer comprises the fractured Precambrian base-ment which represents a part of the Red Sea mountainous area. These rocks include granites (old and young), grani-toides, gneisses, migmatites, schists, metasediments, dio-rites, and quartzites. These rocks are characterized by high and dense fractures, and faults intersecting with each other facilitate the recharge process. This structural set-ting provides chances for groundwater to be accumulated and moved through the fracture systems. The occurrence of groundwater depends mainly upon the depth, width, and extension of fractures, where the water quantity is fre-quently limited but provides a water supply for the local population. The aquifer is penetrated through 14 hand-dug wells (Fig.6) where the total depth ranges tween 3.5 and 33 m while the depth to water varies be-tween 1.4 and 29.5 m (Table1).
Fig. 4Wells location map of alluvial Quaternary aquifer illustrated on Landsat images (GeoCover ETM+ 2010).a–dThe geology along the flow path which affected the groundwater wells
Chemistry of groundwater
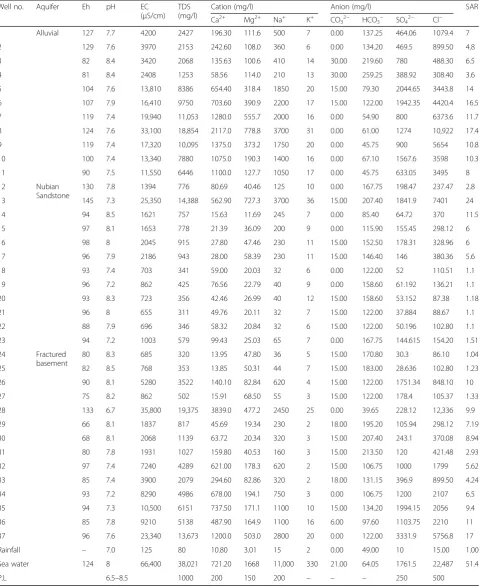
The data of analyses of the groundwater wells are shown
both in Tables2 and 3. The groundwater salinity in the
study area ranged from fresh to brackish and saline. The lowest total dissolved salt (TDS) value (311 mg/l) was recorded in well no. 21 of the Nubian Sandstone Aqui-fer, while the highest value was obtained from well no. 28 of the fractured basement aquifer. The alluvial aquifer showed variation in the salinity values that ranged be-tween 1253 and 18,854 mg/l. The majority of ground-water samples of this aquifer have one order of ion dominance: Na > Ca > Mg with Cl > SO4> HCO3. The
analyses of groundwater belonging to the Nubian Sand-stone Aquifer reveal relative symmetry in their chemical composition. All groundwater samples were freshwater (except one sample of well no. 13, with TDS of 14,388 mg/l). The TDS values ranged between 311 and 943 mg/l. The ion dominance of this aquifer includes two groups: Na > Ca > Mg with Cl > HCO3> SO4 which
was recorded in the most of groundwater samples and Na > Mg > Ca with Cl > SO4> HCO3in few wells.
On the other hand, the chemical results of the ground-water samples tapped from the fractured basement aqui-fer showed that a wide range of salinity and the water samples can be classified from fresh to brackish, and only two wells were classified as saline (well nos. 28 and 37). According to the values of TDS, it had a wide range; it ranged from 330 to 19,375 mg/l. Three groups of ion dominance were observed: Na > Ca > Mg with Cl > SO4>
HCO3which was noted in the most samples, Na > Mg >
Ca with Cl > SO4> HCO3 which was recorded in three
groundwater samples, and finally a group that was char-acterized by the freshwater where bicarbonates are greater than sulfates HCO3> Cl > SO4with cation
dom-inance varies between Na > Mg > Ca and Ca > Mg.
The excess of Cl− and Na+ can be explained by the
combined effect of the unfractionated aerosols belonging to marine environment and dissolution of watershed rocks. The marine aerosols are most likely a dominant source of solutes where marine aerosols may be depos-ited as dry salts on the land surface and periodically dis-solved and transported downward towards the aquifer during sporadic rainfall events. Some of these solutes may show high concentration through evaporation pro-cesses (such as, halite, gypsum, and other salts) where these salts may be accumulated for many years and then transported to the underground aquifer when a signifi-cant rainfall event occurs. On the other hand, the alka-line earth elements may be derived by dissolution of silicate minerals (e.g., plagioclase feldspar, chlorite, or biotite), carbonates (dolomite or calcite), gypsum, and/or cation exchange of Na+
for Ca2+, and Mg2+on clay min-erals. The excess of Ca2+and Mg2+does not result from the dissolution of carbonate rocks (calcite, dolomite) where the distribution is limited. Therefore, it can be at-tributed to metavolcanic and basic rocks.
Trace concentrations for 15 elements of the studied groundwater samples are generally between 0.0001 and
22.82 mg/l (Table 3). Concentrations of Fe are Mn are
relatively low in the studied groundwater except for the
water from Nubian Sandstone Aquifer that showed a
no-ticeable increase and ranging between 0.08 and
10.49 mg/l for Fe and between 0.02 and 2.83 mg/l for Mn. This is due to the lithologic nature of Nubian sand-stones which are rich in iron and manganese oxides. On the other hand, Sr and Al show notable recordings in the three aquifers where higher concentrations are present in the alluvial aquifer (19.5 mg/l, 20.46 mg/l, and 22.8 mg/l for Sr and 6.67 mg/l for Al). This is due to the presence of Sr and Al sources which are found both in the water-bearing rocks and also along the surface water path that recharges the groundwater. These sources are represented in the basement rocks, sandstone sediments, and carbonate rocks. Other trace elements did not show any constant trend as a result of a great diversity in the rocky nature for each of aquifers and watersheds.
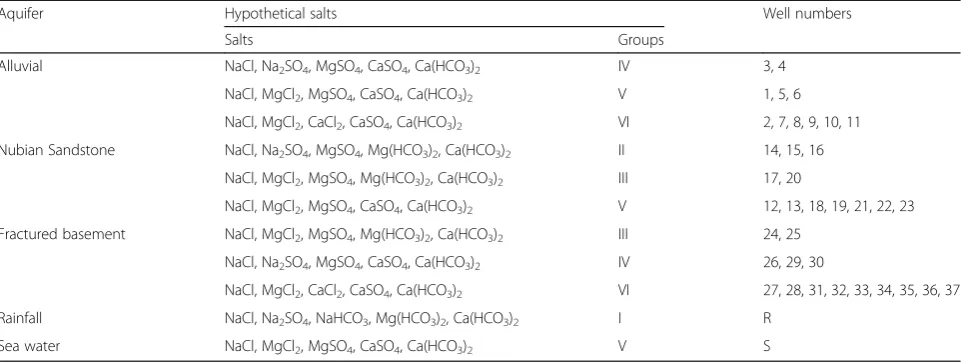
Hypothetical salts of groundwater
Regarding the hypothetical salt combinations in the three investigated aquifers of the studied area, there are
six main assemblages detected in the groundwater that are summarized in (Table4). Generally, it is obvious that the groundwater samples of the study area are character-ized by five different assemblages (II–VI); this indicates that there is no connection between them and affected by different conditions. The groundwater samples of the alluvial aquifer possessed three of the hypothetical salts assemblages, from IV to VI. Also, the groundwater sam-ples of both the Nubian Sandstone and the fractured basement aquifers are characterized by three hypothet-ical salts assemblages II, III, and V for the Nubian Sand-stone and III, IV, and VI for the fractured basement aquifer. Generally, the groundwater is characterized by meteoric water origin which is affected by leaching and dissolution processes. The presence of Na2SO4, MgSO4,
and Mg(HCO3)2 salts reflects the effect of dissolution
with leaching processes of earthly salts as the water is characterized by assemblage II. The ground-water that is characterized by assemblages (III, IV, V and
VI) that contain MgCl2salt means that this groundwater
Fig. 6Wells’location map of the fractured basement aquifer illustrated on Landsat images (GeoCover ETM+2010) showing the diversity of rocks in the vicinities of groundwater wells
Table 2Chemical data (major elements) of the investigated groundwater samples
Well no. Aquifer Eh pH EC
(μS/cm) TDS (mg/l)
Cation (mg/l) Anion (mg/l) SAR
Ca2+ Mg2+ Na+ K+ CO32− HCO3− SO42− Cl−
1 Alluvial 127 7.7 4200 2427 196.30 111.6 500 7 0.00 137.25 464.06 1079.4 7
2 129 7.6 3970 2153 242.60 108.0 360 6 0.00 134.20 469.5 899.50 4.8
3 82 8.4 3420 2068 135.63 100.6 410 14 30.00 219.60 780 488.30 6.5
4 81 8.4 2408 1253 58.56 114.0 210 13 30.00 259.25 388.92 308.40 3.6
5 104 7.6 13,810 8386 654.40 318.4 1850 20 15.00 79.30 2044.65 3443.8 14
6 107 7.9 16,410 9750 703.60 390.9 2200 17 15.00 122.00 1942.35 4420.4 16.5
7 119 7.4 19,940 11,053 1280.0 555.7 2000 16 0.00 54.90 800 6373.6 11.7
8 124 7.6 33,100 18,854 2117.0 778.8 3700 31 0.00 61.00 1274 10,922 17.4
9 119 7.4 17,320 10,095 1375.0 373.2 1750 20 0.00 45.75 900 5654 10.8
10 100 7.4 13,340 7880 1075.0 190.3 1400 16 0.00 67.10 1567.6 3598 10.3
11 90 7.5 11,550 6446 1100.0 127.7 1050 17 0.00 45.75 633.05 3495 8
12 Nubian
Sandstone
130 7.8 1394 776 80.69 40.46 125 10 0.00 167.75 198.47 237.47 2.8
13 145 7.3 25,350 14,388 562.90 727.3 3700 36 15.00 207.40 1841.9 7401 24
14 94 8.5 1621 757 15.63 11.69 245 7 0.00 85.40 64.72 370 11.5
15 97 8.1 1653 778 21.39 36.09 200 9 0.00 115.90 155.45 298.12 6
16 98 8 2045 915 27.80 47.46 230 11 15.00 152.50 178.31 328.96 6
17 96 7.9 2186 943 28.00 58.39 230 11 15.00 146.40 146 380.36 5.6
18 93 7.4 703 341 59.00 20.03 32 6 0.00 122.00 52 110.51 1.1
19 96 7.2 862 425 76.56 22.79 40 9 0.00 158.60 61.192 136.21 1.1
20 93 8.3 723 356 42.46 26.99 40 12 15.00 158.60 53.152 87.38 1.18
21 96 8 655 311 49.76 20.11 32 7 15.00 122.00 37.884 88.67 1.1
22 88 7.9 696 346 58.32 20.84 32 6 15.00 122.00 50.196 102.80 1.1
23 94 7.2 1003 579 99.43 25.03 65 7 0.00 167.75 144.615 154.20 1.51
24 Fractured basement
80 8.3 685 320 13.95 47.80 36 5 15.00 170.80 30.3 86.10 1.04
25 82 8.5 768 353 13.85 50.31 44 7 15.00 183.00 28.636 102.80 1.23
26 90 8.1 5280 3522 140.10 82.84 620 4 15.00 122.00 1751.34 848.10 10
27 75 8.2 862 502 15.91 68.50 55 3 15.00 122.00 178.4 105.37 1.33
28 133 6.7 35,800 19,375 3839.0 477.2 2450 25 0.00 39.65 228.12 12,336 9.9
29 66 8.1 1837 817 45.69 19.34 230 2 18.00 195.20 105.94 298.12 7.19
30 68 8.1 2068 1139 63.72 20.34 320 3 15.00 207.40 243.1 370.08 8.94
31 80 7.8 1931 1027 159.80 40.53 160 3 15.00 213.50 120 421.48 2.93
32 97 7.4 7240 4289 621.00 178.3 620 2 15.00 106.75 1000 1799 5.62
33 85 7.4 3900 2079 294.60 82.86 320 2 18.00 131.15 396.9 899.50 4.24
34 93 7.2 8290 4986 678.00 194.1 750 3 0.00 106.75 1200 2107 6.5
35 94 7.3 10,500 6151 737.50 171.1 1100 10 15.00 134.20 1994.15 2056 9.4
36 85 7.8 9210 5138 487.90 164.9 1100 16 6.00 97.60 1103.75 2210 11
37 96 7.6 23,340 13,673 1200.0 503.0 2800 20 0.00 122.00 3331.9 5756.8 17
Rainfall – 7.0 125 80 10.80 3.01 15 2 0.00 49.00 10 15.00 1.00
Sea water 124 8 66,400 38,021 721.20 1668 11,000 330 21.00 64.05 1761.5 22,487 51.4
P.L 6.5–8.5 1000 200 150 200 – – – 250 500
has a meteoric origin and affected by leaching and dis-solution of marine or sabkha deposits as most of the groundwater samples of the alluvial, the Nubian Sand-stone, and the fractured basement aquifers.
Rocks geochemistry
Based on field and Landsat investigations as well as to previous geochemical rock analyses, the geochemis-try of both the water-bearing formation and the rocks
Table 3Minor and trace elements concentration (in mg/l) of the investigated groundwater samples
Well no. Aquifer Al B Ba Cr Cu Fe Mn Mo Ni Pb Sr Ti V Zn P
1 Alluvial 0.017 0.716 0.024 0.019 0.000 0.034 0.013 0.035 0.003 0.054 3.944 0.049 0.048 0.017 0.050
2 6.767 0.626 0.123 0.013 0.016 3.940 0.417 0.007 0.028 0.065 3.819 0.050 0.027 0.064 0.582
3 0.119 1.090 0.033 0.013 0.000 0.040 0.006 0.023 0.006 0.018 0.990 0.008 0.023 0.000 0.008
4 0.000 0.675 0.045 0.008 0.000 0.000 0.000 0.034 0.002 0.015 1.022 0.002 0.043 0.000 0.039
5 0.108 2.607 0.028 0.021 0.000 0.109 0.011 0.056 0.006 0.008 9.823 0.032 0.022 0.012 0.113
6 0.107 3.069 0.033 0.014 0.004 0.099 0.013 0.048 0.006 0.008 10.840 0.027 0.027 0.003 0.217
7 0.785 2.574 0.051 0.017 0.011 1.541 0.066 0.006 0.009 0.002 20.460 0.058 0.017 0.223 0.037
8 0.477 3.231 0.067 0.030 0.000 0.739 0.019 0.007 0.008 0.003 22.820 0.065 0.026 0.033 0.018
9 0.269 1.807 0.036 0.020 0.000 0.479 0.023 0.006 0.007 0.010 19.560 0.049 0.029 0.043 0.018
10 0.032 0.779 0.021 0.009 0.001 0.000 0.224 0.005 0.005 0.000 13.190 0.028 0.015 0.000 0.004
11 0.035 0.949 0.032 0.013 0.000 0.000 0.094 0.017 0.006 0.004 15.610 0.032 0.023 0.009 0.000
12 Nubian
Sandstone
0.000 0.161 0.039 0.023 0.396 1.680 1.255 0.000 0.006 0.022 0.934 0.014 0.000 0.261 0.004
13 1.213 2.716 0.021 0.011 0.002 10.490 2.831 0.000 0.015 0.020 16.040 0.087 0.000 9.551 0.040
14 0.180 0.073 0.070 0.024 0.000 1.405 0.052 0.000 0.002 0.030 0.663 0.000 0.000 3.067 0.055
15 0.249 0.099 0.030 0.012 0.007 4.289 0.215 0.000 0.002 0.046 0.234 0.002 0.004 1.915 0.062
16 0.043 0.134 0.016 0.017 0.002 4.153 0.197 0.000 0.002 0.026 0.412 0.000 0.000 1.162 0.018
17 0.045 0.149 0.028 0.016 0.001 0.246 0.009 0.000 0.006 0.015 1.302 0.015 0.004 0.078 0.060
18 0.000 0.000 0.047 0.026 0.000 0.635 0.540 0.000 0.004 0.010 0.363 0.008 0.000 0.011 0.000
19 0.045 0.000 0.112 0.004 0.000 0.366 1.662 0.000 0.003 0.011 0.453 0.017 0.000 0.013 0.153
20 0.040 0.000 0.064 0.013 0.000 0.366 0.024 0.004 0.000 0.011 0.381 0.004 0.000 0.000 0.000
21 0.044 0.000 0.070 0.004 0.007 0.108 0.045 0.000 0.000 0.010 0.312 0.010 0.000 0.002 0.000
22 0.079 0.000 0.017 0.016 0.000 0.083 0.090 0.000 0.001 0.010 0.385 0.016 0.000 0.007 0.024
23 0.040 0.000 0.068 0.012 0.000 0.137 0.143 0.000 0.002 0.010 0.584 0.016 0.000 0.006 0.207
24 Fractured basement
0.000 0.338 0.006 0.001 0.000 0.017 0.008 0.008 0.001 0.010 0.172 0.000 0.007 0.000 0.000
25 0.058 0.059 0.004 0.020 0.000 0.254 0.014 0.001 0.001 0.013 0.207 0.002 0.013 0.145 0.006
26 0.351 1.759 0.018 0.025 0.000 0.263 0.015 0.033 0.005 0.013 2.531 0.016 0.036 0.000 0.012
27 0.753 0.022 0.016 0.032 0.000 1.129 0.054 0.003 0.054 0.013 0.251 0.002 0.009 0.095 0.075
28 0.265 5.423 0.101 0.009 0.007 1.257 0.063 0.003 0.007 0.005 5.140 0.061 0.022 0.071 0.255
29 0.107 0.651 0.053 0.018 0.000 0.056 0.103 0.010 0.003 0.015 0.695 0.003 0.028 0.000 0.026
30 0.165 1.054 0.037 0.024 0.000 0.197 0.112 0.007 0.003 0.012 0.796 0.005 0.018 0.018 0.213
31 0.086 0.386 0.062 0.009 0.000 0.016 0.031 0.006 0.002 0.013 1.461 0.012 0.015 0.000 0.037
32 0.062 0.763 0.036 0.009 0.000 0.000 0.006 0.040 0.004 0.009 5.514 0.028 0.013 0.000 0.000
33 0.085 0.552 0.104 0.000 0.000 0.000 0.867 0.014 0.003 0.013 2.703 0.021 0.000 0.000 0.008
34 1.246 0.755 0.070 0.005 0.003 0.619 0.208 0.001 0.007 0.005 6.687 0.034 0.012 0.011 0.191
35 0.023 2.858 0.024 0.020 0.000 0.000 0.000 0.006 0.005 0.007 11.110 0.024 0.000 0.000 0.006
36 0.072 0.631 0.046 0.007 0.000 0.000 0.001 0.002 0.005 0.004 5.475 0.022 0.016 0.004 0.031
37 0.019 1.616 0.051 0.004 0.001 0.000 0.017 0.001 0.006 0.005 10.210 0.022 0.019 0.000 0.079
Sea water 0.967 6.536 0.012 0.012 0.003 0.431 0.063 0.007 0.005 0.000 9.741 0.032 0.000 0.009 0.047
Permissible limit (EHCW2007)
0.2 1 1 0.05 1 0.3 0.05 0.07 0.02 0.05 – – – 3 –
along the water flow path to the wells were elucidated
for each well (Table 5). In the current research, the
Landsat image has provided more details about the geology which affects the recorded wells where each group of wells and in some cases each well have a different geologic setting. The details about geochem-istry of rocks which interact directly with
ground-water (ground-water-bearing formation) and other rocks
which interact with surface water and recharge the
aquifers are concluded in (Table 5). The alluvial
aqui-fer is composed of sand, mud, and basement rock fragments in gravel and sand sizes. The geology of watersheds along the path to the alluvial wells has the following great varieties: older gray granite (well
no. 1, Fig. 4a), metamorphic rocks (gneiss,
amphibo-lites, schist; well no. 2, Fig. 4a), metagabbro,
metase-diments (well nos. 3 and 4, Fig. 4b), clay, sand and
evaporates (well nos. 5 and 6, Fig. 4c), metasediments,
ophiolitic basic metavolcanics, and Tertiary olivine
basalt (well nos. 7 to 11, Fig. 4d). The recorded wells
and springs which are penetrating the Nubian Sand-stone Aquifer show a homogeneity in the lithologic nature where both the water-bearing and watersheds composed of sandstone with iron-ore beds, shale, and silt intercalation and coarse to medium fluviatile
sandstone (well nos. 12 to 23, Fig. 5a, b). The
min-eralogy of these ferruginous sandstone and ironstone includes goethite, magnetite, quartz, illite, halite,
kao-linite, dolomite, and vesuvianite with abundant SiO2,
Fe2O3, Al2O3, Cao, and MgO. On the other hand, the
basement aquifer was explored through 15 wells pen-etrated five water-bearing rocks as follows: ophiolitic
metagabbro (well nos. 24 and 25, Fig. 6c), older gray
granite (well no. 26, Fig. 6b), metasediments (well no.
27, Fig. 6b), acid volcanic (well nos. 28 to 35, Fig. 6a), and ophiolitic serpentinite with talc carbonate (well nos. 36 and 37, Fig. 6d), (Table 5).
Thematic layers affecting groundwater
The data obtained from the investigation of Landsat images and DEM analyses were used for the generation of the the-matic layers which are affecting the groundwater occurrences and quality and are shown in Figs.7,8,9,10,11, and12.
Structural lineaments
The structural lineaments of the area under investigation were elucidated and stated this area was affected by sets of faults where the trends of lineaments are NE-SW, E-W, and some NW-SE which are parallel to the Red Sea Rift (Fig. 7). These lineaments are concentrated in the southern and western parts of the study area where Nubian sediments and basement rocks are located. The Nubian Sandstone is fractured to a lesser degree than the basement rocks; these fractures are playing the main role in both groundwater occurrences and its recharge. With the comparison between drainage networks layer (Fig. 10) and structural lineament layer (Fig. 7), it is as-sumed that drainage lines are structurally controlled and developed along faults and/or fractures.
Elevation
The elevation difference over the study area reaches about 1700 m which reveals a great variation in the terrain shape. The coastal plain shows the lower elevation areas as well as the areas along the drainage lines in between the Red Sea Mountains. These lowlands are representing the water collectors where the majority of surface water running and can enhance the groundwater recharge (Fig. 8), while the high lands represent the main watersheds which receive any rainfalls and directed to the lower-altitude areas.
Drainage networks and hydrographic basins
The hydrographic basins were extracted through DEM analyses where the area has about 16 main basins (Fig.9). These basins were named according to topographic maps,
Table 4Groups of hypothetical salts for the studied groundwater samples
Aquifer Hypothetical salts Well numbers
Salts Groups
Alluvial NaCl, Na2SO4, MgSO4, CaSO4, Ca(HCO3)2 IV 3, 4
NaCl, MgCl2, MgSO4, CaSO4, Ca(HCO3)2 V 1, 5, 6
NaCl, MgCl2, CaCl2, CaSO4, Ca(HCO3)2 VI 2, 7, 8, 9, 10, 11
Nubian Sandstone NaCl, Na2SO4, MgSO4, Mg(HCO3)2, Ca(HCO3)2 II 14, 15, 16
NaCl, MgCl2, MgSO4, Mg(HCO3)2, Ca(HCO3)2 III 17, 20
NaCl, MgCl2, MgSO4, CaSO4, Ca(HCO3)2 V 12, 13, 18, 19, 21, 22, 23
Fractured basement NaCl, MgCl2, MgSO4, Mg(HCO3)2, Ca(HCO3)2 III 24, 25
NaCl, Na2SO4, MgSO4, CaSO4, Ca(HCO3)2 IV 26, 29, 30
NaCl, MgCl2, CaCl2, CaSO4, Ca(HCO3)2 VI 27, 28, 31, 32, 33, 34, 35, 36, 37
Rainfall NaCl, Na2SO4, NaHCO3, Mg(HCO3)2, Ca(HCO3)2 I R
Table 5Geology and geochemistry of water bearing formation and watershed affecting groundwater wells
Well no. Aquifer Water-bearing formation
Lithology Geochemistry and/or mineralogy
1 Alluvial Alluvial sediments composed of sand, mud, and basement rock fragments in gravel and sand sizes
Rock fragments of basement and mixture of watershed rocks; their geochemistry are identified in the following columns. In addition, carbonate minerals are dolomite, calcite, Mg-calcite, and aragonite. Siliciclastic minerals are quartz, K-feldspars, and plagioclase, with minor heavy minerals and clays (SiO2, CaO, Al2O3, and MgO) 2
3
4
5 Alluvial sediments and sabkha deposits Evaporates minerals include (gypsum, halite, anhydrite). Carbonate minerals are dolomite, calcite, Mg-calcite, and aragonite. Siliciclastic minerals are quartz, K-feldspars, and plagioclase (SiO2, CaO, SO3, MgO and Al2O3)
6
7 to 11 Alluvial sediments composed of sand, mud, and basement rock fragments
The same as mentioned in well numbers 1and 2
12 to 19 Nubian Sandstone Sandstone with iron-ore beds, shale, and silt intercalation
Ferruginous sandstone and ironstone. The mineralogy includes goethite magnetite, quartz, illite, halite, kaolinite, dolomite, and vesuvianite. Abundant SiO2, Fe2O3, Al2O3, Cao, and MgO
20 to 23 Coarse to medium fluviatile sandstone
24 Fractured basement Ophiolitic metagabbro SiO2, Al2O3, CaO, Fe2O3, MgO, Na2O
25
26 Older gray granite High SiO2, TiO2, CaO, NaO2,and P2O5and low K2O
and FeO, with abundant trace elements of Ba and Rb
27 Metasediments Abubdant SiO2, Al2O3, CaO, Fe2O3, MgO, Na2O
28 to 35 Acid volcanics Include rhyolite, rhyodacite, and dacite. High
concentrations of SiO2, Na2O, Fe2O3, K2O, Zr, Nb, and Y but low in MgO, CaO, Cr, Ni, Sr, Ga, and V
36 Ophiolitic serpentinite and talc carbonate Include magnizite, chromite, dolomite, talc, iron oxides (geothite, hematite, magnitite). Abundant Al2O3, SiO2, Feo, TiO2, CaMg(Co3)2, CaCO3, and Fe-Ti oxides 37
Well no. Aquifer The geology along the water flow path to the wells
Lithology Geochemistry and/or mineralogy
1 Alluvial Older gray granite High SiO2, TiO2, CaO, NaO2, and P2O5and low K2O and FeO, with abundant trace elements of Ba and Rb (R1)
2 Metamorphic rocks Included gneiss (abundant: SiO2, Al2O3, Cao, Fe2O3,
MgO, Na2O, K2O) and schist (are composed mainly of quartz + garnet+ muscovite + biotite + plagioclase ± chlorite ± opaque; abundant: SiO2, Al2O3, Cao, Fe2O3, MgO, Na2O, TiO2), and amphibolites (the same as schist) (R2)
3 Metagabbro, metasediments Abundant (SiO2, Al2O3, CaO, Fe2O3, MgO, Na2O) (R1)
4
5 Sabkha deposits included clay, sand, and evaporates Evaporates minerals include gypsum, halite, and anhydrite. Carbonate minerals are dolomite, calcite, Mg-calcite, and aragonite. Siliciclastic minerals are quartz, K-feldspars, and plagioclase (SiO2, CaO, SO3, MgO, and Al2O3)
6
7 to 11 Metasediments, ophiolitic basic metavolcanics, Tertiary olivine basalt
Metasediments: high Al2O3, CaO, Fe2O3, MgO, TiO2, Ni, V, and Cr; low SiO2, Na2O, Rb, Ba, Sr, Zr, and Y, where Tertiary olivine basalt composed of plagioclase, augite, and olivine (SiO2, TiO2, K2O, MgO) (R1, R3)
12 to 23 Nubian Sandstone Sandstone with iron-ore beds, shale, and silt intercalation
Ferruginous sandstone and ironstone. The mineralogy includes goethite magnetite, quartz, illite, halite, kaolinite, dolomite, and vesuvianite. Abundant SiO2, Fe2O3, Al2O3, Cao, MgO (R4)
and their names were shown in (Figs.1and7). Only eight basins are containing groundwater wells; the Nubian Sand-stone Aquifer is concentrated in the Wadi Hodein Basin, while the wells of alluvial and basement aquifers are scat-tered inside other basins. These basins are representing the catchment areas affecting the existing groundwater wells. The hydrographic basins include high intensive drainage
network (Fig. 10) which provides more chances for
groundwater recharge from surface runoff. These drainage lines are controlled by fractures and/or faults which mean that the sites along the drainage lines are associated by structural lineaments. This condition facilitates chances for groundwater accumulation which can be recharged through surface-groundwater interactions. It is also noted that the recorded well were drilled along the drainage lines except well nos. 5 and 6 from the alluvial aquifer.
Table 5Geology and geochemistry of water bearing formation and watershed affecting groundwater wells(Continued)
Well no. Aquifer Water-bearing formation
Lithology Geochemistry and/or mineralogy
24 Fractured basement Ophiolitic serpentine and talc carbonate Include magnizite, chromite, dolomite, talc, and iron oxides (geothite, hematite, magnitite). Abundant Al2O3, SiO2, Feo, TiO2, CaMg(Co3)2, CaCO3, and Fe-Ti oxides (R1)
25
26 Acid volcanic Include rhyolite, rhyodacite, and dacite. High
concentrations of SiO2, Na2O, Fe2O3, K2O, Zr, Nb, and Y but low in MgO, CaO, Cr, Ni, Sr, Ga, and V (R5)
27 Metamorphic rocks The same like well number 2
28 to 35 Acid volcanic and metasediments Acid volcanic (the same as well number 26) Metasediments (the same as well number 4)
36 Older gray granite and acid volcanic Older gray granite (the same as well number 1) Acid volcanic (the same as well number 26) 37
The geochemistry of the studied rocks is obtained from different sources as follows: (R1)—Hassan (2015), (R2)—Abd El-Naby and Frisch (2006), (R3)—Khalil (1997), (R4)—Farouk et al. (2015), (R5)—Shahin et al. (2016)
Flow direction
Flow direction is one of the important layers which contrib-ute to the assessment of groundwater (Fig.11). The layer of flow direction shows that surface water runs with the gen-eral slope with some exception for the isolated hilly areas
where they direct surface water to the adjacent lower areas. The common flow directions have trends to the northeast and southeast. It noted that the recorded groundwater wells are located in the path of surface flow direction which sup-ported the hypothesis of the current research.
Fig. 9Hydrographic basin of the study area extracted from DEM analyses Fig. 8Digital elevation model (DEM) of the study area (SRTM, 30 m)
Fig. 10Drainage network with stream orders of the study area
Slope
The slope layer shows (Fig.12) the values vary between
0 and 10° for the coastal plain and along the drainage
lines and 20–70 for the Red Sea terrains and
sediment-ary blocks. The Red Sea terrains have steep slopes due to the relief difference while the coastal plain and drain-age networks are acting as recharge areas.
Discussion
The chemical composition of groundwater is a combin-ation of water constituents that migrate into the ground-water reservoir with recharge ground-waters and a reaction of the groundwater body with the minerals present in the aquifer matrices (Yousif et al. 2016). The practice of en-vironmental sustainability aims to secure the necessary requirements of the population without deterioration of the ability of the natural resources (such as ground-water) to meet the needs of next generations. Here, the current research is focusing on the environmental pro-tection from the side of groundwater through the under-standing of rock-water interaction.
Rock-groundwater interaction and speciation modeling
In general, multi-chemical processes occur during the rock-water interaction, such as dissolution and/or precipi-tation, but it is worthy to mention that other factors can also contribute to the groundwater chemistry like recharge amounts, seawater intrusion, and any source of pollution. Here, the research is focusing on the chemical composition of groundwater which is influenced by rock interaction.
Interpretation of chemical data suggests that the
dissol-ution of CaCO3, ion-exchange processes, and weathering
of minerals control the major ion chemistry of sodium, cal-cium, magnesium, and potassium. With the comparison between results in Tables 4, 5, and 6, it is clear that groundwater chemistry is guided by rocks influences where dissolution of minerals and accessory minerals are the main sources for major and trace elements. Taking into ac-count, the study area is subjected to some rainy storms (the last heavy storm was recorded on 19 May 2017 where the rainfall continue for 2 h and resulted in surface runoff, this data was recorded through fieldwork) which lead to the recharging of the groundwater. The isotope analyses (oxygen 18 and deuterium) which carried out by Elewa (2000) confirmed the occurring of this recharging process. The freshwater supply to this area was depending on some natural springs from Nubian Sandstone exposures where the past historical reports mentioned that one of the French explorers (Linant de Bellefonds) recorded spring beside a temple cut into a mountainside that he saw in March 1832 in the southern part of Egypt’s Eastern Desert (Sidebotham et al. 2004). This spring is still providing freshwater until the present which reveals the continue re-charges to the Nubian sandstone aquifer. Therefore, the leaching and dissolution can be occurring through the interaction between the surface water and watershed rocks and also between water-bearing formation and ground-water. It is worth to mention that the recharge of the Nu-bian Sandstone Aquifer is a process which is controlled by some factors. For example, in the Western Desert, recharge
Fig. 12Slope layer by degree shows classes ranging from gentle to steep slopes due to the relief difference
of this aquifer can happen under extreme precipitation over the Nubian watershed in Sudan and Chad or under a considerable rising of Lake Nasser levels (Ahmed and
Abdelmohsen2018).
The groundwater chemistry of this area is principally controlled by the mixing of waters, evaporation, mineral
equilibrium, dissolution and deposition, and ion exchange processes (Dehnavi et al. 2011). The obtained results of saturation indices (SI) of minerals are useful for evaluating the level to which chemistry of water is controlled by the
equilibrium with solid phases (Appelo and Postma1993).
The saturation indices (SI) of minerals that were expected
Table 6Saturation indices of the studied groundwater samples, using PHREEQC geochemical model
Well no. Aquifer Aragonite, CaCO3
Calcite, CaCO3
Dolomite, CaMg(CO3)2
Alunite, KAl3(SO4)2(OH)6
Gibbsite, Al(OH)3
Goethite, FeOOH
Hematite, Fe2O3
Iron(III) oxide-hydroxide
Magnetite, MnOOH
Barite, BaSO4
1 Alluvial 0 0.09 0.31 0.82 7 17 13
2 0 0 0 6 3 9 21
3 0.61 0.75 1.75 1.3 7 18
4 0.66 0.8 2
5 0 0.02 0.14 2 1.65 7 18 13 0.4
6 0.24 0.39 0.89 0.35 1.44 7 18 14 0.35
7 4 8 2.59 20 13
8 0 0.08 0.1 3.44 2.32 8.49 20 13
9 3.14 2.12 8.16 19.32 12.76
10 0 0.14 1.68 1.31 13.9
11 0 0.07 1.14 1.44 13.8
12 Nubian
Sandstone
1 9 21 2 10
13 2 9 21 4 20
14 1.16 9.19 21.38 2.3 17.15
15 1.77 9.51 22 2.6 17.5
16 0.86 9.5 22 2.6 16.15
17 1.44 8.24 19.48 1.34 17.6
18 1.4 8.34 19.69 1.45 14.94
19 1.42 7.92 18.84 1 14.79
20 1.4 7 18 1 16.19
21 1.4 7.92 17 1 15.67
22 1.37 7.76 18.52 0.9 15.66
23 1.4 7.53 18.07 0.7 13.82
24 Fractured basement
0.58 17.52
25 0.53 0 0.67 8.45 19.9
26 0 0.11 0.33 0.48 1.79 8.33 19.66 16
27 0.06 0 2 9 21 16.27
28 1.89 1.61 7.95 18.9 11.12
29 0 0.05 0.09 0 1.31 7.62 18.25
30 0 0.01 0 1.49 8.22 19.45 16.16
31 0.19 0.34 0.44 0 1.48 6.98 16.97 14.7
32 0.22 0.37 0.68 1.7 1.64 12.43 0.1
33 0 0.14 0.07 1.46 1.8 14.79 0.25
34 5.3 2.78 8.09 19.2 13.33 0
35 0.04 0.19 0.09 1.47 1.19 0
36 0.04 0.18 0.24 0.62 1.41 13.43 0
37 0.49 0.63 1.21 0.52 1.03 13.26 0.02
to be responsible for the chemical composition of the re-corded groundwater were investigated.
The obtained results of speciation modeling are
summa-rized in (Table 6) where samples from the three studied
aquifers were investigated. The three aquifers are
super-saturated with respect to gibbsite (Al(OH)3), goethite
(FeOOH), hematite (Fe2O3), and magnetite (MnOOH).
All samples are supersaturated with gibbsite mineral due to the presence of aluminum in suspended fraction where the geochemistry of water-bearing formations and the rocks along the water path (Table5) shows that Al2O3is a
common component. The investigation of Landsat images and geologic map with respect to the locations of ground-water wells (Figs.3,4,5, and6) shows the geology along the water path to these wells which composed of metase-diments, metamorphic, and igneous rocks in case of allu-vial and basement aquifers. The geochemistry of these rocks (Table5) stated that Fe2O3and MgO are abundant
minerals. Therefore, their groundwaters are supersa-turated with goethite, hematite, and magnetite. On the other hand, the outputs of speciation modeling with re-gard to Nubian Sandstone Aquifer showing homogeneity results where its groundwater samples are supersaturated with gibbsite, goethite, hematite, magnetite, and iron(III) oxide-hydroxide. These supersaturations and homogeneity in mineral indices resulted from ferruginous sandstone and ironstone which represent the water-bearing forma-tion and also the main watershed which reacts with the surface water through its path to recharge groundwater. The other results of geochemical model clarify that groundwaters from both alluvial and basement aquifers
are supersaturated with aragonite (CaCO3), calcite
(CaCO3), dolomite (CaMg(CO3)2), and alunite (KAl3
(-SO4)2(OH)6) (Table 6). In case of alluvial aquifer, the
water-bearing formation consists of rock fragments of basement rocks and a mixture of carbonate minerals such as dolomite, calcite, Mg-calcite, and aragonite. Si-liciclastic minerals are quartz, K-feldspars, and
plagio-clase, with minor heavy minerals and clays (SiO2, CaO,
Al2O3, and MgO). On the other side, the basement
aquifer has a variety of rock content which includes acid volcanic, granite, ophiolitic metagabbro, and talc
carbonate. These rocks are rich with CaMg(Co3)2,
CaCO3, CaO, and K2O which can be considered the
main source for the saturation with carbonate minerals in groundwaters. However, rocks are generally classified as sedimentary, igneous, and metamorphic where min-erals formed these rocks can be dissolved in the groundwater based on their resistance to the chemical weathering. These reactions between rocks and ground-water are depending on the initial ground-water which in this case is represented by rainfall. Therefore, the current research conformed that the groundwater chemistry is the imprints of the rock-water interaction.
Hydrogeochemical evolution and groundwater genesis
Piper’s diagram (Piper1944) in (Fig.13) consists of three separate fields for plotting chemical data, two triangles at the lower right and lower left sides, and an intervening diamond shape for the projection. The major cations (Ca2
+
, Mg2+, and Na+plus K+) are plotted in the lower left tri-angle, while the major anions (Cl−, SO42−, and CO32−plus
HCO3−) are plotted in the lower right triangle. The two
points representing the cations and anions composition are then projected on the diamond-shaped field. Distinct groundwater quality types can be easily distinguished by their plotting in certain sub-areas of the diamond-shaped field. Piper’s diagram suggested that the groundwater in the studied area have the meteoric origin of mineralization (precipitation and flash flood over the area) affected by leaching and dissolution, this is for few samples of the in-vestigated aquifers of the study area. The ion dominance of this groundwater, especially in the Nubian sandstone aquifer, possessed the sequence of Na > Ca > Mg with Cl > HCO3> SO4. Most groundwater samples of alluvial,
Nu-bian Sandstone, and fractured basement aquifers are af-fected by leaching and dissolution of marine deposits and considered mature water.
Groundwater protection and development (recommendation)
In arid and hyper-arid regions, groundwater can be con-sidered the sole source of water for domestic, industrial, and agricultural needs. The development and protection of this precious source are a prerequisite for both poten-tial contamination and overexploitation. Therefore, the understanding of the hydrogeologic and geologic settings as well as the factors which affect the groundwater oc-currences and quality are in dire needs. Knowledge of aquifer lithology and identification of geology along the flow path to the groundwater wells, in addition to inves-tigations of different thematic layers related to ground-water accumulation, was used to summarize some recommendations. Based on field investigations, remote sensing data, geologic situation, geomorphologic setting, hydrologic parameters of the recorded well data, groundwater chemistry, and the thematic layers (struc-tural lineaments, DEM, hydrographic basins, drainage lines, flow direction, and slope), the following suggestion can be applied:
1. Priority map for groundwater exploration is proposed for both hydro-geophysical investigation and test drillings in order to evaluate the potential of groundwater (Fig.14). This map was created according to the results of the multidisciplinary data layer analysis of this study by using Arc GIS software. It is expected that the very high and high priorities have a good potential for groundwater
recharge based on the criteria such as density of structural lineaments (faults and/or fractures) which provide more chance for groundwater recharge, low slope, permeable soil type, position along the drainage network, elevation, and flow direction. The drainage lines and flow direction also support the chances for recharge. The low elevation and low slope values are increasing the residence time of surface water and hence providing good conditions for water accumulation. The increasing of residence time in fractured areas which have a low slope and elevations raise the possibility of recharge processes. In case of basement aquifer, the design for
determination of the priorities for exploring
groundwater was depending mainly on careful investigation of the structural lineaments with regard to their orientation, and the density of the intrusive dykes where it acts as a barrier of the percolated water. The intersected fractures with each other’s and intrusive dykes are providing high possibility environments for groundwater
entrapments. Therefore, these areas are suggested for future drilling.
2. The coastal plain and some parts of Piedmont Plain as wells as intermountain areas have low and very low priorities (Fig.14) due to low fracture density and the possibility of seawater intrusions which can be increased with aquifer discharging.
3. The obtained data about the recorded wells were used to calibrate the priority map (Fig.14). With regard to TDS values, the wells which are producing a freshwater (such as, well nos. 12, 14, 15, 16, 17, 18, 19, 20, 21, 22, 23, 24, 25, 27, 29; Table1) are located in the areas with priority classes from high to very high (compare Fig.10
“drainage with wells locations”with Fig.14), which confirm the basics for creations of the priority map. 4. The obtained results showed that the people in the
study area are suffering from water shortage problem, and the available water resources are polluted by heavy metals and/or maybe microbial pollutants. The trace element concentration of the investigated groundwater samples showed some values exceed the permissible limit (according to
EHCW2007) which represent a health hazard in
case of drinking that water. We also noticed a thick layer of green algae covered the pool that collected water from Abu Safa spring (Fig.1c) of the Nubian Sandstone Aquifer, which can be considered a source of pollution. Therefore, we suggest that the government can install some water treatment plants especially near the polluted freshwater resources (Wadi Abu Safa) to remediate the pollution in these water springs. Also, we suggest installing
photoreactors that can be used in this remote area for water purification and disinfection via the photo-catalysis technique as one of the advanced oxidation processes without any byproduct.
5. The best solution to overcome the saline and brackish water is the installation of the desalination plant. In such cases, the desalination of this groundwater provides coast reduction than desalination of seawater. Desert Research Center and Egypt Desalination Research Center of excellence have the required experiences to install small mobile water desalination plants using solar power. These small plants are considered the suitable solution for the high salinity problem in the study area.
6. Well nos. 12 and 13 of Nubian Sandstone Aquifer are very adjacent to each other, where the salinity values show the wide difference (TDS for well 12 is 776 mg/l and for well 13 is 14,388 mg/l). The review of the drilling reports of both wells stated that after 120 m (in case of well no. 12), the sandstone was completely affected by hydrothermal solutions which maybe came out through the fracture. This solution is very rich with minerals and salts and led to lost or reduces the porosity and permeability and also increase the salinity of groundwater (as in case of well 13). Therefore, it is recommended to avoid installation of screens in front of any sandstone affected by hydrothermal solutions during the design of any wells penetrate the Nubian Sandstone Aquifer. Shallow depths between 90 and 120 m can provide good potential and quality of groundwater, taking into account cost reduction.
Fig. 14Recommendation map clarifies the priority areas for future groundwater explorations
Conclusions
This study presents an example from a hyper-arid area on the Eastern Desert of Egypt where a combination of multidiscipline was applied to describe the rock-water interaction by testing the ability of remote sensing data to provide details about the geology affecting each groundwater well. In general, multi-chemical processes occur during the rock-water interaction, such as dissol-ution and/or precipitation, but other factors can also contribute to the groundwater chemistry like recharge amounts, seawater intrusion, and any source of pollu-tion. Here, the research is focusing on the chemical composition of groundwater which is influenced by rock interaction. Interpretation of chemical data suggests that
the dissolution of CaCO3, ion exchange processes, and
weathering of minerals controls the major ion chemistry of sodium, calcium, magnesium, and potassium. How-ever, rocks are generally classified as sedimentary, igne-ous, and metamorphic where minerals formed these rocks can be dissolved in the groundwater based on their resistance to the chemical weathering. These reac-tions between rocks and groundwater are depending on the initial rainfall; therefore, the current research con-formed that the groundwater chemistry is the signature of the rock-water interaction. The leaching and dissol-ution can occur through the interaction between the surface water and watershed rocks and also between water-bearing formation and groundwater. The integra-tion of remote sensing and GIS applicaintegra-tion is showing great efficiency in the knowledge of lithologic nature and identification of geology along the flow path to the groundwater wells. Also, these applications provide dif-ferent thematic layers related to groundwater accumula-tion (geomorphologic setting, hydrologic parameters, groundwater chemistry, and the thematic layers such as structural lineaments, DEM, hydrographic basins, drain-age lines, flow direction, and slope) which can be used for the determination of the priorities for exploring groundwater. The current scientific approach can be considered a replicable model which can be applied in the hyper-arid environment under the same conditions.
Acknowledgements
It is a pleasure to acknowledge the Egyptian Desalination Research Center of Excellence, EDRC) which follows Desert Research Center, for their supporting to carry out this research.
Availability of data and materials
All data generated or analyzed during this study are included in this manuscript.
Authors’contributions
MY studied the geology of the study area, analyzed and interpreted different satellite images and digital elevation models, prepared the maps through the applications of GIS, and run the geochemical model. AHE-A performed the chemical analyses of the groundwater, collected the groundwater samples, and calculated the hypothetical salts. Both authors wrote, reviewed, and approved the final manuscript.
Authors’information
Mohamed Yousif is an associate professor of hydrogeology, Geology Department, Desert Research Center. The research interest is focusing on the applications of remote sensing and GIS for groundwater exploration. His publication list is available on Google Scholar site (https://scholar.google.com/ citations?user=iHmSezgAAAAJ&hl=en).
Abdel Hameed El-Aassar is an associate professor of water chemistry, Hydro-geochemistry Department, Desert Research Center. The research interest is focusing on groundwater chemistry and water desalination.
Ethics approval and consent to participate
Not applicable
Consent for publication
Not applicable
Competing interests
Both authors declare that they have no competing interests.
Publisher’s Note
Springer Nature remains neutral with regard to jurisdictional claims in published maps and institutional affiliations.
Author details
1
Geology Department, Desert Research Centre, P.O. Box 11753, El Matariya, Cairo, Egypt.2Hydrogeochemistry Department, Desert Research Centre, P.O. Box 11753, El Matariya, Cairo, Egypt.
Received: 17 June 2018 Accepted: 8 August 2018
References
Abd El-Naby H, Frisch W (2006) Geochemical constraints from the Hafafit Metamorphic Complex (HMC): evidence of Neoproterozoic back-arc basin development in the central Eastern Desert of Egypt. J Afr Earth Sci 45:173–186 Abdel Moneim AA (2005) Overview of the geomorphological and hydrogeological
characteristics of the Eastern Desert of Egypt. Hydrogeol J 13:416–425 Ageeb GW, Kotb MM, Rahim IS (2007) Soil mapping of Wadi Hodein area,
southeastern Egypt using remote sensing and GIS techniques. Aust J Basic Appl Sci 1(4):793–800
Ahmed, M., Abdelmohsen, K., 2018. Quantifying modern recharge and depletion rates of the Nubian Aquifer in Egypt. Surv Geophys (2018) 39:729–751.
https://doi.org/10.1007/s10712-018-9465-3
American Society of Testing and Materials (ASTM) (2002) Water environmental technology, annual book of ASTM standards, sec. 11.01 and 11.02. U.S.N., West Conshohocken
Appelo CAJ, Postma D (1993) Geochemistry, groundwater and pollution. Balkema, Rotterdam
Conoco C (1987) Geological map of Egypt, scale 1:500,000-NF 36 NE-Bernice, Egypt. The Egyptian General Petroleum Corporation, Cairo
Dehnavi AG, Sarikhani R, Nagaraju D (2011) Hydro geochemical and rock water interaction studies in east of Kurdistan, N-W of Iran. Int J Environ Sci Res 1(1): 16–22
Egyptian Higher Committee for Water (EHCW), 2007. Egyptian standard for drinking water and domestic uses (in Arabic)
Elewa HH (2000) Hydrogeology and hydrological studies in Halaib-Shalatin area, Egypt, using remote sensing technology and other techniques. Ph.D thesis, Faculty of Science, Ain Shams University, p 281P
Embaby AI, Razack M, Lecoz M, Porel G (2016) Hydrogeochemical assessment of groundwater in the Precambrian rocks, South Eastern Desert, Egypt. J Water Resour Prot 8:293–310.https://doi.org/10.4236/jwarp.2016.83025
Farouk S, El-Rahmany M, El-Desoky H, Khalil A, Fahmy W (2015) Geochemical characteristics of goethite-bearing deposits in the Dakhla-Kharga oases, Western Desert, Egypt. IJSEAS 1(1):72–87
Gheith H, Sultan M (2002) Construction of a hydrologic model for estimating Wadi runoff and groundwater recharge in Eastern Desert, Egypt. Hydrol J 263:36–55 J Agric Res 31(4B):1677–98
Hassanein AK, Grais YL, Behiry EMK, Khider MH (2004) Origin, mode of formation of uniformity studies on soils of some physiographic units of Halaib and Shalateen area, Egypt. Zag J Agric Res 31(4B):1677–1698
ICARDA (International Center for Agricultural Research in the Dry Areas) (2010) Map of West Asia and Egypt, Absolute change of annual aridity index 2010– 2040/current climate. Available online at:http://geoagro.icarda.org/en/cms/ metadata/index/563/West%25252BAsia%25252Band%25252BEgypt.%25252 BAbsolute%25252Bchange%25252Bof%25252Bannual%25252Baridity%25252 Bindex%25252B2010-2040%25252F%25252Bcurrent%25252Bclimate
Khalil E (1997) Ocean-arc contenental margin volcanics sequence of Pan-African Precambrian belt, Egypt. Geochemical approach. Egypt J Geol 41/2B:477–528 Khalil MH (2014) Detection of magnetically susceptible dyke swarms in a fresh
coastal aquifer. Pure Appl Geophys 171:1829–1845 Springer, Basel Mohamed A, Sultan M, Ahmed M (2017) et al, Aquifer recharge, depletion, and
connectivity: inferences from GRACE, land surface models, geochemical, and geophysical data. GSA Bull.https://doi.org/10.1130/B31460.1
Parkhurst DL, Appelo CAJ (1999) User’s Guide to PHREEQC (Version 2)-a computer program for speciation, batch-reaction, one-dimensional transport, and inverse geochemical calculations, United States Geological Survey, Water Resources Investigations Report 99–4259, Washington DC, p 326
Piper AM (1944) A graphic procedure in the geochemical interpretation of water analyses. Trans Am Geophys Union 25(6):914–923 Washington DC Shahin HA, Masoud S, Bayoumi M (2016) Geology, geochemistry and radioactivity
of granitic and volcanic rocks at Hadarba area, South Eastern Desert, Egypt. Int Res J Geol Min 6(2):038–052
Shawky HA, Said MM, El-Aassar AM, Kotp YH, Abdel Mottaleb MSA (2012) Study the chemical characteristics of groundwater to determine the suitable localities desalination processes in the area between Mersa Alam and Ras Banas, Red Sea coast Eastern Desert, Egypt. J Am Sci 8(11):93–106 Sidebotham SE, Mikhail GT, Harrell JA, Bagnall RS (2004) Water temple at Bir Abu
Safa (Eastern Desert). J Am Res Cent Egypt 41:149–159
Soussa H, El Feel AA, Alfy SZ, Yousif MSM (2012) Flood hazard in Wadi Rahbaa area, Egypt. Arab J Geosci 5:45–52
Yousef AF, Salem AA, Baraka AM, Aglan OS (2009) The impact of geological setting on the groundwater occurrences in some Wadis in Shalatein–Abu Ramad Area, South Eastern Desert, Egypt. Eur Water Pub (EWRA) 25(26):53–68 Yousif M, van Gelder R, Bubenzer O (2016) Hydrogeological investigation of shallow
aquifers in an arid data-scarce coastal region (El Daba’a, northwestern Egypt). Hydrogeol J 24:159–179