DEMOGRAPHIC RESEARCH
A peer-reviewed, open-access journal of population sciences
DEMOGRAPHIC RESEARCH
VOLUME 39, ARTICLE 22, PAGES 647–670
PUBLISHED 27 SEPTEMBER 2018
http://www.demographic-research.org/Volumes/Vol39/22/ DOI: 10.4054/DemRes.2018.39.22
Research Article
WhatsApp usage patterns and prediction of
demographic characteristics without access to
message content
Avi Rosenfeld
Sigal Sina
David Sarne
Or Avidov
Sarit Kraus
This publication is part of the Special Collection on “Social Media and Demographic Research,” organized by Guest Editor Emilio Zagheni.
c
2018 Rosenfeld, Sina, Sarne, Avidov & Kraus. This open-access work is published under the terms of the Creative Commons Attribution 3.0 Germany (CC BY 3.0 DE), which permits use, reproduction, and distribution in any medium, provided the original author(s) and source are given credit.
1 Introduction 648
2 Background 650
3 Dataset creation and description 651
4 Descriptive statistics 653
5 Predictive models and hypotheses 659
6 Data analytic results 661
7 Conclusions and future work 666
WhatsApp usage patterns and prediction of demographic
characteristics without access to message content
Avi Rosenfeld1
Sigal Sina2
David Sarne2
Or Avidov2
Sarit Kraus2
Abstract
BACKGROUND
Social networks on the Internet have become ubiquitous applications that allow peo-ple to easily share text, pictures, and audio and video files. Popular networks include WhatsApp, Facebook, Reddit, and LinkedIn.
OBJECTIVE
We present an extensive study of the usage of the WhatsApp social network, an Internet messaging application that is quickly replacing SMS (short message service) messaging. To better understand people’s use of the network, we provide an analysis of over 6 million encrypted messages from over 100 users, with the objective of building demographic prediction models that use activity data but not the content of these messages.
METHODS
We performed extensive statistical and numerical analysis of the data and found signif-icant differences in WhatsApp usage across people of different genders and ages. We also entered the data into the Weka and pROC data mining packages and studied models created from decision trees, Bayesian networks, and logistic regression algorithms.
RESULTS
We found that different gender and age demographics had significantly different usage habits in almost all message and group attributes. We also noted differences in users’ group behavior and created prediction models, including the likelihood that a given group would have relatively more file attachments and if a group would contain a larger
ber of participants, a higher frequency of activity, quicker response times, and shorter messages.
CONCLUSIONS
We were successful in quantifying and predicting a user’s gender and age demographic. Similarly, we were able to predict different types of group usage. All models were built without analyzing message content.
CONTRIBUTION
The main contribution of this paper is the ability to predict user demographics without having access to users’ text content. We present a detailed discussion about the specific attributes that were contained in all predictive models and suggest possible applications based on these results.
1. Introduction
Social networks on the Internet have become ubiquitous applications, allowing people to easily share text, pictures, and audio and video files. Popular networks include Face-book, Reddit, and LinkedIn, all of which maintain websites that serve as hubs, facilitat-ing people’s information sharfacilitat-ing. In contrast, the relatively new WhatsApp application is a smartphone application that enables people to share information directly via their phones. Since its introduction in 2009, its growth has steadily increased, and as of April 2016, it has a user base of over a billion monthly active users.3 Although many
alter-natives to WhatsApp are currently available in different online application stores (e.g., Kik, Telegram, Line Messenger, BBM, WeChat), WhatsApp is currently the most popu-lar messaging application with the popu-largest name recognition, by far the popu-largest user base, and the strongest corporate backing since its acquisition by Facebook in 2014. Given the emerging importance of this network, it is not surprising that there is a growing interest in researching it, including user studies about people’s WhatsApp use and possible applica-tions (Jain, Eddy Luaran, and Rahman 2016; Gulacti et al. 2016; Fiadino, Schiavone, and Casas 2014; Church and de Oliveira 2013; Pielot et al. 2014; O’Hara et al. 2014; Bouhnik and Deshen 2014; Mudliar and Rangaswamy 2015; Montag et al. 2015; Johnston et al. 2015).
This paper’s main contribution is that we have successfully created models that pre-dict WhatsApp usage patterns between different types of users and groups without relying on the content of people’s text messages. As discussed in more detail in the following section, prior studies about WhatsApp typically based their analysis on the content within the messages (Wang, Burke, and Kraut 2013; Argamon et al. 2009; Wagner et al. 2015).
Collecting and storing text messages is problematic for several reasons. First, privacy concerns exist in storing and analyzing people’s messages and can raise significant ethical concerns (Van Wel and Royakkers 2004). Second, storing all information from peoples’ text messages can require large amounts of storage space, which in turn increases the cost of such analyses (Fan et al. 2006). Instead, we focus exclusively on general message information, such as the message’s length, the size of the conversation group to which it was sent, and temporal properties such as the time it was sent and how much time elapsed between a given message and the previous one. Despite the lack of content, we success-fully created models that predict usage patterns for different types of users and groups. In previous studies, such patterns were found by checking a specific thesis via distribut-ing and analyzdistribut-ing targeted questions from questionnaires (Church and de Oliveira 2013; Pielot et al. 2014; O’Hara et al. 2014; Mudliar and Rangaswamy 2015). These previously used methods are significantly more time-intensive than the automated machine learning approach that we used. While this methodology has been used to study other social net-works, including Facebook (Wang, Burke, and Kraut 2013; Xiang, Neville, and Rogati 2010; Bakshy et al. 2012) and MySpace (Thelwall, Wilkinson, and Uppal 2010), applying the methodology to the WhatsApp network is significantly more complicated because, in contrast to these other networks, no public dataset currently exists, probably because of the medium involved. Whereas other social networks are primarily web-based, enabling data to be compiled through web crawling, the WhatsApp network is based on individ-uals’ private phone use and thus is not publicly available. Furthermore, these studies typically use the messages’ actual content, something we intentionally did not use.
is that it generates an assessment of which attributes and logical rules were important in building these prediction models, thereby providing additional insights. Last, we note the importance of these results with possible future directions and applications.
2. Background
This work’s primary focus is to address how individuals behave on WhatsApp without using the content of their messages. The WhatsApp social network is unique in several ways. WhatsApp was developed to allow users to privately and freely send messages to each other through their smartphones. It provides a free alternative to SMS (short mes-sage services) which is often still a metered (pay per use) service. Not only is WhatsApp often more cost effective than SMS, but it facilitates large group conversations, some-thing that is difficult through SMS, if not impossible. While freely sharing information over the Internet is common to many social networks, and other public messaging ser-vices (such as Twitter) exist, the private nature of the WhatsApp network makes it rather unique. Another difference between WhatsApp and other social networks is that mem-bership is created and updated directly via people’s smartphones. Not only is registration done exclusively through one’s phone number, but the smartphone is the primary inter-face for sending and receiving messages.4 Also, WhatsApp interpersonal conversation
groups are the network’s only communication medium. Groups are formed by adding people’s telephone numbers to that group. In contrast, other social networks are based on user membership and primarily focus on public messages (called ‘posts’ on Facebook and ‘tweets’ on Twitter), where information is sent to all connected rather than through private groups. Furthermore, Facebook is a network for publicly sharing photos, up-dates, and general news with members who “follow” you. Twitter is a microblog network where members interact through concise messages of up to 280 characters. Given these and other differences between WhatsApp and other social networks, we believe that exist-ing research about other networks is not necessarily applicable, and a new and thorough analysis of WhatsApp is warranted.
Much recent work has been dedicated to the study of how people use WhatsApp and the role of this new application in social communication. Most works to date have analyzed peoples’ behavior through conducting surveys and targeted interviews. For ex-ample, work by Church and de Oliveira (2013) conducted an online survey asking users targeted questions that were aimed at understanding differences between WhatsApp and SMS usage. Pielot et al. (2014) created a survey focusing on the question of whether people expected an answer to their WhatsApp and SMS messages within several minutes. O’Hara et al. (2014) interviewed 20 WhatsApp users for nearly an hour each, asking them
semi-structured questions aimed at determining the nature of relationships forged with the people with whom they communicated. Mudliar and Rangaswamy (2015) spent over 350 hours observing 109 students and conducted surveys to understand gender differences within Indian students’ use of WhatsApp. All of these studies can be characterized as be-ing formed to answer specific questions by conductbe-ing targeted surveys and interviews.
Our work is unique in that it uses statistical and data mining methods to study WhatsApp usage at the message level without knowing the content of the messages. Mo-tivation for our study, as for previous WhatsApp research, is to analyze differences be-tween genders, the time that elapses until a message is answered, and the characteristics of larger and smaller discussion groups. However, our study is fundamentally different in that it is based solely on actual WhatsApp metamessage data, and creates predictive models without any content knowledge. The issue of smartphone usage analysis was recently studied, and one of the study’s conclusions was that people often inaccurately report their own usage in questionnaires (Lin et al. 2015). Our methodology helps avoid this issue. To our knowledge, only one other study, performed by Montag et al. (2015), logged WhatsApp usage from nearly 2,500 participants. While the number of partici-pants in this study is impressive, the actual data logged was significantly less robust than in this study. They collected only general metadata about use, limited information about WhatsApp messages and no information about the users’ group activity.
In theory, even more accurate models could have been constructed had we also an-alyzed the messages’ content. Specifically, models that were previously developed can predict a user’s gender, age, native language, or personality (Wang, Burke, and Kraut 2013; Argamon et al. 2009) based on content. Examples include work by Argamon et al. (2009), which focused on creating models that identify word usage differences between men and women on Internet blogs. Similarly, Wagner et al. (2015) focused on content differences between men and women in Wikipedia, and Wang, Burke, and Kraut per-formed a study of content differences between genders on Facebook (Wang, Burke, and Kraut 2013). However, as the WhatsApp network is inherently private, such approaches could not be applied in our case due to privacy concerns. As we now detail, even without this information we were successful overall in predicting a user’s demographic and group behavior.
3. Dataset creation and description
external tool that can back up an Android application.5This enabled taking a “snapshot” of a person’s groups and messages as they appear in that person’s phone. To make the data anonymous, the software encrypts the data that was pulled directly from the participant’s smartphone by using the hash-based message authentication code (HMAC). The entire process of obtaining a participant’s data lasted approximately 15 minutes and we com-pensated each participant $12 for their time and temporary inability to use their phones. We also collected the participants’ general demographic information including their age, gender, place of residence, and educational background. In addition, we asked them to self-rate their sociability and WhatsApp usage on a five-point Likert scale (Low to High), and to answer four Boolean questions dealing with whether they use WhatsApp for com-munication with work, family, friends, or others. To guarantee that the study complied with policies on ethical conduct, we obtained institutional review board (IRB) approval before beginning data collection.
We found it challenging to recruit participants because people were quite reluctant to provide information about their WhatsApp messages, even when we emphasized that all content sent was encrypted, and that no nonencrypted content data was ever sent. While we attempted to recruit participants from all age groups, we found that student participants, found through advertisements on campus, were the demographic most will-ing to participate. Nonetheless, we did make a concerted effort to find people in other demographics through word of mouth. Through this process we recruited a total of 137 participants. Only 19 of these participants were not college-age students (18 through 34), so we removed these participants’ data from the analysis because this group was not large enough to be validly divided into further age subgroups. Thus, we are aware that the data collection process was biased for younger people, and we hope to address this in the future through a different collection process for other age groups.
To remove any biases in our analysis from people who had not used WhatsApp for long periods of time or who did not generally engage in WhatsApp conversations, we further removed another 7 people who were active in WhatsApp for under 20 days or had fewer than ten total WhatsApp groups. Thus, the dataset in this study contains messages from 111 participants, of which 59 were female and 52 were male, all of them young adults between 18 and 34 years of age, with a median age of 27. The 111 participants sent and received a total of 6,449,631 messages over an average period of approximately 15 months.6
The defining characteristic for the logged data is that it intentionally contains no tex-tual content. All types of textex-tual content are unavailable, including any special characters or emojis that exist in the messages. Similarly, we stress that we have no information about the message recipients other than an anonymous ID because all data is anonymous.
5Both the ADB software and the data collected are available from the authors.
While we did not have the messages’ content or recipient information, we were nonetheless still able to glean a great deal of usage information regarding message and group statistics. The first type of information focused on general information surround-ing the messages’ characteristics, such as when they were sent, the number of words in the message, whether the message included a file, and the length of time that elapsed before a response was sent. Once we had all of the messages, we discretized their time into categories based on the percentages of messages sent over each hour-long interval (e.g., messages sent between 5:00pm and 6:00pm). Similarly, we discretized the num-ber of messages into the categories of 1, 2, 3–5, 6–10, 11–20, and 20+ words. We then discretized messages according to the time that elapsed between messages – under 1, 1–2, 3–5, 6–15, 16–30, and 31–60 minutes. The motivation behind this process is our assumption that messages that appear within a relatively short time interval in the same group might be related to the same conversation. We emphasize that by no means does the elapsed time category imply that a message that appeared more than an hour after the last message was sent in a given group is not related to former messages, except that with no other supporting data (i.e., the content itself) it is impossible to make a concrete connection to prior messages. Hence, the time elapsed is the only possible, though not a perfect, indication for relevance. We also discretized messages according to their file attachments and created Boolean categories of messages with and without files.
The second type of logged information concerned WhatsApp conversation groups. This dataset contained a total of 10,730 such groups from the 111 users. Note that groups with two participants are similar to a typical SMS conversation, and thus through log-ging this data we could test the degree to which WhatsApp has replaced traditional SMS messaging. However, groups might also be formed around a general topic, such as a dis-cussion about work, leisure, or family issues with many more than two participants. We logged information about the group size of all of the messages and categorized this in-formation into the percentage of messages in trivially small groups of two people, groups of three to four participants, and those with five or more participants. We also collected group statistics that subsume those within the message analysis, but we refer to the per-centage of messages within a group having a certain attribute (e.g., the perper-centage of messages sent at a certain time, of a certain length, containing a file, etc.).
4. Descriptive statistics
data-driven approach to be successful, significant differences must be evident across different demographic groups within the data. To confirm this assumption, we checked that such differences did in fact exist and were statistically significant.
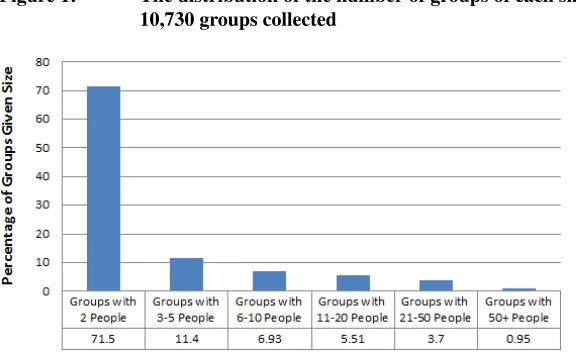
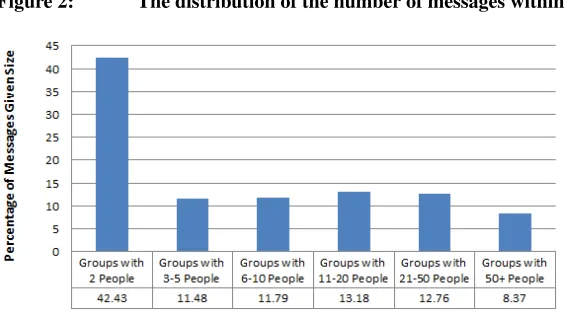
Specifically, we analyzed the basic distribution of messages, focusing on the statis-tical distributions across different genders, ages, and types of use. We found that over 70% (71.5%) of WhatsApp groups had only two participants (7,671 out of the 10,730), confirming previous assertions that WhatsApp is replacing SMS messaging (Church and de Oliveira 2013). On the flipside, over 50% of all messages were not in groups of two (3,713,052 out of 6,449,631), indicating that, typically, larger groups were fruitful grounds for larger discussions – something that SMS typically does not support. To bet-ter understand this point, please note these differences using the graphical distributions of the number of groups of each size in Figure 1 and the distribution of all messages in those same groups in Figure 2. We note that the number of two-person groups is overwhelm-ingly large (71.5%), but that the number of messages in these groups is significantly smaller (42.43%).
Figure 1: The distribution of the number of groups of each size within the 10,730 groups collected
Figure 2: The distribution of the number of messages within each group size
Note: Notice the more balanced percentage of messages in groups with more than two people.
Notably, we found that while the number of groups with over 50 members is less than 1%, these groups have a disproportionately large number of messages (8.37%). We believe that the reason for this is clear: Larger groups tend to have larger numbers of messages in each group. Thus, we find that a large percentage of WhatsApp activity is in fact taking the place of traditional SMS messages between two people. However, group messaging among large numbers of users, another key use of WhatsApp which SMS is less successful in supporting, also constitutes a large percentage of the WhatsApp messages we collected.
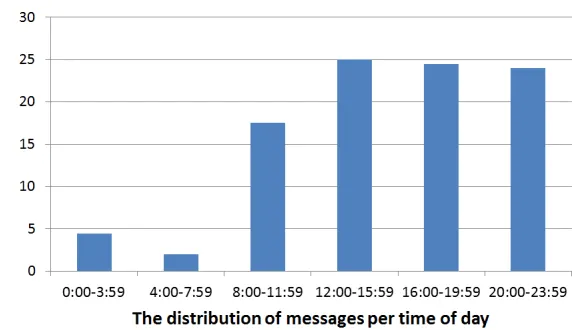
(p-score>0.1), while a significantly smaller number of messages were sent between 8:00 a.m. and 12 p.m. (p-score<<0.01).
Figure 3: Analysis of reply time to all messages in the dataset: Most messages answered within one minute
Figure 4: The distribution of messages per time of day (over all messages in the dataset)
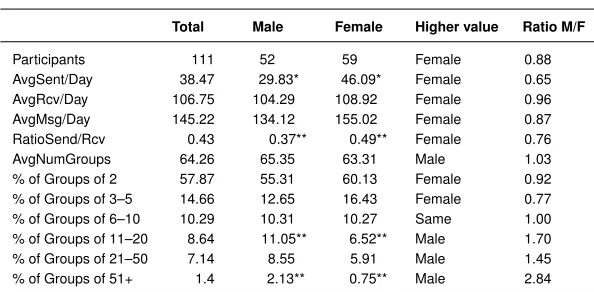
Table 1: WhatsApp main statistics (average number of messages sent, received, sent-received ratio, and total, per day, and according to the group size) per gender
Total Male Female Higher value Ratio M/F
Participants 111 52 59 Female 0.88
AvgSent/Day 38.47 29.83* 46.09* Female 0.65 AvgRcv/Day 106.75 104.29 108.92 Female 0.96 AvgMsg/Day 145.22 134.12 155.02 Female 0.87 RatioSend/Rcv 0.43 0.37** 0.49** Female 0.76 AvgNumGroups 64.26 65.35 63.31 Male 1.03 % of Groups of 2 57.87 55.31 60.13 Female 0.92 % of Groups of 3–5 14.66 12.65 16.43 Female 0.77 % of Groups of 6–10 10.29 10.31 10.27 Same 1.00 % of Groups of 11–20 8.64 11.05** 6.52** Male 1.70 % of Groups of 21–50 7.14 8.55 5.91 Male 1.45 % of Groups of 51+ 1.4 2.13** 0.75** Male 2.84
Note: Many of these differences are statistically significant and are denoted with one star for significance below the p-score threshold of 0.1, and two stars for differences below a p-score threshold of 0.05.
Table 1 contains several additional gender-related insights. First, we found that women on average sent and received more messages than men. Women sent and received over 155 messages a day, whereas men sent and received approximately 134 messages (row 4), a difference of approximately 15%. Of these messages, women sent on average approximately 46 messages a day and received 109 messages, whereas men sent an aver-age of slightly less than 30 messaver-ages a day and received about 104 messaver-ages (rows 2–3). Thus, men evidently sent fewer messages on average than women, something which was also evident in the differences in the ratios between sent and received messages (row 5). Second, while on average both genders participated in a similar number of conversations overall (63–65 groups), the distribution of the various group sizes between the genders was different. Women were more active in smaller conversation groups (60.13% versus 55.31% in groups with two participants), whereas men were more active in larger groups (11.05% for men versus 6.52% for women in groups of 11–20, 8.55% versus 5.91% in groups of 21–50 and 2.13% versus 0.75% in groups bigger than 50) (rows 6–12).
We note which of these differences proved statistically significant by using a two-tailed t-test. Cells that are annotated with one star (i.e., AvgSent/Day) recorded a p-score of under 0.1 (0.06), while those cells with two stars were below the 0.05 significance level (0.02, 0.01, and 0.04 for the RatioSend/Rcv, groups sized 11–20 and 51+ respectively). Thus, we note that significant differences do exist between the genders’ behavior.
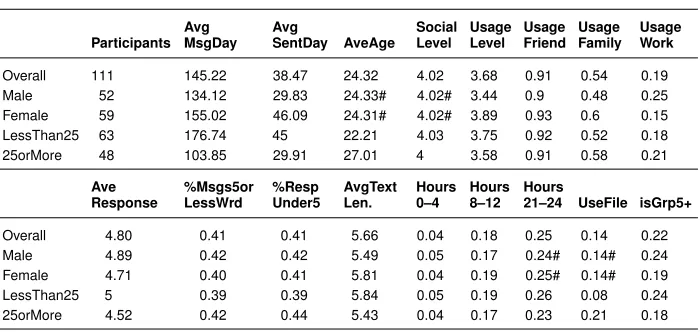
and (2) WhatsApp users younger than 25 (the median age) and aged 25 or older. We se-lected these age distributions based on a previous large-scale statistical analysis of What-sApp user ages in the general population ( http://www.statista.com/statistics/290447/age-distribution-of-us-whatsapp-users).7 Note the differences between the average number of total messages per day (AvgMsgDay), groups per user (AvgGroup/Usr) and differences in the users’ responses to the questionnaire items in which they self-rated their sociality (SocialLevel), overall usage (UsageLevel), differences in the Boolean values (averaged based on values of 0 and 1), and usage in communicating with friends (UsageFriend), family (UsageFamily), and work (UsageWork). In fact, we tested all pairs of numbers for statistical significance (two-tailed t-test) and found that all differences were signifi-cant (p-score<<0.05) except where noted with a “#” at the end of each pair, as is the case of the UsageWork numbers in the pair of people 25 or older and younger than 25. Additionally, we found significant differences in the usage patterns across group usage with people who were members of these different demographics. Note the differences in the average number of minutes a user took to respond to a message (AvgResponse), the percentage of their messages that were five words or fewer (Msgs5orLessWrd), the per-centage of their messages that were quick responses within five minutes (%RespUnder5), the average message length (AvgTextLength), and the distribution of messages across dif-ferent times (midnight to 4:00 a.m., 8:00 a.m. to 12:00 p.m., and 8:00 p.m. to midnight). We also found that usage styles were different in regards to the percentage of files found in users’ groups of different genders and ages (UseFile) and the percentage of groups of which they were members that had five or more total users (isGrp5+).
We find some of the differences in Table 2 intuitive and others surprising. We are not surprised to find that younger people are more likely than older ones to send messages late at night, and thus relatively older people send a higher percentage of their messages during the day. One could find support for gender differences in people’s self-rating of how much they use WhatsApp to communicate with family versus work, similar to previ-ously observed differences in gender expressions (Kring and Gordon 1998). However, we could not find a clear explanation as to why men seem to send more files in their groups than women or why older people participate in larger groups more often than younger people. These differences might point to new directions that could be confirmed with fur-ther research and questionnaires. For example, a possible hypothesis for the differences in group sizes across different ages is that younger people have more thoroughly adopted WhatsApp as a replacement for SMS messaging and consequently a larger percentage of their communication can be found in these smaller groups.
Table 2: Results across different genders and ages in the WhatsApp dataset
Avg Avg Social Usage Usage Usage Usage
Participants MsgDay SentDay AveAge Level Level Friend Family Work
Overall 111 145.22 38.47 24.32 4.02 3.68 0.91 0.54 0.19 Male 52 134.12 29.83 24.33# 4.02# 3.44 0.9 0.48 0.25 Female 59 155.02 46.09 24.31# 4.02# 3.89 0.93 0.6 0.15 LessThan25 63 176.74 45 22.21 4.03 3.75 0.92 0.52 0.18 25orMore 48 103.85 29.91 27.01 4 3.58 0.91 0.58 0.21
Ave %Msgs5or %Resp AvgText Hours Hours Hours
Response LessWrd Under5 Len. 0–4 8–12 21–24 UseFile isGrp5+
Overall 4.80 0.41 0.41 5.66 0.04 0.18 0.25 0.14 0.22 Male 4.89 0.42 0.42 5.49 0.05 0.17 0.24# 0.14# 0.24 Female 4.71 0.40 0.41 5.81 0.04 0.19 0.25# 0.14# 0.19 LessThan25 5 0.39 0.39 5.84 0.05 0.19 0.26 0.08 0.24 25orMore 4.52 0.42 0.44 5.43 0.04 0.17 0.23 0.21 0.18
Note: Nearly all differences are statistically significant except those noted by a “#” symbol.
5. Predictive models and hypotheses
As we demonstrated in the previous section, significant differences do in fact exist be-tween different types of WhatsApp users and groups. However, even statistically signif-icant differences do not necessarily allow us to predict usage patterns. For example, the previous section demonstrated that men typically send shorter messages and women send and receive more messages per day. However, these differences do not necessarily allow us to make a prediction about a specific user – something that data mining algorithms do in fact allow, as we now present. To illustrate the potential of using the collected data for prediction purposes, we created several predictive models for the user and group datasets, which we describe in this section.
vein, one might find differences between ages, even within one gender. Such differences may be somewhat obvious, such as the time at which a message is sent – e.g., people of certain ages might be more or less likely to work and thus be less likely to send mes-sages at certain times. But less obvious differences might exist too, such as differences in message length.
Our second hypothesis, based on the differences reported in accordance with the various statistics described in the former section, is that different types of group usage can be predicted based on general group attributes, again even without considering the messages’ content. Specifically, we develop models that predict which groups will have a certain type of content such as file attachments or shorter messages. We also develop group models that predict which groups will have certain user activity, such as a larger quantity or more frequent messages, and quicker response times. In theory, other usage questions could have been studied, such as if a message contained certain text – e.g., in-appropriate or flagged for a certain type of content. However, because we have no access to message content, these issues cannot be evaluated. Similarly, it may be possible that certain messages are inherently different and thus likely to be more popular or important. Along these lines, models might be created to predict which messages are apt to have certain characteristics, such as being forwarded – something that was previously studied within the Twitter network (Naveed et al. 2011). However, once again that study focused on the message content, which is often infeasible to rely on in real-life settings, due to either privacy constraints or availability.
Table 3: Authorship identification prediction of gender and age based on average WhatsApp user data
Model name Size Baseline D.T. Acc. D.T. AUC Bayes Acc. Bayes AUC Logistic all 95% CI
User gender 111 53.15 62.16 0.55 61.26 0.6 0.81 0.73–0.89 User age 111 56.76 60.36 0.63 54.96 0.59 0.74 0.65–0.83
Note: The first column presents the number of records in the database. The second column represents the accuracy baseline through classifying all records as per the largest category. The third and fourth columns respectively present the accuracy and ROC of the decision tree model. The fifth and sixth respectively present the accuracy and ROC of the Bayesian model. The seventh and eighth columns are the ROC and confidence intervals of the logistic regression model.
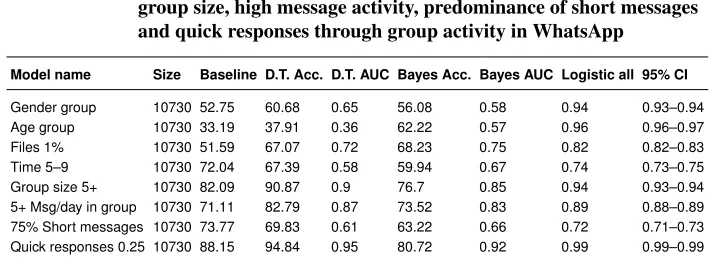
Table 4: Predicting gender, age, file usage, time messages are sent, large group size, high message activity, predominance of short messages and quick responses through group activity in WhatsApp
Model name Size Baseline D.T. Acc. D.T. AUC Bayes Acc. Bayes AUC Logistic all 95% CI
Gender group 10730 52.75 60.68 0.65 56.08 0.58 0.94 0.93–0.94 Age group 10730 33.19 37.91 0.36 62.22 0.57 0.96 0.96–0.97 Files 1% 10730 51.59 67.07 0.72 68.23 0.75 0.82 0.82–0.83 Time 5–9 10730 72.04 67.39 0.58 59.94 0.67 0.74 0.73–0.75 Group size 5+ 10730 82.09 90.87 0.9 76.7 0.85 0.94 0.93–0.94 5+ Msg/day in group 10730 71.11 82.79 0.87 73.52 0.83 0.89 0.88–0.89 75% Short messages 10730 73.77 69.83 0.61 63.22 0.66 0.72 0.71–0.73 Quick responses 0.25 10730 88.15 94.84 0.95 80.72 0.92 0.99 0.99–0.99
Note: The first column presents the number of records in the database. The second column represents the accuracy baseline through classifying all records as per the largest category. The third and fourth columns respectively present the accuracy and ROC of the decision tree model. The fifth and sixth respectively present the accuracy and ROC of the Bayesian model. The seventh and eighth columns are the ROC and confidence intervals of the logistic regression model.
6. Data analytic results
Instead, for each group model we generated ten randomized splits which ensured that a user’s groups were within only the training or the testing dataset. While the resultant stratified training-testing splits were not always of the same size, they did guarantee that we did not overfit by having the same user in both the training and testing data.
We also created logistic regression models using the pROC package in R (Robin et al. 2011). While these models were not validated using cross-validation, we did gener-ate confidence intervals at the 95% level. These models provide additional confirmation and comparison of our results to a linear model, including the statistical analysis provided by the confidence intervals.
Overall, we were successful in predicting a user’s gender and approximate age based on users’ general data, as can be seen in Table 3. The first column in the table presents how many records were in each dataset. The second column represents a baseline accu-racy which, is constructed by classifying all records as belonging to the larger category (referred to as ZeroR in Weka). For example, the user dataset contains 59 women and 52 men. Assuming all users are female would have an accuracy of 53.15% (see column 2, row 1) and 63 of the 111 users were younger than 25, thus leading to a baseline value of 56.76% (see column 2, row 2). Minimally, a successful model should at least be more accurate than this value. The next two columns present the accuracy and area under the curve (AUC) of the decision tree model, with the following two columns presenting the accuracy and AUC of the corresponding Bayesian model. The last two rows present the AUC and confidence intervals at the 95% level for the logistic regression model in the pRoc package in R. The first row presents the results for predicting gender based on the data and the second row presents the results for predicting age – i.e., 25 or older versus under 25 years old. This cutoff was chosen because it represented roughly a 50/50 split within the data. Note that both models were successful in both tasks: The predictions’ accuracies were much greater than the baseline values.
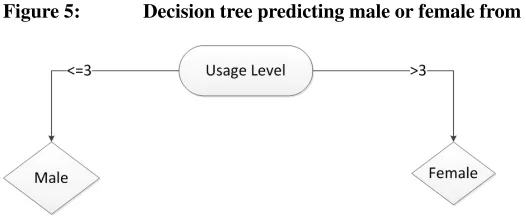
Figure 5: Decision tree predicting male or female from all collected user data
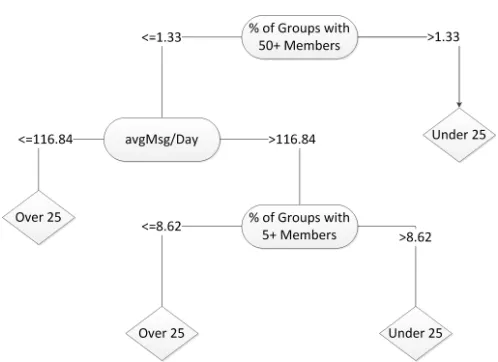
Figure 6: Decision tree predicting user age from user data
Note: Here, the classification relies on the percentage of groups with more than 50 members within the overall set of groups of which the user is member, the average number of messages per day, and the percentage of groups with more than five members.
An advantage in building decision trees is noting the logical rules and the attributes in the learned models. We studied this output from the decision tree models. We noted that the decision tree for predicting gender focuses on the usage level, the response time and the number of large groups a user had. Specifically, we found that men overall self-reported lower usage levels, on average took longer to respond, and have large groups. A slightly simplified version of the gender decision tree is presented in Figure 5. Note that this rule is relatively simple: If the user self-rated a usage level of 3 or less, they were male, otherwise they were female. Despite the simplicity of this decision tree, it still yielded an accuracy of 63.56%. Nonetheless, more complex models could be built with both decision trees and Bayesian networks as reported in Table 3.
consistent with the general trends seen in Figure 2, the decision tree provides a predictive model with exact thresholds that predict differences between the groups.
We also created models for the gender and age prediction tasks using the group dataset, the results of which are in the first two rows of Table 4. Overall we have much more group data (10,730 records) than average user data (111 users), so it is not surprising that these models often performed better than the user models, particularly when noting the differences in AUC. Again, the decision trees provide insight as to which attributes are most helpful. In the first decision tree we found that once again men were charac-terized by lower usage levels, used WhatsApp less for family communication, and had shorter messages. Within the age classification task, we found that younger people sent files less frequently than older people and were less likely to use WhatsApp for family and work communication. While the attribute AvgMsgSent played prominently in the classification task from the user dataset, this attribute was absent from the group dataset because average statistics for a user are not evident from a group’s profile. Nonetheless, the group statistics proved to be even more helpful in building age and gender models.8
We also built models that predicted group usage characteristics, the results of which are also found in Table 4. Specifically, we built models to predict which groups will contain file attachments in at least 1% of all messages (row 3), which participants will have more than 25% of their messages sent between 5:00 a.m. and 9:00 a.m. (row 4), which messages are characteristic of groups with five or more users (row 5), which participants will average at least a total of five messages sent or received per day (row 6),which messages will on average contain short texts with five or fewer words in at least 75% of all messages (row 7), and which participants will receive responses to at least 25% of all messages within one minute (row 8). In general, these models were much more successful than the baseline values, with AUC values often above 0.8. However, some exceptions do exist. Note that predicting age based on group activity was not successful within the decision tree model with an AUC value of below 0.5 (0.36). Nonetheless, even here the Bayesian model was more successful, with an accuracy nearly 30% greater than the baseline and an AUC above 0.5. The logistic regression models based on all data are meant to provide another comparison. Notably, the confidence intervals point towards the models here being general (i.e., even the lower bound of the AUC confidence intervals are always above 0.7).
The thresholds used in this task were meant to be representative of groups that are more active in the morning and have shorter messages and shorter response times. We did in fact check other tasks, such as classifying the prediction of which messages were
sent later at night and in larger groups. We also created models considering different thresholds for the group sizes and response times, as well as for other tasks. Overall, we found that the data similarly supported prediction beyond the specific thresholds reported in this paper. Important future work includes considering additional tasks and thresholds beyond those considered in this paper.
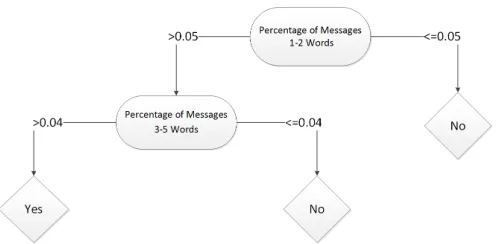
Figure 7: Decision tree predicting if one quarter of the messages are answered within one minute based on group data
Note: Here, the affecting measures are the percentage of messages of one or two words out of the total and of three to five words out of the total.
7. Conclusions and future work
This work represents the first exhaustive analysis of WhatsApp messages. We collected over 6 million encrypted messages from over 100 students between the ages of 18 to 34, and differentiated between different types of user and group use of the network. A key characteristic of this study is that storing encrypted messages prevented us from analyzing any content within the messages. This was done intentionally to safeguard participants’ privacy. Despite this limitation, we found that many message and group characteristics significantly differed across users of different demographics, such as gender and age, and present these results through performing extensive statistical analysis. Additionally, we believe that one key novelty of this work is that we use data analytics to predict the users’ gender, age, and group activity. Our work is data driven, so we based our findings on the algorithms’ output. We did not attempt to verify any specific thesis, as had been done previously. This is one key advantage of using data analytics, and this difference is especially clear from the decision tree results presented in this paper.
Overall, our results provide several new insights into WhatsApp usage. We find that the younger users in this dataset used this network more frequently. We also find that more years of education and age are positive factors in predicting how frequently people send file attachments. Overall, women use this network more often than men, and they reported that they use it more often to both generally communicate and to communicate with family. Men, on the other hand, are generally members of larger communication groups and send shorter messages. Additionally, larger groups are defined not only by their large number of users, or even the large numbers of messages that are frequently sent, but also are typically defined as having shorter messages than those in private one-to-one communications. Decision tree models were not only helpful in identifying these attributes but were useful in providing the thresholds within the if–then rules for the models that predicted these results. Because our results are built through analyzing users’ general message data, but without message content, we believe that the methodology used in our analysis may be of general interest to other groups, such as demographers and government bodies to facilitate data analysis without infringing on users’ privacy.
within five minutes or 30 seconds, in contrast to the threshold of one minute presented in this paper. In a related matter, while we intentionally built models without analyzing user content in order to safeguard privacy, even more accurate models might be built in the future if user consent could be obtained for this information. We are hopeful that researchers will build upon this study and perform additional analyses both within this dataset and other, possibly larger, WhatsApp datasets.
References
Argamon, S., Koppel, M., Pennebaker, J.W., and Schler, J. (2009). Automatically pro-filing the author of an anonymous text. Communications of the ACM52(2): 119–123.
doi:10.1145/1461928.1461959.
Bakshy, E., Rosenn, I., Marlow, C., and Adamic, L. (2012). The role of social networks in information diffusion. In: Mille, A., Gandon, F.L., Misselis, J., Rabinovich, M., and Staab, S. (eds.).Proceedings of the 21stInternational Conference on World Wide Web. New York: ACM: 519–528.doi:10.1145/2187836.2187907.
Bouhnik, D. and Deshen, M. (2014). WhatsApp goes to school: Mobile instant mes-saging between teachers and students. Journal of Information Technology Education: Research13: 217–231.doi:10.28945/2051.
Church, K. and de Oliveira, R. (2013). What’s up with WhatsApp? Comparing mobile instant messaging behaviors with traditional SMS. In: Rohs, M., Schmidt, A., Ash-brook, D., and Rukzio, E. (eds.).Proceedings of the 15thInternational Conference on Human-Computer Interaction with Mobile Devices and Services. New York: ACM: 352–361.
Fan, W., Wallace, L., Rich, S., and Zhang, Z. (2006). Tapping the power of text mining.
Communications of the ACM49(9): 76–82.doi:10.1145/1151030.1151032.
Fiadino, P., Schiavone, M., and Casas, P. (2014). Vivisecting WhatsApp through large-scale measurements in mobile networks. Paper presented at SIGCOMM, Chicago, USA, August 17–22, 2014.doi:10.1145/2619239.2631461.
Gulacti, U., Lok, U., Hatipoglu, S., and Polat, H. (2016). An analysis of WhatsApp usage for communication between consulting and emergency physicians.Journal of Medical Systems40(130): 1–7. doi:10.1007/s10916-016-0483-8.
Jain, J., Eddy Luaran, J., and Rahman, N.b.A. (2016). Learning beyond the walls: The role of WhatsApp groups. In: Luaran, J.E., Sardi, J., Aziz, A., and Alias, N.A. (eds.).
Envisioning the future of online learning: Selected papers from the International Con-ference on e-Learning 2015. Singapore: Springer: 447–457. doi:10.1007/978-981-10-0954-9 40.
Johnston, M., King, D., Arora, S., Behar, N., Athanasiou, T., Sevdalis, N., and Darzi, A. (2015). Smartphones let surgeons know WhatsApp: An analysis of communi-cation in emergency surgical teams. American Journal of Surgery 209(1): 45–51.
doi:10.1016/j.amjsurg.2014.08.030.
doi:10.1037/0022-3514.74.3.686.
Lin, Y.H., Lin, Y.C., Lee, Y.H., Lin, P.H., Lin, S.H., Chang, L.R., Tseng, H.W., Yen, L.Y., Yang, C.C.H., and Kuo, T.B.J. (2015). Time distortion associated with smartphone addiction: Identifying smartphone addiction via a mobile application (App). Journal of Psychiatric Research65: 139–145. doi:10.1016/j.jpsychires.2015.04.003.
Montag, C., Błaszkiewicz, K., Sariyska, R., Lachmann, B., Andone, I., Trendafilov, B., Eibes, M., and Markowetz, A. (2015). Smartphone usage in the 21stcentury: Who is active on WhatsApp? BMC Research Notes8(1): 1–6. doi:10.1186/s13104-015-1280-z.
Mudliar, P. and Rangaswamy, N. (2015). Offline strangers, online friends: Bridging classroom gender segregation with WhatsApp. In: Begole, B., Kim, J., Inkpen, K., and Woo, W. (eds.).Proceedings of the 33rd Annual ACM Conference on Human Factors
in Computing Systems. New York: ACM: 3799–3808. doi:10.1145/2702123.2702533.
Naveed, N., Gottron, T., Kunegis, J., and Alhadi, A.C. (2011). Bad news travel fast: A content-based analysis of interestingness on Twitter. In: De Roure, D. and Poole, M.S. (eds.). Proceedings of the 3rd International Conference on Web Science. New York: ACM: 8:1–8:7.doi:10.1145/2527031.2527052.
O’Hara, K.P., Massimi, M., Harper, R., Rubens, S., and Morris, J. (2014). Ev-eryday dwelling with WhatsApp. In: Fussell, S.R., Lutters, W.G., Morris, M.R., and Reddy, M. (eds.). Proceedings of the 17th ACM Conference on Computer
Sup-ported Cooperative Work and Social Computing. New York: ACM: 1131–1143.
doi:10.1145/2531602.2531679.
Pielot, M., de Oliveira, R., Kwak, H., and Oliver, N. (2014). Didn’t you see my message? predicting attentiveness to mobile instant messages. In: Jones, M., Palanque, P.A., Schmidt, A., and Grossman, T. (eds.). Proceedings of the SIGCHI Conference on Human Factors in Computing Systems. New York: ACM: 3319–3328.
doi:10.1145/2556288.2556973.
Quinlan, J.R. (1996). Improved use of continuous attributes in C4.5.Journal of Artificial Intelligence Research4: 77–90.doi:10.1613/jair.279.
Robin, X., Turck, N., Hainard, A., Tiberti, N., Lisacek, F., Sanchez, J.C., and M¨uller, M. (2011). pROC: An open-source package for R and S+ to analyze and compare ROC curves.BMC Bioinformatics12: 77. doi:10.1186/1471-2105-12-77.
Thelwall, M., Wilkinson, D., and Uppal, S. (2010). Data mining emotion in social net-work communication: Gender differences in MySpace. Journal of the Association for Information Science and Technology61(1): 190–199. doi:10.1002/asi.21180.
Information Technology6(2): 129–140.doi:10.1023/B:ETIN.0000047476.05912.3d.
Wagner, C., Garcia, D., Jadidi, M., and Strohmaier, M. (2015). It’s a man’s Wikipedia? Assessing gender inequality in an online encyclopedia. Paper presented at the 9th
In-ternational AAAI Conference on Web and Social Media, Oxford, UK, May 26–29, 2015.
Wang, Y.C., Burke, M., and Kraut, R.E. (2013). Gender, topic, and audience response: An analysis of user-generated content on Facebook. In: Mackay, W.E., Brewster, S.A., and Bødker, S. (eds.).Proceedings of the SIGCHI Conference on Human Factors in Computing Systems. New York: ACM: 31–34. doi:10.1145/2470654.2470659.
Witten, I.H. and Frank, E. (2005). Data mining: Practical machine larning tools and techniques. Burlington: Morgan Kaufmann.