*
Corresponding author: [email protected] 78
Predicting the Coefficients of the Daubert and Danner Correlation
Using a Neural Network Model
K. Movagharnejad1*, F. Saffar2
1
Faculty of Chemical Engineering, Babol Noshiravani University of Technology, Babol, Iran 2
Department of Chemical Engineering, Shomal University, Amol, Iran
ARTICLE INFO ABSTRACT
Article history:
Received: 2017-05-21
Accepted: 2018-05-23
In the present research, three different architectures were investigated to predict the coefficients of the Daubert and Danner equation for calculation of saturated liquid density. The first architecture with 4 network input parameters, including critical temperature, critical pressure, critical volume, and molecular weight, the second architecture with 6 network input parameters, including the ones in the first architecture with acentric factor and compressibility factor. The third architecture contains 12 network input parameters, including 6 input parameters of the second architecture, and 6 structural functional groups of different hydrocarbons. The three different architectures were trained and tested with the 160 sets of Daubert and Danner coefficients gathered from the literature. The trained neural networks were also applied to 15 un-known hydrocarbons, and the outputs (Daubert and Danner coefficients) were used to predict the saturated liquid densities. The calculated liquid densities were compared with the experimental values. The Results indicated that the coefficients obtained from the second architecture produced more precise values for the liquid densities of the 15 selected hydrocarbons.
Keywords:
Density, Modeling, Neural Networks,
Structural Decomposition, Daubert and Danner Equation
1.Introduction
Prediction of thermodynamic properties of pure and mixed fluids, such as vapor pressure, density, surface tension, etc., is a very important task in many industrial processes such as petrochemical, medicine, and chemical industries [1]. However, there are not always adequate physical and chemical properties of pure materials or mixtures under different thermodynamic conditions. Density of liquids is considered as one of the most important thermodynamic properties.
Iranian Journal of Chemical Engineering, Vol. 15, No. 2 (Spring 2018) 79 al. predicted the viscosity of six refrigerants
using neural network [4]. Kuhne et al. applied neural network to estimate the vapor pressure of hydrocarbons [5]. In another research performed by Moosavi et al., the density of short- and long-chain alkanes at high pressure and temperature was evaluated using artificial neural network method [6]. Moghadassi et al. presented a model based on artificial neural network to predict the density of sulfur dioxide [7]. Many models of neural networks were used to evaluate the thermodynamic properties [8-12]. A comprehensive review of using neural networks for estimation of different thermodynamic properties, such as boiling point, critical temperature, critical pressure, vapor pressure, thermal capacity, evaporation enthalpy, and density, was presented by Taskinen [13]. Considering the complicated nonlinear dependency of the liquid density on the temperature, artificial neural network may be considered a proper method for the modeling of these systems [8]. Of course, many empirical correlations have been developed before the spread of the neural networks and other soft computing methods; in recent years a brief description of them may be found elsewhere [14]. One of the most adequate empirical correlations is used for prediction of the saturated liquid density. The main problem which prevents the wide usage of this correlation is the lack of a precise and applied method to predict the mainly empirical coefficients. In other words, if there were empirical coefficients, this correlation would be your first choice for prediction of the saturated liquid density; therefore, if there are no coefficients, other choices should be considered.
Since it is not possible to predict all of these coefficients by means of a simple correlation, this study aims to develop an artificial neural
network model to predict the Daubert and Danner coefficients in order to estimate the saturated liquid density of different hydrocarbons. Of note, when the saturated liquid density data are available, it is simple to correlate the above-mentioned coefficients by means of common regression techniques. However, the real application of this method is to the cases with no or insufficient experimental data. Once the neural network is trained, it can be easily used to produce the Daubert and Danner coefficients, known as one of the most precise methods to estimate saturated liquid density.
A description of the neural network is given in the next section; then, the data bank used for training and testing the network is presented. In the third section, the structure of the model is described; finally, the obtained results are discussed.
2. Modeling
2.1. Artificial neural network
80 Iranian Journal of Chemical Engineering, Vol. 15, No. 2 (Spring 2018) perceptron neural network (MLP) is selected
as the desired neural architecture used in this work. This architecture is called a feedforward artificial neural network describing the input data based on an appropriate set of outputs. MLP is able to discover the complicated and nonlinear problem [18]. To create an ANN model, the input data sets should be divided into three different sections: training, validation, and testing [19-20]. Many types of neural networks exist which are classified as feedforward and feedback based on the type of network. However, the structures of these artificial neural networks are similar, consisting of similar elements such as nodes, layers, and connections. However, some of these networks, such as multi-layer perceptron and neural network, are more likely to be based on radial functions [16]. The design and establishment of each network has two main steps: training and testing. In order to use neural networks, the network should first be trained. Training a networks is actually a step-by-step process for obtaining the model parameters such as weight factors and biases. In fact, the training process is known to optimize the ANN parameters with respect to input data through a repetitive procedure [13].
2.2. Experimental data
The first step in developing a neural network model is the establishment of a data bank of valid experimental data, which is necessary for training and testing the network. The known coefficients of 160 hydrocarbons [21] were used to design and optimize the neural network; however, since the ultimate goal of this research is to provide a method to predict the saturated liquid density, a total of 15 hydrocarbons (169 data) with unreported
Daubert and Danner coefficients are selected to show the applicability of the presented method. These data were gathered from different sources listed in Table 1. The optimized network was used to predict the Daubert and Danner coefficients of these 15 hydrocarbons. As these 15 compounds were not used in the training and testing of the network, the outputs might be used to predict the saturated liquid density and compare with the experimental data. Due to the scattering of input and output data before training the network, the inputs and outputs of the network should be normalized. In this study, the normalization was performed between 0 and 1.
2.3. Network specifications
Iranian Journal of Chemical Engineering, Vol. 15, No. 2 (Spring 2018) 81 three-layer neural network for the first,
second, and third architectures was
determined, as listed in Table 2.
Table 1
The properties of 15 testing hydrocarbons.
Ref. Acentric factor Crit. Comp. factor Crit. Vol.
(cm3/mol) Crit. Pre. (bar) Criti. temp (K) Mol Wt. Density
(kmol/dm3) Temperature (K) No. of data Component [24] 0.2002 0.274 255 37.96 425.12 58.1222 11.595_7.8141 200_380 13 Butane [28] 0.1845 0.278 241 40.2 419.5 56.106 12.257_7.7513 210_390 13 1-butene [22] 0.2019 0.272 234 42.1 435.5 56.106 12.868_11.441 200_395 14 Cis-2- butane [23] 0.2176 0.274 238 41.0 428.6 56.106 11.146_7.9376 215_395 13 Trans-2- butane [28] 0.2081 0.273 308 40.8 553.8 84.156 9.2862_8.1009 290_390 11 Cyclohexane [26] 0.3013 0.266 371 30.25 507.6 86.175 8.5066_6.5194 210_390 14 Hexane [29] 0.2791 0.270 368 30.4 497.7 86.175 8.5239_6.5643 200_380 10 2-methyl pentane [30] 0.1835 0.278 259 36.4 407.8 58.122 11.231_6.8650 205_385 13 2-methyl propane [28] 0.1948 0.275 239 40.0 417.9 56.106 12.246_7.7041 210_390 13 2-methyl propene [28] 0.4367 0.258 524 24.28 593.1 126.239 5.9249_5.0496 240_380 8 1-nonane [28] 0.3996 0.256 486 24.9 568.7 114.229 6.5193_5.5097 240_380 8 Octane [25] 0.1523 0.276 200 42.48 369.83 44.096 13.834_9.3403 205_340 10 Propane [28] 0.1376 0.281 185 46.0 364.85 42.080 14.922_9.4631 210_345 10 Propylene [22] 0.2640 0.264 316 41.08 591.75 92.138 10.349_8.4979 200_380 10 Toluene [27] 0.3495 0.261 428 27.4 540.2 100.202 7.5549_5.9995 205_385 10 Heptane Table 2
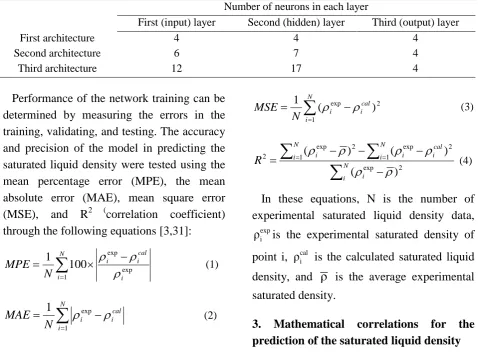
The optimized number of neurons for different ANN architectures.
Number of neurons in each layer
First (input) layer Second (hidden) layer Third (output) layer
First architecture 4 4 4
Second architecture 6 7 4
Third architecture 12 17 4
Performance of the network training can be determined by measuring the errors in the training, validating, and testing. The accuracy and precision of the model in predicting the saturated liquid density were tested using the mean percentage error (MPE), the mean absolute error (MAE), mean square error (MSE), and R2 (correlation coefficient) through the following equations [3,31]:
∑
= − × = N i i cal i i N MPE 1 exp exp 100 1 ρ ρ ρ (1)∑
= − = N i cal i i N MAE 1 exp 1 ρρ (2)
∑
= − = N i cal i i N MSE 1 2 exp ) (1 ρ ρ
(3)
∑
∑
∑
− − − − = = = N i i N i N i cal i i i R 2 exp 1 1 2 exp 2 exp 2 ) ( ) ( ) ( ρ ρ ρ ρ ρ ρ (4)In these equations, N is the number of experimental saturated liquid density data,
exp i
ρ is the experimental saturated density of
point i, ρ is the calculated saturated liquid cali
density, and ρ is the average experimental
saturated density.
82 Iranian Journal of Chemical Engineering, Vol. 15, No. 2 (Spring 2018) One of the first empirical correlations was
presented by Rackett [32]. In 1970, Rackett proposed Eq. (5) was used for calculating the saturated liquid density:
1 ) 1 ( ] [ 7 2 − −
= Tr
C CZ
V
ρ (5)
where Vc is the critical volume, Zc is the
critical compressibility factor, Tr is the
reduced temperature, and Tc is the critical
temperate. In Eq. (5), Tr is given as follows:
C r
T T
T = (6)
The Rackett equation is often written as follows [32]: ] ) 1 ( 1 [ 7 2 C T T C C C S Z P RT
V = + − (7)
where Vs is the specific volume of saturated
liquids. The Rackett equation may be re-written for the estimation saturated liquid density in the following form:
) 1 ( 7 2 ) ( τ ρ= − + C C C Z P RT (8)
where τ is:
r
T
− =1
τ (9)
The Rackett equation has been modified by several researchers to give more precise results.
In 1997, Daubert and Danner [21] changed the physical quantities and replaced the coefficients of Rackett equation with 4 adjustable parameters:
A
B
V
D C T S/
] ) 1 ( 1 [+ −=
(10)It is reported that the Daubert and Danner equation has higher precision, compared to other classical methods. However, the lack of coefficients is considered as a drawback which can be fixed with the aid of neural network. Regression constants A, B, C, and D are determined from linear regression of existing data, while C corresponds to critical temperature. Specific volume of the liquid is linearly reducing from triple point to the normal boiling point and nonlinearly to critical density (reverse critical volume). The Daubert and Danner equation for prediction of saturated liquids density is presented in the following form:
] ) 1 ( 1 [ D C T B A − + =
ρ
(11)4. Results and discussion
Iranian Journal of Chemical Engineering, Vol. 15, No. 2 (Spring 2018) 83
Figure 1. Mean absolute error of training, evaluating, and testing datasets for the first ANN architecture.
Figure 2. Mean absolute error of training, evaluating, and testing datasets for the second ANN architecture.
84 Iranian Journal of Chemical Engineering, Vol. 15, No. 2 (Spring 2018) The continuous reduction of the mean
absolute error indicates the progress of the learning process. The curve is composed of three lines corresponding to the error in training, evaluating, and testing sets. The evaluation set is used to maintain the generality of the network. The training routine continues until the error of the network is decreased for the evaluation set.
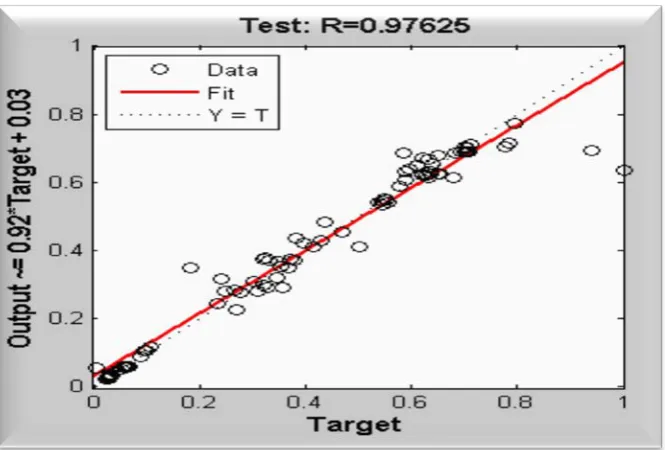
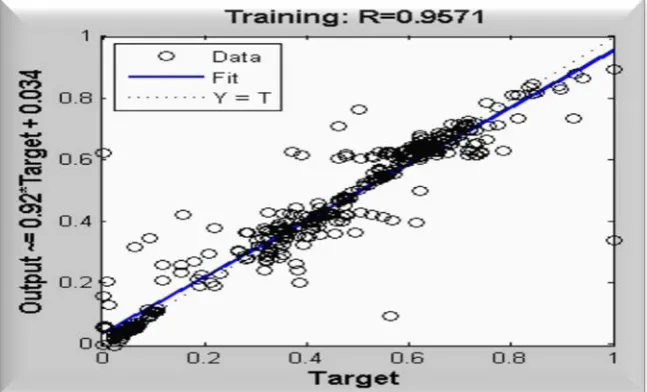
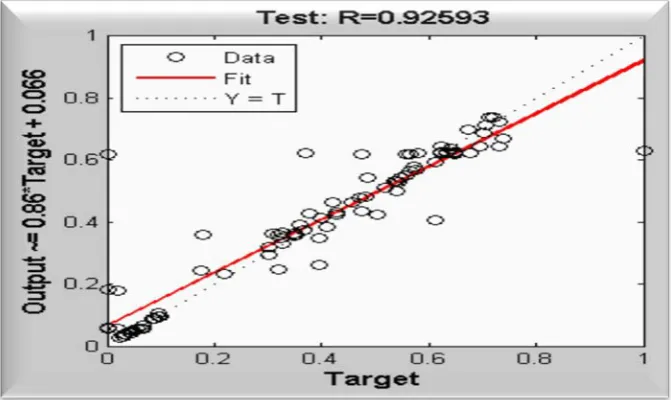
As a result, the pre-processing of the networks on the training set can be avoided. The predicted coefficients of the neural network, in comparison to the Daubert and Danner coefficients, in the training and testing stages of hydrocarbons in different architectures are illustrated in Figures 4 to 9 and show good agreement.
Figure 4. Comparison of the predicted and training target values for the first ANN architecture.
Iranian Journal of Chemical Engineering, Vol. 15, No. 2 (Spring 2018) 85
Figure 6. Comparison of the predicted and training target values for the second ANN architecture.
Figure 7. Comparison of the predicted and testing target values for the second ANN architecture.
86 Iranian Journal of Chemical Engineering, Vol. 15, No. 2 (Spring 2018)
Figure 9. Comparison of the predicted and testing target values for the third ANN architecture.
These figures indicate that the predicted values by the neural network are close to the reported values. Figures 4, 6, and 8 demonstrate that the data are well trained in the network, while Figures 5, 7, and 9 showed that the network presented significant performance for new data.
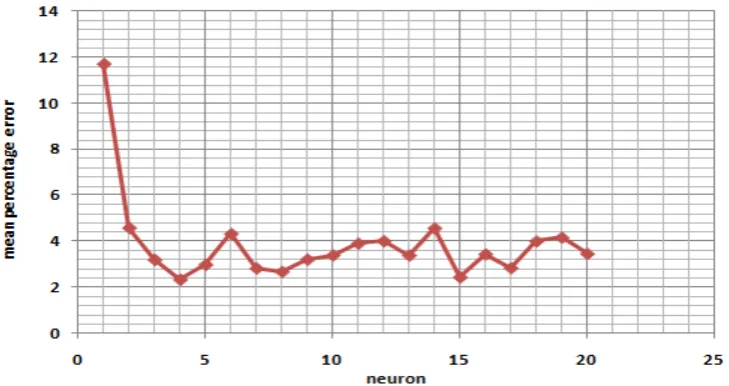
After predicting the coefficients (A, B, C, and D) with neural network, saturated liquid density was calculated using Daubert and Danner equation and compared with the experimental data. Error analysis and the different coefficients of determination of neural networks are summarized in Table 3. Figures 10 to 12 show the variation of mean
percentage error of three ANN architectures vs the number of neurons in the hidden layer. In figures 10 to 12, the changes of 1 to 20 neurons in the hidden layer of the neural network with the logsig-purelin transfer functions are shown. According to these figures, the most accurate structures for the first, second, and third architectures include 17, 4, and 7 neurons in the hidden layer, respectively. The mean percentage errors (MPE) of the three optimized architectures are reported to be 2.63, 2.33, and 3.6, respectively. This fact proves the relative accurate prediction of the Daubert and Danner coefficients.
Table 3
Error analysis and coefficient of determination for different architectures.
NO. of Neurons
1st Architecture 2nd Architecture 3rd Architecture
MPE MAE R2 MPE MAE R2 MPE MAE R2
Iranian Journal of Chemical Engineering, Vol. 15, No. 2 (Spring 2018) 87
Figure 10. The mean percentage error vs no. of neurons in the hidden layer for the first ANN architecture.
Figure 11. The mean percentage error vs no. of neurons in the hidden layer for the second ANN architecture.
88 Iranian Journal of Chemical Engineering, Vol. 15, No. 2 (Spring 2018)
5. Conclusions
The ability of the neural networks to predict the coefficients in order to estimate the saturated liquid density using the Daubert and Danner equation was investigated. The accurate determination of the liquid densities plays an important role in industrial processes and academic research. In this regard, obtaining an appropriate procedure to calculate the saturated liquid density has always been controversial, and many researchers have attempted to find it. In this research, three different neural network architectures were used to predict the Daubert and Danner coefficients. In the first architecture with 4 input variables of molecular weight, critical temperature, critical pressure and critical volume, the mean percentage error of 2.6693 was achieved, while, for the second architecture, by adding other parameters, such as acentric and critical compressibility factors, mean percentage error of 2.3200 was obtained. For the third architecture with 12 parameters involving the input of the first mode combined with structural decomposition of elements, a mean percentage error of 3.4692 was achieved, showing the increased error deviation. Contrary to the impression that increasing the number of input parameters should enhance the performance of the network, such a result was not observed. In fact, the precision of the network appears to depend on the type of parameters. For example, this research showed that the molecular weight, critical properties, acentric and critical compressibility factors can influence prediction of the Daubert and Danner coefficients and the saturated liquid density. Results of the research demonstrate that artificial neural network can be considered for predicting the saturated liquid density. In
addition, by applying the network, the values of un-known coefficients could be predicted without using the experimental data, and the main weak point of the Daubert and Danner equation could be resolved.
References
[1] Rohani, A. A., Pazuki, G., Abedini, H., Seyfi, S. and Vossughi, M., “Comparison between the artificial neural network system and SAFT equation in obtaining vapor pressure and liquid density of pure alcohols”, Expert Systems with Applications, 38 (3), 1738(2011).
[2] Nguyen, V. D., Tan, R. R., Brondial, Y. and Fuchino, T., “Prediction of vapor-liquid equilibrium data for temary system using artificial neural networks”, J. Fluid Phase Equilibria, 254, 188 (2007). [3] Lashkarbolooki, M., Shafipour, Z. S.,
Zeinolabedini Hezave, A. and Farmani, H., “Use of artificial neural networks for prediction of phase equilibria in the binary system containing carbon dioxide”, J. Supercritical Fluids, 75, 144 (2013).
[4] Ghaderi, F., Ghaderi, A. H., Najafi, B. and Ghaderi, N., “Viscosity prediction by computational method and artificial neural network approach: the case of six refrigerant”, J. Supercritical Fluids, 81, 67 (2013).
[5] Kuhne, R., Uweebert, R. and Schuurmann, G., “Estimation of vapor pressure for hydrocarbons and halogened hydrocarbons from chemical structure by a neural network”, Chemosphere, 34, 671 (1997).
Iranian Journal of Chemical Engineering, Vol. 15, No. 2 (Spring 2018) 89 contribution method up to high
temperatures and pressures”, J. Thermochimica Acta, 556, 89 (2013). [7] Moghadassi, A., Nikkholgh, M.,
Hosseini, S. M. and Parvizian, F., “Estimation of vapor pressures, compressed liquid, and supercritical densities for sulfur dioxide using artificial neural networks”, International J. Industrial Chemistry, 4, 1 (2013). [8] Lazzus, J. A., “𝜌𝜌-T-P prediction for ionic
liquids using neural network”, J. Taiwan Inst. Chem. Eng., 40, 213 (2009).
[9] Yaffe, D. and Cohen, Y., “Neural network based temperature-dependent quantitative structure property relations (QSPRs) for predicting vapor pressure of hydrocarbons”, J. Chem. Inf. Comput. Sci., 41, 463 (2001).
[10]Espinoza, G., Yaffe, D., Arenas, A., Cohen, Y. and Giralt, F., “A fuzzy ARTMAP-based quantitative structure−property relationship (QSPR) for predicting physical properties of organiccompounds”,J. Ind.Eng.Chem. Res., 40,2757 (2001).
[11]Espinoza, G., Yaffe, D., Cohen, Y., Arenas, A. and Giralt, F., “Neural network based quantitative structure property relations (QSPRs) for predicting boiling points of aliphatic hydrocarbons”, J. Chem. Inf. Comput. Sci., 40, 859 (2000).
[12]Lazzus, J. A., “Predition of solid vapor pressures for organic and inorganic compounds using a neural network” , J. Thermochimia Acta, 489, 53 (2009). [13]Taskinen, J., and Yliruusi, J., “Prediction
of physicochemical properties based on neural network modeling”, J. Adv. Drug Deliv. Rev., 55, 1163 (2003).
[14]Reid, R. C., Prausnitz, J. M. and Poling,
B. E., The properties of gases and liquids, McGraw-Hill, New York, (1987).
[15]Kuan, C. M. and White, H. “Artificial neural networks: An econometric perspective”, Econometric Reviews, 13,1 (1994).
[16]Movagharnejad, K. and Nikzad, M. “Modeling of tomato drying using artificial neural network”, J. Computers and Electronics in Agriculture, 59, 78 (2007).
[17]Cybenco, G., “Approximation by superpositions of a sigmoidal function”,
J. Math. Cont. Sig. Syst. (MCSS), 2, 303 (1989).
[18]Arai, Y., “Measurement of isothermal vapor-liquid equilibria for hydrocarbon + monocarboxylic acid binary systems by a flow-type apparatus”. J. Chem. Eng. Data, 45, 857 (2000).
[19]Zhang, G., Patuwo, B. E. and Hu, M. Y., “Forecasting with artificial neural network: The state of art”, International J. Forecasting, 14, 35 (1998).
[20]Rumelhart, D. E. Hinton, G. E. and Williams, R. J., “Learning representations by backpropagation errors”, Nature, 323, 533 (1986).
[21]Daubert, T. E. and Danner, R. P., Physical and thermodynamic properties of pure chemicals: Data complation, Taylor, New York, USA (1989).
[22]Perry, H. R. and Green. W. D., Perry’s chemical engineers handbook, McGraw Hill, (2014).
[23]David, R., CRC Handbook of chemistry and physics, Taylor & Francis, (2007). [24]NIST Standard reference database 15,
90 Iranian Journal of Chemical Engineering, Vol. 15, No. 2 (Spring 2018) Gaithersburg, MD.
[25]Karabulut, E. Ö. and Koyuncu, M., “Neural network-based correlations for the thermal conductivity of propane”, J. Fluid Phase Equilibria, 257, 6 (2007). [26]Friend, D. G., Ely, J. F. and Ingham, H.,
“Thermophysical properties of methane”,
J. Phys. Chem. Ref. Data, 18, 583 (1989).
[27]DIPPR Data compiliation of pure compound properties ASCLL Files, Institute of Science and Technology, Standard Refrence Data, Gaithersburg, MD, 1, 458 Chemicals, Extant, (1995). [28]Vargaftik, N. B., Tables on the
thermo-physical properties of liquids and gases in normal and dissociated states, 2nd edition, Hemisphere, London (1975). [29]Bejarano, A., Quezada, N. and de la
Fuente, J. C., “Complementary vapor
pressure data for 2-methyl-1-propanol and 3-methyl-1-butanol at a pressure range of (15 to 177) kPa”, J. Chem. Thermodynamics, 41, 1020 (2009).
[30]N'Guimbi, J., Berro, C., Mokbel, I., Rauzy, E. and Jose, J., “Experimental vapour pressure of 13 secondary and tertiary alcohols: correlation and prediction by a group contribution method”, J. Fluid Phase Equilibria, 162, 143 (1999).
[31]Karimi, H. and Ghaedi, M., “Simultaneous determination of thiocyanate and salycilate by a combined
UV-spectrophotometric detection principal component artificial neural network”, J. Ann. Chem., 96, 657 (2006). [32]Rackett, H. G., “Equation of state for