University of New Orleans University of New Orleans
ScholarWorks@UNO
ScholarWorks@UNO
University of New Orleans Theses and
Dissertations Dissertations and Theses
8-10-2005
Determining the Crystal Structure of Cellulose III by Modeling
Determining the Crystal Structure of Cellulose III by Modeling
Zakhia Ford
University of New Orleans
Follow this and additional works at: https://scholarworks.uno.edu/td
Recommended Citation Recommended Citation
Ford, Zakhia, "Determining the Crystal Structure of Cellulose III by Modeling" (2005). University of New Orleans Theses and Dissertations. 291.
https://scholarworks.uno.edu/td/291
This Thesis is protected by copyright and/or related rights. It has been brought to you by ScholarWorks@UNO with permission from the rights-holder(s). You are free to use this Thesis in any way that is permitted by the copyright and related rights legislation that applies to your use. For other uses you need to obtain permission from the rights-holder(s) directly, unless additional rights are indicated by a Creative Commons license in the record and/or on the work itself.
DETERMINING THE CRYSTAL STRUCTURE OF CELLULOSE IIII BY MODELING
A Thesis
Submitted to the Graduate Faculty of the University of New Orleans
in partial fulfillment of the requirements for the degree of
Master of Science in
Chemistry Analytical Chemistry
by
Zakhia M. Ford
B.S. Xavier University, 2000
August 2005
Dedication
My thesis is dedicated to my grandmother, Dorothy Moore (Momo), who passed
away January 28, 2005 in her fight against cancer. She lived how she wanted, despite
the pain, until the end. Momo loved me, her family, and everyone else who had the
opportunity to know her. She was one of my biggest supporters throughout my
graduate studies, always telling me how proud she was of me and giving me
encouragement. It has been difficult thinking about her not being here to see my
Acknowledgements
Dr. Alfred D. French gave me the opportunity to learn and appreciate
carbohydrate chemistry and molecular modeling by doing this project. Glenn Johnson
showed me how to perform the MM3 calculations and exposed me to UNIX and similar
operating systems. Dr. Stevens always was helpful in answering challenging questions
and providing support. Elena Graves and Dr. Ralph Berni prepared the cellulose III
sample, and Dr. Paul Langan participated in helpful discussions. The cellulose III
diffraction pattern was recorded at Center for Advanced Microstructure and Devices,
Table of Contents
Abstract ...v
Introduction ...1
Methods ...3
Results and Discussion ...6
Conclusions...15
References...18
Abstract
Recently, a one-chain monoclinic unit cell for Cellulose IIII having a single
glucose in the asymmetric unit was proposed based on high-resolution diffraction
patterns. The new work challenged a two-chain structure published 25 years earlier,
although it did not provide new three-dimensional coordinates. Our goals were to solve
the structure by modeling, find whether modeling would reject the previously determined
two-chain unit cell, and compare the model with the anticipated experimental structure.
Combinations of the O2, O3, and O6 hydroxyls produced 54 starting structures.
Clusters of 13 cellotetraose chains terminated by methyl groups for each of the 54
starting structures were optimized with MM3(96). Hydroxyl groups on 16 of these 54
structures reoriented to give very similar hydrogen-bonding schemes in the interiors,
along with the lowest energies. The one-chain cell models had much lower energy. The
eight best “up” one-chain models agree well with the structure newly determined by
Introduction
Cellulose was the first carbohydrate to be studied by computer modeling. In
1960, Jones1 used standard bond lengths, angles and interatomic distances to
construct models that were used as part of a mostly unsuccessful attempt to solve the
crystal structure of ramie cellulose I from fiber diffraction data. The advantages of the
method were clear, however, and since then, computer models have been an integral
part of most fiber diffraction studies that seek to determine the atomic positions.2
Augmentation of crystal structure determinations by modeling is often necessary
because the small number of diffraction intensities from most fibers is inadequate to
determine the x, y and z coordinates of all unique atoms in the structure. With a
combined approach, diffraction data can provide some guidance and the modeling
energy calculations supply the rest of the information. This approach has been taken to
the logical extreme of attempting to solve structures of small organic molecules by
modeling with no specific experimental data whatsoever.3 Those efforts are as yet not
sufficiently reliable for general use but are at the forefront of modeling development.
As modeling has become more sophisticated, methods for experimental study of
crystalline fibers have also improved. New sources of highly crystalline cellulose have
been identified, and the preparation of films of oriented crystallites allows the use of
these crystallites regardless of their initial lack of orientation4. Neutron diffraction work
has yielded the details of the hydrogen bond networks and very powerful synchrotron
x-ray beams provide more diffraction data than laboratory generators. Together, the new
techniques have resulted in sufficient data that high-resolution, model-free structure
High-resolution structures are now available for cellulose Iα5 and Iβ,6 as well as
cellulose II.7 Most native cellulose is a mixture of the Iα and Iβ structures, with the Iα
form being prevalent in cellulose that is produced by algae and bacteria, whereas Iβ is
dominant in higher plants. The sample for the high-resolution study of cellulose II was
produced by treating native cellulose I from flax with 23% NaOH, followed by rinsing
and drying. Cellulose II can also be prepared by precipitation from solution, as in the
manufacture of rayon, and by bacteria that are either mutants or at low temperature. A
third major form, cellulose III, results from treatment with amines that are subsequently
evaporated or rinsed off. Although their diffraction patterns are similar, subtle
differences distinguish cellulose III that is made starting with cellulose I (IIII) from that
starting with cellulose II (IIIII). Finally, cellulose IV can be prepared by heating the other
forms in glycerol at 260 C°. Recently, Wada et al. proposed that IVI is actually Iβ with
lateral disorder.8
In 2001, Wada et al. proposed that cellulose IIII has a single chain monoclinic unit
cell with P21 symmetry and that the O-6 atoms were in the gt position.9 Those results
contradict a 1976 determination by Sarko et al., who had done a complete analysis
based on limited X-ray diffraction data.10 Their work was based on a two-chain unit cell
and determined the O-6 groups to be in tg orientations. Although the pattern of Wada et
al. has more than 100 intensities, they did not, in that work, attempt to solve the
structure. Instead, the O-6 position was determined by accompanying NMR studies.
Their results presented a unique opportunity. A modeling study could be independently
carried out with an unknown that would inevitably be determined at high resolution. If
higher-quality modeling methods in fiber diffraction studies. These combined methods would
continue to be of use on less-crystalline samples. Of course, a successful prediction
would lend credibility to modeling studies on other materials such as amorphous
cellulose, for which experimental data are limited and more difficult to interpret.
The high-resolution experimental study of cellulose III has now been published,11
and we can also compare those results with ours, which were presented at two
meetings.12
Methods
Given the results from Wada et al. regarding the O-6 position and unit cell
dimensions and symmetry,9 only the hydroxyl group orientations remain as explicit
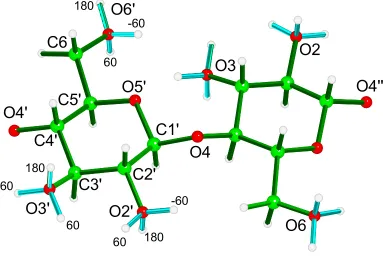
variables. Cellotetraose molecules were constructed with Chem-X with two-fold
screw-axis symmetry and capped with methyl groups at the reducing and non-reducing ends
to prevent the formation of unrealistic hydrogen bonds. The O-2, O-3 and O-6 hydroxyl
groups on the tetraose models were placed in each of the three staggered orientations
(Figure 1), so that they made torsion angles of –60°, 60° and 180° with the H2, H3 and
C1'
C2'
C3'
C4'
C5'
O5'
60 180
-60
180 -60
60
180 60
-60
O4'
O4
O4''
O6
C6
O6'
O3'
O2'
O2
O3
Figure 1. Cellobiose unit with the hydroxyl groups oriented in the 180, -60 and +60 orientations.
These models were placed visually in the unit cell according to Figure 5 in Wada et al.,
in both the “up” and “down” orientations,13,14 for a total of 54 starting models. There was
substantial confidence in the orientation presented by Wada since it was based on the
report by Sarko et al.10 That orientation would depend on the very strong hk0
reflections and is likely to be unaffected by other errors in the determination. Symmetry
operators within Chem-X were used to generate clusters (minicrystals) with 13 chains,
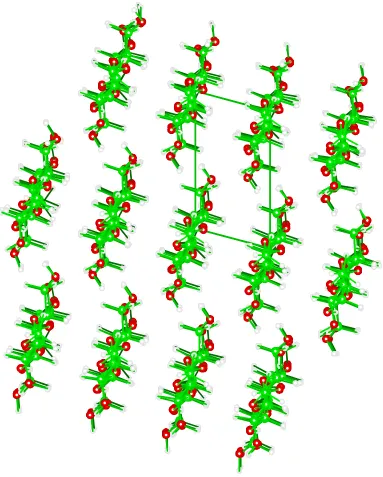
Figure 2. Minicrystal of cellulose III after energy minimization with MM3(96), viewed from above down the long molecular axes, which are parallel to the crystallographic c-axis. At the edges of the minicrystal, there is some visible variation in hydrogen position that resulted from different amounts of atom
The 54 minicrystals were energy minimized with MM3(96), using a dielectric constant of
3.5 and the hydrogen bonding potential from MM3(92). We have found that those
modifications result in better model crystal structures. No constraints, symmetry
operators or periodic boundaries were placed on the structure during minimization. The
plan was to observe the resulting energies and hydrogen bonding schemes and to
select one or more likely structures for comparison with the proposed two-chain
structure from Sarko et al.
The minicrystal method is subject to uncontrolled edge effects16 regarding the
positions of the external atoms. However, it has the advantage that it can provide
energies that are based on a variety of different potential energy functions, including
MM3, which is known to reproduce a number of phenomena related to carbohydrates.
All energies are reported as kcal/mol of the structures in question. Thus, the energies
reported for the tetraose-based minicrystals would be kcal for a mole of minicrystals.
Other energies reported include kcal/mol of hexaose-based minicrystals and kcal/mol of
a layer of cellobiose residues inside the hexaose-based minicrystal. These energies are
reported below simply as kcal.
Results and Discussion
Of the 54 models based on single-chain unit cells, 16 gave total minimized steric
energies that were between 237 and 246 kcal. Eight of these were up models, and the
other eight were down. A second group of 26 had energies between 318 kcal and 367
kcal, and the remaining structures had energies between 407 and 470 kcal. Only the
orientation. That homogeneity is an additional confirmation that the lowest energy group
represents the most likely structures. Table 1 shows that the best up model has an
energy of 237.6 kcal, whereas the best down model has an energy of 236.7 kcal. These
values can be compared to the energy of the minimized, tetramer-based model of Sarko
et al., 340.3 kcal.
Table 1. Energies (kcal) and hydroxyl torsion angles (º) for two central glucose residues from the best tetraose-based models
Model Energy kcal
τ2 τ3 τ6 τ2’ τ3’ τ6’
Starting --- 60 -60 180 60 -60 180
Best Up 237.6 12.2 -47.2 -138.9 12.0 -48.0 -140.0
Best Down 236.7 12.0 -48.0 -139.5 12.2 -47.2 -140.0
Torsion angles were determined for the central cellobiose units in the
minicrystals. Variations in the torsion angles for the hydroxyl groups on the minicrystal
surfaces that result from the different environments than in the minicrystal interior, are
among the edge effects. The different starting orientations lead different surface
orientations and are the main factor responsible for the 9 kcal range of energies within
the group that has the lowest energy. Because the energies are for all 26 cellobiose
residues and 52 methyl groups in the minicrystal, the differences within the
lowest-energy group are small per cellobiose unit. We were reluctant to choose between the
up and down models in the lowest-energy group, given such small energy differences.
The interior hydroxyl groups of the 16 lowest energy structures rotated to nearly
identical orientations during minimization even though they were in model crystal
C5-C6-O6-H torsions were –143±3° regardless of the up or down packing or initial hydroxyl
orientation. For example, the hydroxyl groups on C2 and C2’ rotated from initial values
of 60° to final values near to 12°, a rotation of 48°. Hydroxyl groups on C2 of other
structures in the low-energy group rotated to the same values near 12° starting from
-60°, a rotation of 72°. The corresponding rotations at C3 and C6 of the lowest-energy
structure were more than 107° and more than 40°, respectively. Hydroxyls on C6 atoms
in other structures started at -60° and rotated about 72°. The extents of rotation of the
hydroxyl groups were surprising since they were initially in staggered positions, normally
considered to be energy minima, although nearly eclipsed conformations, such as the
12° torsion for O2H, are fairly common in carbohydrates and cyclitols. Such large
rotations during minimization indicate that the attractiveness of the hydrogen bond
system was so great that the hydroxyl groups overcame energy barriers. The similarity
of the unprimed and primed torsion angles in Table 1 strongly supports the
experimentally determined two-fold screw-axis symmetry.
Unit cell dimensions were assessed based on the interchain distances and
angles. Those that were based on tetramer models were approximately a=4.5±0.09,
b=8.0±0.1, c=10.35±0.03, α=90.1±2, β=90.0±1.0, and γ=105.5±0.4 for the minimized
models. Comparisons with the experimental values listed in Table 2 were satisfactory.
Our minimized version of the model of Sarko et al.10 gave a=10.44, b=7.95, c=10.36,
α=90.3, β=89.8, γ=122.85. Differences from the experimental values in Table 2 were
also considered minor. The slight expansion of the unit cells, particularly along the
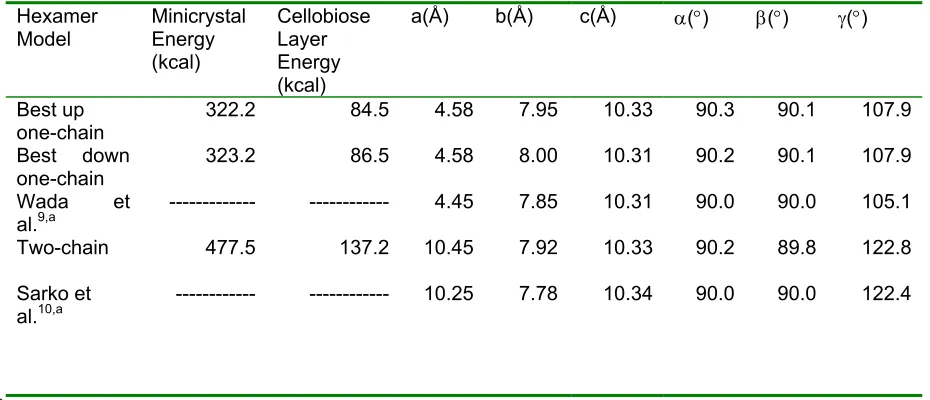
Table 2. Calculated energies and unit cell dimensions of hexamer models.
Hexamer
Model Minicrystal Energy
(kcal)
Cellobiose Layer Energy (kcal)
a(Å) b(Å) c(Å) α(°) β(°) γ(°)
Best up
one-chain 322.2 84.5 4.58 7.95 10.33 90.3 90.1 107.9
Best down one-chain
323.2 86.5 4.58 8.00 10.31 90.2 90.1 107.9
Wada et al.9,a Two-chain Sarko et al.10,a --- 477.5 --- --- 137.2 ---4.45 10.45 10.25 7.85 7.92 7.78 10.31 10.33 10.34 90.0 90.2 90.0 90.0 89.8 90.0 105.1 122.8 122.4
a. Experimentally determined.
Although our lowest-energy values for the tetramer-based models of 237 kcal for
the Wada et al. structure9 and 340 kcal for the Sarko et al.10 structures strongly favored
the single-chain unit cell of Wada et al., there was concern regarding chain-end effects
of unknown magnitude. The central chain in the two-chain model is displaced 0.9 Å
along the c-axis with respect to the corner chains. Therefore, its minicrystal energies
would be susceptible to end effects. In the case of the minicrystals of the one-chain cell,
all chain-ending methyl groups are in planes at the tops and bottoms of the minicrystals.
Because of the shifting in the two-chain cell, its chain ends would not experience the
same degree of stabilization from van der Waals attraction to their neighbors, as would
the coplanar ends in the one-chain cell models. That problem was solved by comparing
the energies of internal cellobiose layers in minicrystals that were built from methylated
cellohexaose molecules. The energies for the cellobiose layer were based on
subtraction of the energies of the best up and down methylated cellotetraose
cellobiose layer energies, which do not have first-order end effects, are shown for the
one- and two-chain cell structures in Table 2, along with the unit cell dimensions of the
models based on the cellohexaose molecules. In this case, the energies of the “up”
structure, both the full hexameric minicrystal and the cellobiose layer in the minicrystal,
were slightly lower than those of its “down” counterpart but considerably lower than
those of the two-chain cell structures.
Table 3 shows the geometries of the hydrogen bonds in which the central
cellobiose unit in the minicrystal is involved, based on the hexameric models. Based on
the criterion that the distance between the donated hydrogen and the acceptor oxygen
atom is < 3.0 Å and the O—H…O angle is > 90°, there are three intramolecular and two
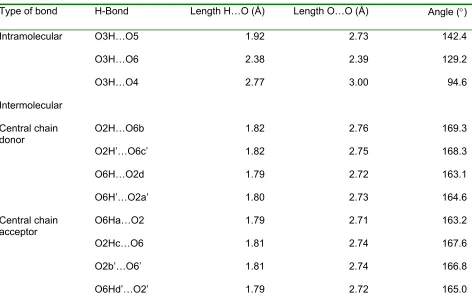
Table 3. Intra - and Intermoleculara hydrogen bonds in best “up” model.
Type of bond H-Bond Length H…O (Å) Length O…O (Å) Angle (°)
Intramolecular O3H…O5 1.92 2.73 142.4
O3H…O6 2.38 2.39 129.2
O3H…O4 2.77 3.00 94.6
Intermolecular
Central chain
donor O2H…O6b 1.82 2.76 169.3
O2H’…O6c’ 1.82 2.75 168.3
O6H…O2d 1.79 2.72 163.1
O6H’…O2a’ 1.80 2.73 164.6
Central chain
acceptor O6Ha…O2 1.79 2.71 163.2
O2Hc…O6 1.81 2.74 167.6
O2b’…O6’ 1.81 2.74 166.8
O6Hd’…O2’ 1.79 2.72 165.0
a. Letters a, b, c and d refer to neighboring glucose residues with the same z-coordinates as the central
residue. See Figure 3.
The intramolecular hydrogen bonds, shown in Figure 3, are typical for β-1,4
linked carbohydrates.17 The proton of the O-3 hydroxyl group is positioned to donate to
the O-5’ atom (see Figure 3) by virtue of the particular φ and ψ linkage torsion angles.
The O-6’ atom also accepts from O3-H. That frequently overlooked interaction stabilizes
the gt position in many related molecules, despite H…O distances that are longer than
are often considered to be hydrogen bonds.18 The third intramolecular interaction in
O3 O5' O4 O6' O6a O6b O2b' O2a' O6c' O6d' O2c O2d O2 O6 O4" O4"
Figure 3. Hydrogen bonding in cellulose IIII. The central cellobiose unit of the minicrystal is shown along
with hydroxyl and hydroxymethyl groups from the four neighboring cellobiose units, a—d. Groups from the a and c chains are in front of the central cellobiose, and those from the b and d chains are behind it. Hydrogen bonds are shown as dashed lines. The O6 and O2 atoms participate in infinite chains of donor…acceptor…donor hydrogen bonds, indicated by the dashed lines that would connect to cellobiose units in front of, or behind, the central cellobiose unit.
Although Table 3 shows four intermolecular hydrogen bonds in which the central
cellobiose is the donor and four hydrogen bonds in which it is the acceptor, there is just
one unique O6-H…O-2 hydrogen bond and one O2-H…O-6 hydrogen bond when there
is actual two-fold symmetry. The near identity of these modeled geometries for the
O6-H…O-2 hydrogen bonds confirms that the two-fold, single chain structure is consistent
with the MM3 force field. The O2-H…O-6 geometries lead to a similar conclusion.
The intermolecular hydrogen bonds participate in “infinite” chains of
donor-acceptor-donor linkages (Figure 3) that have excellent hydrogen bonding geometry.
Such systems have increased strength and shortened interatomic distances because of
the phenomenon of “cooperativity”.19
a-or ma-ore methane hydrogen atoms on the neighba-oring molecules. Figure 4 illustrates the
H…H distances > 3.2 Å for the best up model.
2.36
3.16
2.28
2.50
2.49
2.76
H2
H6
H4
H3 H5 H1
O4' O4'
Figure 4. Two glucose residues from the center of the best up hexameric minicrystal, showing the H…H contacts < 3.2 Å.
Our best “up” model is similar in many respects to the high-resolution structure
very recently published by Wada et al.11 Interestingly, they were able to clearly rule out
the down packing model, while our results were ambiguous on that point. The
conformations of the primary alcohol groups in the experiment and model were 44° and
59°, respectively. Despite that difference, the resulting positions of the O-6 hydroxyl
hydrogens are quite similar. The biggest difference is in the positions of the two protons
attached to C-6. These relationships are shown in Figure 5, in which the central
cellobiose unit from the hexaose-based up minicrystal is fitted to a cellobiose unit
generated from the coordinates of Wada et al.11 The root mean square difference
Figure 5. Superimposed cellobiose units from the experimental structure of Wada et al.11 and the best up model. The root mean square fit for the ring atoms and central linkage oxygen is 0.1 Å.
In the high-resolution structure of Wada et al.,11 there was one slight ambiguity
regarding the direction of the infinite cooperative hydrogen bonding network. Although
their final result was quite similar to ours, they also considered an alternative that
reversed the direction of the donor and acceptor hydroxyl groups. In the agreed upon
network, our O-2 hydroxyls have 12° torsion angles, nearly eclipsing the C2-H hydrogen
atoms. In the alternative network structure, the O2-H atoms are oriented anti to the
C2-H hydrogens. Experimentally, this ambiguity arises because of the difficulty in
precisely locating the proton between two oxygen atoms. If it is closer to O-2, then it is
taken to be covalently bonded to O-2 and hydrogen-bonded to O-6, and vice versa. In a
structural or modeling sense, direction of the hydrogen bonding in an infinite network is
expressed by the rotational orientation of the hydroxyl groups. The modeling results
were less ambiguous, because the various torsional and other steric terms in the force
minicrystals having the alternative hydrogen-bonding scheme fell into the second
lowest-energy group.
To understand why Sarko et al. proposed a two-chain structure, we reviewed
their published (as supplementary data) crystallographic information and recorded a
fiber diffraction pattern of ramie cellulose III prepared by the method of Calamari et al.20
All of the diffraction spots on our low-resolution pattern could be indexed with the
one-chain cell. All but two of their first-layer line spots (d-spacings = 2.78 Å and 2.55 Å could
also be indexed with the one-chain cell. Those spots were not visible on our pattern.
Their published pattern does not permit a close analysis, but one plausible explanation,
that traces of cellulose I remained, is not likely because there is no 2.78 Å observed hk1
spacing from cellulose I.21 It appears that Sarko et al. assumed that there were two
chains in the cell. Ironically, Sarko and Muggli had earlier discussed a one-chain unit
cell for cellulose I before the distinction between cellulose Iα and Iβ was understood.22
In any case, the synchrotron fiber diffraction pattern by Wada et al. produced 114
reflections that were indexed by the proposed one-chain monoclinic unit cell, compared
to Sarko’s 23 reflections. The cell based on the larger number of reflections should
overrule one based on so many fewer spots.
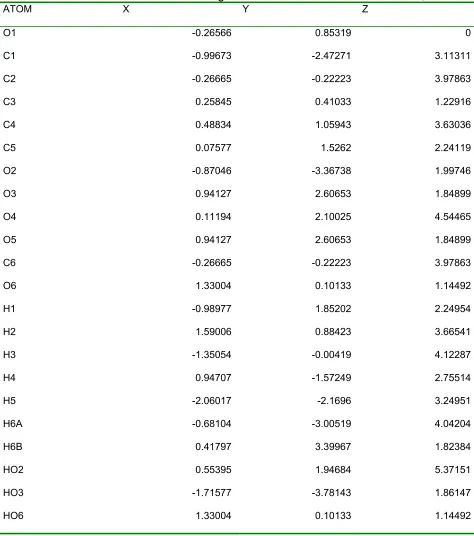
Conclusions
Our molecular modeling study of cellulose IIII concurs that the unit cell of Wada
et al. is the more probable. However, our best up and down models show very small
bond geometries. Therefore, either model could correspond to the structure of cellulose
IIII. The final modeled coordinates are listed in Table 4.
Table 4. Atomic coordinates of modeled glucose monomer of up cellulose IIII.
ATOM X Y Z
O1 -0.71816 -0.47776 0
C1 0.09394 -0.31254 1.18442
C2 0.02125 0.437675 3.95203
C3 0.17484 1.163885 1.56558
C4 0.78402 1.291385 2.95526
C5 -0.60447 -1.11374 2.28449
O2 0.11186 -0.91633 3.51355
O3 0.66243 2.659555 3.38147
O4 1.05624 1.845775 0.66098
O5 0.00193 -0.88592 3.52615
C6 -0.55335 -2.60868 1.99386
O6 -1.16506 -3.30932 3.08837
H1 -1.03905 0.776125 4.0573
H2 1.85235 0.975965 2.93495
H3 -0.84086 1.626185 1.54619
H4 1.11733 -0.72801 1.03337
H5 -1.66645 -0.78826 2.39873
H6A 0.49943 -2.94572 1.85343
H6B -1.10775 -2.85088 1.05616
HO2 1.52256 3.059395 3.31848
Table 5. Atomic coordinates of modeled glucose monomer of down cellulose IIII.
ATOM X Y Z
O1 -0.26566 0.85319 0
C1 -0.99673 -2.47271 3.11311
C2 -0.26665 -0.22223 3.97863
C3 0.25845 0.41033 1.22916
C4 0.48834 1.05943 3.63036
C5 0.07577 1.5262 2.24119
O2 -0.87046 -3.36738 1.99746
O3 0.94127 2.60653 1.84899
O4 0.11194 2.10025 4.54465
O5 0.94127 2.60653 1.84899
C6 -0.26665 -0.22223 3.97863
O6 1.33004 0.10133 1.14492
H1 -0.98977 1.85202 2.24954
H2 1.59006 0.88423 3.66541
H3 -1.35054 -0.00419 4.12287
H4 0.94707 -1.57249 2.75514
H5 -2.06017 -2.1696 3.24951
H6A -0.68104 -3.00519 4.04204
H6B 0.41797 3.39967 1.82384
HO2 0.55395 1.94684 5.37151
HO3 -1.71577 -3.78143 1.86147
References
1. D.W. Jones. J. Polym. Sci., 42 (1960) pp. 173-188.
2. P. J. C. Smith and S. Arnott. Acta Crystallogr., A 34 (1978), pp. 3-11.
3. W. D. Motherwell, H. L. Ammon, J. D. Dunitz, A. Dzyabchenko, P. Erk, A. Gavezzotti, D. W. Hofmann, F. J. Leusen, J. P. Lommerse, W. T. Mooij, S. L. Price, H. Scheraga, B. Schweizer, M. U. Schmidt, B. P. van Eijck, P. Verwer and D. E. Williams. Acta
Crystallogr. B. 58 (2002), pp. 647-661.
4. Y. Nishiyama, S. Kuga, M. Wada, T. Okano. Macromolecules, 56 (1997), pp. 6395-6397.
5. Y. Nishiyama, J. Sugiyama, H. Chanzy and P. Langan, J. Amer. Chem. Soc.125
(2003), pp. 14300–14306.
6. Y. Nishiyama, P. Langan, and H. Chanzy. J. Am. Chem. Soc. 124 (2002), pp. 9074– 9082.
7. P. Langan, Y. Nishiyama, and H. Chanzy. Biomacromolecules2 (2001), pp. 410–416.
8. M. Wada, L. Heux and J. Sugiyama. Biomacromolecules5 (2004) pp. 1385-1391.
9. M. Wada, L. Heux, A. Isogai, Y. Nishiyama, H. Chanzy, and J. Sugiyama,
Macromolecules 34 (2001) pp. 1237–1243.
10. A. Sarko, J. Southwick and J. Hayashi. Macromolecules9 (1976), pp. 857-863.
11. M. Wada, H. Chanzy, Y. Nishiyama and P. Langan. Macromolecules 2004, In Press.
12. Z. M. Ford, E. D. Stevens, G. P. Johnson and A. D. French, Southeast Regional Meeting, American Chemical Society (ACS), Atlanta, November 17, 2003; ACS National Meeting, Anaheim, CA, March 27, 2004, CARB028.
13. K. H. Gardner and J. Blackwell, Biopolymers, 13 (1974), pp. 1975-2001.
14. A. D. French and P. S. Howley. Cellulose and Wood - Chemistry and Technology, C. Scheurch, ed. Wiley and Sons. 1989. pp. 159-167.
17. A. D. French and G. P. Johnson. Cellulose11 (2004), pp. 5—22.
18. Z. Peralta-Inga, G. P. Johnson, M. K. Dowd, J. A. Rendleman, E. D. Stevens and A. D. French. Carbohydr. Res.237 (2002), pp. 851—861.
19. G. A. Jeffrey and W. Saenger, Hydrogen Bonding in Biological Structures, Springer-Verlag, Berlin 1991, p. 35 and others therein.
20. L. Y. Yatsu, T. A. Calamari, Jr. and R. R. Benerito. Text. Res. J., 1986, 56, 419— 424.
21. J. Mann, L. Roldan-Gonzalez and H. J. Wellard, J. Polym Sci.42 (1960), pp. 165– 171.
United States Agricultural Mid South Area 1100 Robert E. Lee Boulevard
Department of Research Southern Regional P. O. Box 19687
Agriculture Service Research Center New Orleans, Louisiana
70179-0687
July 26, 2005
Robert C. Cashner, Ph.D. Dean of the Graduate School University of New Orleans Lakefront Campus
New Orleans, Louisiana 70124
Dear Dean Cashner:
This letter is written on behalf of Ms. Zakhia Ford, a graduate student in Chemistry who is finishing her master’s thesis. Part of her work has included a jointly authored paper,
I
Determining the crystal structure of cellulose III by modeling. It was published earlier this year in Carbohydrate Research, 340:827-833. 2005. The authors are Ford, Z. M., Stevens, E. D., Johnson, G. P. and French, A. D.
This paper was reviewed by Mr. Johnson, my technician, and myself, and was approved by the U. S. Department of Agriculture as an official publication. Ms. Ford made extensive
contributions to the work and wrote the first draft of the paper. She retains the data used in the project. This letter transmits approval for the paper to be included in her thesis.
Sincerely,
Alfred D. French, Ph. D. Research Chemist
Vita
Zakhia Moore Ford was born in New Orleans, Louisiana and was raised in Avondale,