ISSN(Online): 2319-8753 ISSN (Print): 2347-6710
I
nternational
J
ournal of
I
nnovative
R
esearch in
S
cience,
E
ngineering and
T
echnology
(An ISO 3297: 2007 Certified Organization)
Vol. 5, Issue 11, November 2016
Effect of Variable Storey Height in RC Space
Frames Subjected to Seismic Load
Chekka Sri Anusha1, Dr. Shaik Yajdani2, Sri M. Pavan Kumar3
M.Tech (Structural Engineering) Student, Department of Civil Engineering, Andhra University College of
Engineering (A), Visakhapatnam, Andhra Pradesh, India1
Associate Professor, Department of Civil Engineering, Andhra University College of Engineering (A), Visakhapatnam,
Andhra Pradesh, India2
Assistant Professor, Department of Civil Engineering, S.V.P.College of Engineering, Visakhapatnam,
Andhra Pradesh, India3
ABSTRACT: In present scenario many buildings have irregular configuration both in plan and elevation. This in future may subject to devastating earthquakes. In case, it is necessary to identify the performance of the structures to withstand against disaster. Structures experience lateral deflections under earthquake loads. In the present study, an attempt is made to understand the influence of stiffness irregularity on response of a G+14 storeyed reinforced concrete framed structure subjected to seismic loading in accordance to IS-1893:2002(part-1). Linear seismic analysis is done for the building by static method (seismic coefficient method) and dynamic method (response spectrum method) using STAAD Pro. Three RC frame structures are considered in the analysis, two structures having stiffness irregularity in different storeys i.e, 4th and 8th storeys of the structure. The results of the deflection, shear force, bending moment and axial forces are observed, compared and summarized for beams, columns of the structure. From results obtained from STAAD Pro it is concluded that, presence of storey with increased storey height at lower storey’s levels leads to more damage under seismic load.
KEYWORDS: Bending moment,Shear force, Deflection, Stiffness irregularity, seismic analysis.
I. INTRODUCTION
Earthquake is one of the dangerous and life threatening natural disaster which can come anytime and anywhere on the earth. It has been found that regular shaped buildings perform better during earthquakes. The structural irregularities cause non-uniform load distribution in various members of a building. The destructive effects of an earthquake can be classified into primary and secondary effects.
Primary effects are the immediate damage caused by the quake, such as collapsing buildings, roads and bridges, which may kill many people. The inertia of the building can cause shearing of the structure which can concentrate stresses on the weak walls or joints in the structure resulting in failure or perhaps total collapse.
ISSN(Online): 2319-8753 ISSN (Print): 2347-6710
I
nternational
J
ournal of
I
nnovative
R
esearch in
S
cience,
E
ngineering and
T
echnology
(An ISO 3297: 2007 Certified Organization)
Vol. 5, Issue 11, November 2016
II.SCOPE AND OBJECTIVES
1. The main objective of the thesis is to study the response of multi-storey building with stiffness irregularity subjected to seismic load.
2. To calculate the design lateral forces of regular and irregular buildings using seismic coefficient method and response spectrum analysis and to compare the results of different structures.
3. To analyse the building as per code IS-1893-2002-(part-1) criteria for earthquake resistant structure .
4. Static analysis of building using Seismic coefficient method and Dynamic analysis of building using Response Spectrum method is used.
5. Bending moment, shear force and deflection of stiffness irregular structure are compared with the regular structure.
III. METHODOLOGY
Seismic analysis is a part of structural analysis and a part of structural design where earthquake is prevalent. There are different types of earthquake analysis methods to analyse structure for dynamic loading conditions. This includes following:
1) Seismic coefficient method, 2) Response spectrum method, 3) Pushover analysis method, 4) Time history analysis method
For the Present study seismic coefficient method Response spectrum method describes in IS 1893(Part 1): 2002 is adopted.
Seismic Coefficient Method
All design against seismic loads must consider the dynamic nature of the load . However, for simple regular structures analysis by equivalent linear static methods is often sufficient .This is permitted in most codes of practice for regular , low-to medium rise buildings .it begins with the estimation of base shear load and in distribution on each story calculated by using formulas given in the code.
Response Spectrum Method
The representation of the maximum response of idealized single degree freedom system having certain period and damping , during earthquake ground motions. The method is applicable to those structures where modes other than the fundamental one significantly affect the response of the structure. The maximum response plotted against un-damped natural period and for various damping values and can be expressed in terms of maximum absolute acceleration , maximum relative velocity or maximum relative displacement.
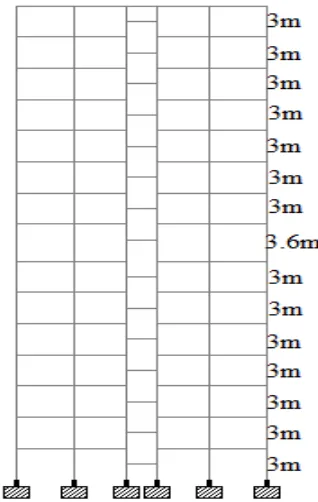
IV. MODELLING
Three models have been analyzed using Seismic coefficient method and Response spectrum method of IS 1893-part 1: 2002 assuming Preliminary data as Location of Structure in seismic zone IV, with soil type medium soil , effective damping 5% and importance factor 1.0. Analysis has been carried out using STAADPro software. Configuration of models is as given below and typical layout is shown in Fig.1.
MODEL-1: This is the base model of structure having G+14 storeys, with a storey height of 3.0m.
MODEL-2: This frameconsists of increase in height of the column on fourth floor introduced in model-1.
ISSN(Online): 2319-8753 ISSN (Print): 2347-6710
I
nternational
J
ournal of
I
nnovative
R
esearch in
S
cience,
E
ngineering and
T
echnology
(An ISO 3297: 2007 Certified Organization)
Vol. 5, Issue 11, November 2016
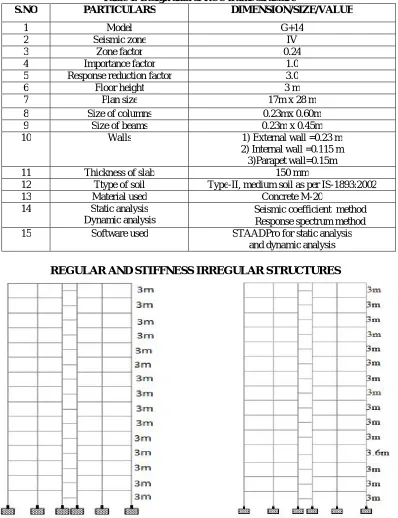
Table 1: Design data of RCC frame structure
S.NO PARTICULARS DIMENSION/SIZE/VALUE
1 Model G+14
2 Seismic zone IV
3 Zone factor 0.24
4 Importance factor 1.0
5 Response reduction factor 3.0
6 Floor height 3 m
7 Plan size 17m x 28 m
8 Size of columns 0.23mx 0.60m
9 Size of beams 0.23m x 0.45m
10 Walls 1) External wall =0.23 m
2) Internal wall =0.115 m 3)Parapet wall=0.15m
11 Thickness of slab 150 mm
12 Ttype of soil Type-II, medium soil as per IS-1893:2002
13 Material used Concrete M-20
14 Static analysis
Dynamic analysis
Seismic coefficient method
Response spectrum method
15 Software used STAADPro for static analysis
and dynamic analysis
ISSN(Online): 2319-8753 ISSN (Print): 2347-6710
I
nternational
J
ournal of
I
nnovative
R
esearch in
S
cience,
E
ngineering and
T
echnology
(An ISO 3297: 2007 Certified Organization)
Vol. 5, Issue 11, November 2016
Model-3:Stiffness irregularity at 8
thfloor
Fig 1 Elevation of buildings
V. ANALYSIS RESULTS
Three RC frame structures have been analyzed and responses like bending moment, shear force and deflection have been computed to study the effects of stiffness irregularity on the regular frame structure . The results are presented and discussed hereafter.
TABLE 2: MAXIMUM BENDING MOMENT OF A COLUMN AT DIFFERENT FLOORS BY STATIC ANALYSIS
ISSN(Online): 2319-8753 ISSN (Print): 2347-6710
I
nternational
J
ournal of
I
nnovative
R
esearch in
S
cience,
E
ngineering and
T
echnology
(An ISO 3297: 2007 Certified Organization)
Vol. 5, Issue 11, November 2016
Storey No Column No Model 1 (kN-m) Model 2 (kN-m) Model 3 (kN-m)
15 774 60.904 60.34 60.266
14 732 102.223 101.099 101.45 13 690 116.302 114.99 115.462 12 648 127.837 126.445 127.021 11 606 136.772 135.364 136.064 10 564 143.795 142.411 143.656 9 522 149.133 147.823 152.93 8 480 152.999 151.808 210.853 7 438 155.475 154.472 145.23 6 396 156.982 156.702 153.423 5 354 157.373 161.802 155.722 4 312 156.199 221.399 154.909 3 270 158.665 163.171 157.71 2 228 150.016 150.907 150.113 1 186 165.675 164.111 162.883
Fig 2:Bending moment of a column by static analysis
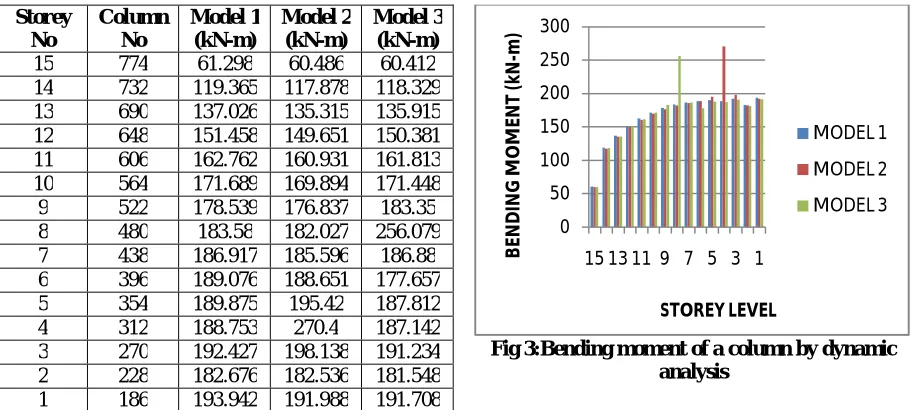
TABLE 3: MAXIMUM BENDING MOMENT OF A COLUMN AT DIFFERENT FLOORS BY DYNAMIC ANALYSIS
To understand the Maximum bending moment behaviour of a column at different floors in regular and vertically irregular building is studied by static analysis.From Fig 3,it is observed that, bending moment of a column in 4th storey of model-2 is more by 43.26% when compared to model-1 and bending moment of a column in 8th storey of model-3 is more by 39.5% when compared to model-1.
Storey No Column No Model 1 (kN-m) Model 2 (kN-m) Model 3 (kN-m)
15 774 61.298 60.486 60.412 14 732 119.365 117.878 118.329 13 690 137.026 135.315 135.915 12 648 151.458 149.651 150.381 11 606 162.762 160.931 161.813 10 564 171.689 169.894 171.448 9 522 178.539 176.837 183.35 8 480 183.58 182.027 256.079 7 438 186.917 185.596 186.88 6 396 189.076 188.651 177.657 5 354 189.875 195.42 187.812 4 312 188.753 270.4 187.142 3 270 192.427 198.138 191.234 2 228 182.676 182.536 181.548 1 186 193.942 191.988 191.708
Fig 3:Bending moment of a column by dynamic analysis 0 50 100 150 200 250
15 13 11 9 7 5 3 1
B EN D IN G M O M EN T (k N -m ) STOREY LEVEL MODEL 1 MODEL 2 MODEL 3 0 50 100 150 200 250 300
15 13 11 9 7 5 3 1
ISSN(Online): 2319-8753 ISSN (Print): 2347-6710
I
nternational
J
ournal of
I
nnovative
R
esearch in
S
cience,
E
ngineering and
T
echnology
(An ISO 3297: 2007 Certified Organization)
Vol. 5, Issue 11, November 2016
more by 18.35% when compared to model-1 and shear force of a column in 8th storey of model-3 is more by 17.808% when compared to model-1 .
Storey No Column No Model 1 (kN) Model 2 (kN) Model 3 (kN)
15 774 24.459 24.324 24.206 14 732 46.174 45.736 45.811 13 690 58.163 57.538 57.704 12 648 68.592 67.837 68.073 11 606 77.281 76.438 76.649
10 564 84.51 83.617 83.431
9 522 90.441 89.531 79.519
8 480 95.148 94.245 112.092
7 438 98.806 97.836 87.532
6 396 101.602 100.150 100.434 5 354 103.684 91.315 102.913 4 312 103.797 122.850 103.084 3 270 103.365 90.997 102.645
2 228 99.512 98.239 98.858
1 186 114.843 113.265 113.681
Fig 4: Shear force of a column by static analysis
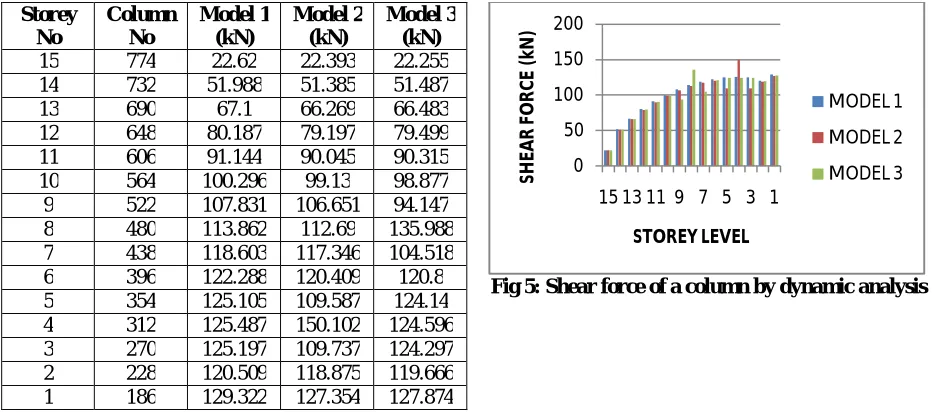
TABLE 5: MAXIMUM SHEAR FORCE IN A COLUMN AT DIFFERENT FLOORS BY DYNAMIC ANALYSIS
To understand the Maximum shear force behaviour of a column at different floors in regular and vertically irregular building is studied by dynamic analysis.From Fig5 ,it is observed that, shear force of a column in 4th storey of model-2 is more by 19.61% when compared to model-1 and shear force of a column in 8th storey of model-3 is more by 18.43% when compared to model-1.
Storey No Column No Model 1 (kN) Model 2 (kN) Model 3 (kN)
15 774 22.62 22.393 22.255
14 732 51.988 51.385 51.487
13 690 67.1 66.269 66.483
12 648 80.187 79.197 79.499 11 606 91.144 90.045 90.315 10 564 100.296 99.13 98.877 9 522 107.831 106.651 94.147 8 480 113.862 112.69 135.988 7 438 118.603 117.346 104.518 6 396 122.288 120.409 120.8 5 354 125.105 109.587 124.14 4 312 125.487 150.102 124.596 3 270 125.197 109.737 124.297 2 228 120.509 118.875 119.666 1 186 129.322 127.354 127.874
Fig 5: Shear force of a column by dynamic analysis
0 20 40 60 80 100 120 140
1513 11 9 7 5 3 1
SH EA R F O R C E (k N ) STOREY LEVEL MODEL 1 MODEL 2 MODEL 3 0 50 100 150 200
15 13 11 9 7 5 3 1
ISSN(Online): 2319-8753 ISSN (Print): 2347-6710
I
nternational
J
ournal of
I
nnovative
R
esearch in
S
cience,
E
ngineering and
T
echnology
(An ISO 3297: 2007 Certified Organization)
Vol. 5, Issue 11, November 2016
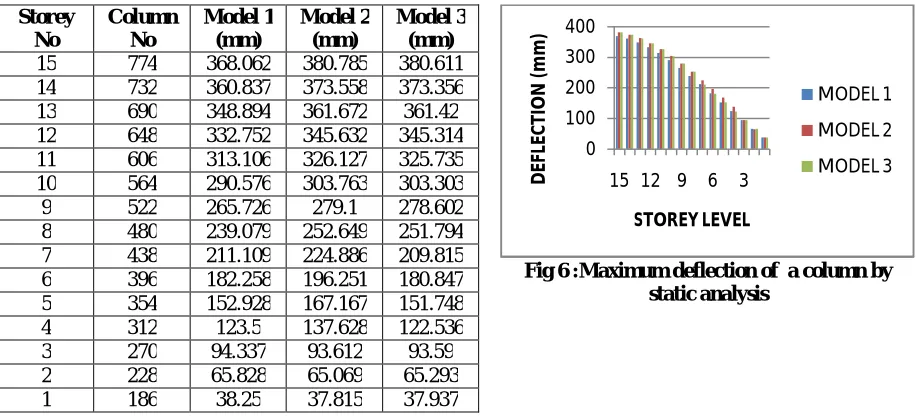
TABLE 6: MAXIMUM DEFLECTION OF A COLUMN AT DIFFERENT FLOORS BY STATIC ANALYSIS
To understand the Maximum deflection behaviour of a column at different floors in regular and vertically irregular building is studied by static analysis.From Fig 6, it is observed that, deflection of a column 4th storey of model-2 is more by 10.23% when compared to model-1 and deflection of a column in 8th storey of model-3 is more by 4.587% when compared to model-1
.
Storey No Column No Model 1 (mm) Model 2 (mm) Model 3 (mm)
15 774 368.062 380.785 380.611 14 732 360.837 373.558 373.356 13 690 348.894 361.672 361.42 12 648 332.752 345.632 345.314 11 606 313.106 326.127 325.735 10 564 290.576 303.763 303.303
9 522 265.726 279.1 278.602
8 480 239.079 252.649 251.794 7 438 211.109 224.886 209.815 6 396 182.258 196.251 180.847 5 354 152.928 167.167 151.748
4 312 123.5 137.628 122.536
3 270 94.337 93.612 93.59
2 228 65.828 65.069 65.293
1 186 38.25 37.815 37.937
Fig 6 :Maximum deflection of a column by static analysis
TABLE 7: MAXIMUM DEFLECTION OF A COLUMN AT DIFFERENT FLOORS BY DYNAMIC ANALYSIS
To understand the Maximum deflection behaviour of a column at different floors in regular and vertically irregular building is studied by dynamic analysis.From Fig 7, it is observed that, deflection of column in 4th storey of model-2 is more by 11.44% when
compared to model-1 and deflection of column in 8th storey of model-3 is more by 5.736% when compared to model-1.
Storey No Column No Model 1 (mm) Model 2 (mm) Model 3 (mm)
15 774 381.382 394.333 393.987 14 732 374.26 387.241 386.842 13 690 362.973 376.047 375.568 12 648 347.364 360.595 360.002 11 606 328.008 341.435 340.701 10 564 305.479 319.13 318.218 9 522 280.325 294.215 293.017 8 480 253.053 267.183 274.663 7 438 224.129 238.519 224.147 6 396 193.979 208.519 193.908 5 354 162.984 177.578 161.931 4 312 131.506 144.966 130.601 3 270 99.875 100.656 99.758
2 228 68.452 68.130 67.948
Fig7:Maximum deflection of a column by dynamic analysis 0 100 200 300 400
15 12 9 6 3
D EF LE C TI O N ( m m ) STOREY LEVEL MODEL 1 MODEL 2 MODEL 3 0 100 200 300 400 500
151311 9 7 5 3 1
ISSN(Online): 2319-8753 ISSN (Print): 2347-6710
I
nternational
J
ournal of
I
nnovative
R
esearch in
S
cience,
E
ngineering and
T
echnology
(An ISO 3297: 2007 Certified Organization)
Vol. 5, Issue 11, November 2016
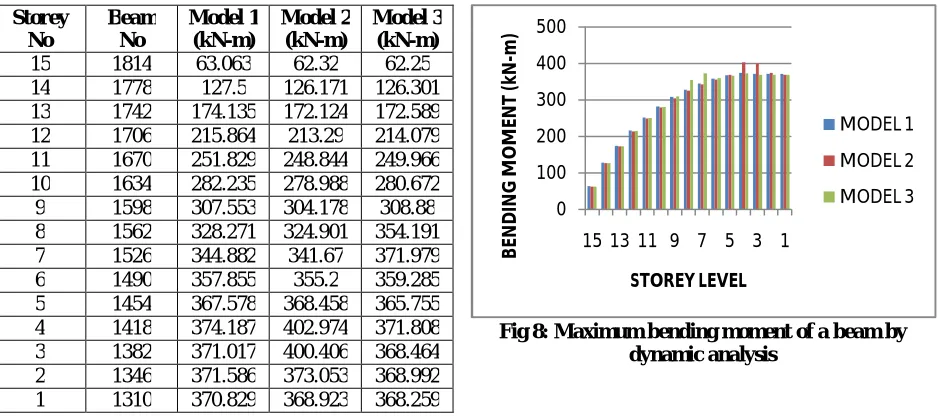
TABLE 8: MAXIMUM BENDING MOMENT OF A BEAM AT DIFFERENT FLOORS BY DYNAMIC ANALYSIS
To understand the Maximum bending moment behaviour of a beam at different floors in regular and vertically irregular building is studied by dynamic analysis.From Fig ,it is observed that, bending moment of beam in 4th storey of model-2 is more by 7.69% when compared to model-1 and bending moment of beam in 8th storey of model-3 is more by 7.89% when compared to model-1.
Storey No Beam No Model 1 (kN-m) Model 2 (kN-m) Model 3 (kN-m)
15 1814 63.063 62.32 62.25
14 1778 127.5 126.171 126.301 13 1742 174.135 172.124 172.589 12 1706 215.864 213.29 214.079 11 1670 251.829 248.844 249.966 10 1634 282.235 278.988 280.672 9 1598 307.553 304.178 308.88 8 1562 328.271 324.901 354.191 7 1526 344.882 341.67 371.979 6 1490 357.855 355.2 359.285 5 1454 367.578 368.458 365.755 4 1418 374.187 402.974 371.808 3 1382 371.017 400.406 368.464 2 1346 371.586 373.053 368.992 1 1310 370.829 368.923 368.259
Fig 8: Maximum bending moment of a beam by dynamic analysis
TABLE 9: MAXIMUM SHEAR FORCE OF A BEAM AT DIFFERENT FLOORSBY DYNAMIC ANALYSIS
To understand the Maximum shear force behaviour of a beam at different floors in regular and vertically irregular building is studied by dynamic analysis.From Fig, it is observed that, shear force of beam in 4th storey of model-2 is more by 4.65% when compared to model-1 and shear force of beam in 8th storey of model-3 is more by 4.78% when compared to model-1.
Storey No Beam No Model 1 (kN) Model 2 (kN) Model 3 (kN)
15 1814 51.769 51.476 51.426 14 1778 99.962 99.472 99.491 13 1742 115.601 114.88 115.011 12 1706 129.783 128.87 129.111 11 1670 142.018 140.963 141.32 10 1634 152.382 151.235 151.786
9 1598 161.033 159.841 161.626 8 1562 168.149 166.956 175.891 7 1526 173.872 172.731 181.991 6 1490 178.403 177.45 179.066 5 1454 181.847 182.327 181.194 4 1418 184.295 192.879 183.46 3 1382 176.651 185.469 175.761 2 1346 177.207 177.931 176.308 1 1310 175.956 175.312 175.083
Fig 9: Maximum shear force of a beam by dynamic analysis 0 100 200 300 400 500
15 13 11 9 7 5 3 1
B EN D IN G M O M EN T (k N -m ) STOREY LEVEL MODEL 1 MODEL 2 MODEL 3 0 50 100 150 200 250
15 13 11 9 7 5 3 1
ISSN(Online): 2319-8753 ISSN (Print): 2347-6710
I
nternational
J
ournal of
I
nnovative
R
esearch in
S
cience,
E
ngineering and
T
echnology
(An ISO 3297: 2007 Certified Organization)
Vol. 5, Issue 11, November 2016
VI. CONCLUSIONS
Studied the behaviour of R.C framed structures with and without stiffness irregularities subjected to seismic loading. Structures are analysed by linear static and dynamic method. The following conclusions are drawn from the study.
1. For columns in considered R.C frames, it is observed that there is an increase in bending moment 43.26% in 4th storey of model-2 and 39.5% in 8th storey of model–3 when compared to model-1.
2. For columns in considered R.C frames, it is observed that there is an increase in shear force of 19.61% in 4th storey of model-2 and 18.43% in 8th storey of model–3 when compared to model-1.
3. For columns in considered R.C frames, it is observed that there is an increase in deflection of 11.44% in 4th storey of model-2 and 5.76% in 8th storey of model–3 when compared to model-1.
4. For beams in considered R.C frames, it is observed that there is an increase in bending moment of 7.69% in 4th storey of model-2 and 7.89% in 8th storey of model – 3 when compared to model-1.
5. For beams in considered R.C frames, it is observed that there is an increase in shear force of 4.65% in 4th storey of model-2 and 4.78% in 4th storey of model – 3 when compared to model-1.
6. When regular building is compared with other stiffness irregular buildings the bending moment, shear force and deflection is less in regular building.
7. Values obtained for dynamic analysis is higher than the values obtained for static analysis.
8. Based on the results of shear force, bending moment and deflection of columns, model-2 is most vulnerable condition than model-3.
9. From this study, it is concluded that presence of storey with increased storey height at lower storey’s levels leads to more damage under seismic load.
REFERENCES
1. Carr, A. J. (1994). "Dynamic Analysis of Structures." Bulletin, New Zealand National Society for Earthquake Engineering, Vol. 27, No 2, June
1994.
2. Chintanapakdee and Chopra. (2004), “Seismic response of vertically irregular frames: response history and modal pushover analyses”, ASCE
Journal of Structural Engineering, Vol. 130, No. 8, 11771185.
3. Dr.Raghvendra Singh, et al (2014), “Seismic Behaviour of Buildings Having Vertical Irregularities”. Universe of Emerging Technologies and
Science, volume 1, Issue 5, Oct. 2014.
4. E.LWilsons and K.Bathe , "Stability and accuracy analysis of direct integration method " Earthquake engineering and Structural dynamics
-vol-1,1973
5. IS: 456-2000 (Fourth Revision), Indian standard code for practice for plain reinforced concrete for general building construction, Bureau of Indian Standards, New Delhi.
6. Jack P. Moehle, A. M. ASCE, Seismic Response of Vertically Irregular Structures, ASCE Journal of Structural Engineering, Vol. 110,
September, 1984.
7. PutulHaldar and Yogendra Singh (2009), “Seismic Performance and Vulnerability of Indian Code-Designed RC Frame Buildings”. ISET Journal of Earthquake Technology,March 2009.
8. S Monish and S Karuna (2015), “Effect of vertical Irregularity in RC Framed Buildings in Severe Seismic Zone”. International Journal of Emerging Technology and Advanced Engineering, volume 5, Issue 6, June 2015.
9. IS 1893:2002 (Part-I), Criteria for earthquake design structures, General provisions on buildings, Bureau of Indian Standards, New Delhi.
10. IS 875:1987 (part-2) code of practice for design loads (other than earth quake ) for buildings and structures.
11. Text book of ," Earthquake Resistant Design of Structures " by S.K.Duggal
12. Valmundsson and Nau. (1997),“Seismic response of buildings frames with vertical structuralIrregularities”, ASCE Journal of Structural