DOI: 10.1534/genetics.107.083162
An Improved Method for Quantitative Trait Loci Detection and Identification
of Within-Line Segregation in F
2Intercross Designs
Lars Ro
¨nnega˚rd,
1Francois Besnier and O
¨ rjan Carlborg
2Linnaeus Centre for Bioinformatics, Uppsala University, 75124 Uppsala, Sweden Manuscript received October 9, 2007
Accepted for publication February 9, 2008
ABSTRACT
We present a new flexible, simple, and powerful genome-scan method (flexible intercross analysis, FIA) for detecting quantitative trait loci (QTL) in experimental line crosses. The method is based on a pure random-effects model that simultaneously models between- and within-line QTL variation for single as well as epistatic QTL. It utilizes the score statistic and thereby facilitates computationally efficient significance testing based on empirical significance thresholds obtained by means of permutations. The properties of the method are explored using simulations and analyses of experimental data. The simulations showed that the power of FIA was as good as, or better than, Haley–Knott regression and that FIA was rather insensitive to the level of allelic fixation in the founders, especially for pedigrees with few founders. A chromosome scan was conducted for a meat quality trait in an F2intercross in pigs where a
mutation in the halothane (Ryanodine receptor, RYR1) gene with a large effect on meat quality was known to segregate in one founder line. FIA obtained significant support for the halothane-associated QTL and identified the base generation allele with the mutated allele. A genome scan was also performed in a previously analyzed chicken F2intercross. In the chicken intercross analysis, four previously detected
QTL were confirmed at a 5% genomewide significance level, and FIA gave strong evidence (P,0.01) for two of these QTL to be segregating within the founder lines. FIA was also extended to account for epistasis and using simulations we show that the method provides good estimates of epistatic QTL variance even for segregating QTL. Extensions of FIA and its applications on other intercross populations including backcrosses, advanced intercross lines, and heterogeneous stocks are also discussed.
T
HE detection of quantitative trait loci (QTL) in domestic animals has been greatly enhanced by the design of experimental crosses between highly di-vergent lines (Andersson 2001). The animals of thefounder lines are usually taken from two different breeds with large phenotypic differences, such as European Wild Boar and Large White domestic pigs (Knottet al.
1998), Jungle Fowl and White Leghorn chicken (Kerje
et al. 2003), and selected mouse lines (Brockmannet al.
1998). Here large genetic differences between the breeds are expected for the studied trait, and the power of detecting QTL is high even for moderately sized ex-perimental crosses. There is often a substantial within-breed heritability for the studied trait, but still the commonly used regression model to detect QTL as-sumes a biallelic QTL that is fixed within each of the two founder lines (Haleyet al. 1994). If the QTL alleles
are not fixed, however, the regression model will under-estimate the QTL allele effect and the power to detect the QTL decreases (Perez-Encisoand Varona2000).
Furthermore, an increased understanding of the
mag-nitude of the genetic variation within lines is crucial for further studies to identify the causative genes un-derlying QTL.
Several approaches have been adopted to account for within-line QTL variation in line crosses of outbred lines. Following Goddard (1992), Wanget al. (1998)
suggested the use of a multibreed model with a fixed breed effect and a random QTL effect. For analysis of F2 intercrosses, Knott et al. (1996) developed a nested
within-half-sib family model that does not assume fixa-tion of QTL alleles in the founder lines, and the number of alleles is constrained only by the number of families. This is a model with fixed effects and the number of estimated parameters increases with the number of half-sib families. Furthermore, the genotypic information of the dams is not included in the model and the sires are assumed to be unrelated.
Perez-Encisoand Varona(2000) developed a
mixed-QTL model that accounts for line differences and within-line variation of QTL effects. In this model, which is similar to the model developed by Wanget al. (1998), a
fixed line effect is estimated together with a random within-line QTL variance. The model is a combination of the regression model (Haleyet al. 1994) and the QTL
variance component (VC) model (Fernando and
Grossman 1989; Goldgar 1990). A drawback of the
2Present address:Department of Animal Breeding and Genetics, Swedish
University of Agricultural Sciences, SE-75007 Uppsala, Sweden.
1Corresponding author:Linnaeus Centre for Bioinformatics, SE-75124
Uppsala, Sweden. E-mail: [email protected]
model is, however, the difficulty to compare estimates in different genomic locations as the total QTL variance is a combination of fixed and random effects. The method of Perez-Enciso and Varona (2000) maximizes the
likelihood with a nonderivative algorithm and is rather slow. Their model was further developed in Perez
-Encisoet al. (2001) to account for dominance effects.
Meuwissenand Goddard(2000) developed a model
for fine mapping in outbred populations. They model a QTL as a random effect and introduce nonzero corre-lations between the founder alleles given by estimated linkage disequilibrium within founder haplotypes. We develop this approach further by, instead of estimating the founder correlations from external information about the population history, estimating these correla-tions directly from the marker–pedigree–phenotype data from the experimental cross.
On the basis of this model, we develop a new flexible genome-scan method for QTL detection in experimen-tal intercrosses. The method is based on a general VC model that utilizes the score statistic to detect QTL. The VC framework relaxes the assumptions of previous fixed-effects models (e.g., Haleyet al. 1994) and ensures
simple interpretation and testing of the estimated param-eters. The method can be extended to account for epis-tasis for both segregating and fixed QTL. The use of the score statistic makes the analysis fast and robust, which enables empirical significance testing. This new method is referred to as flexible intercross analysis (FIA).
METHODS
Statistical modeling:First we present the single-locus VC model, where all base QTL alleles are assumed to be uncorrelated (Fernandoand Grossman1989; Goldgar
1990). Thereafter, we develop the single-locus model to account for within-founder-line correlations. Our model can be used to identify within-line variation in a three-stage process:
Step 1: Perform a genome scan utilizing the score statistic to test for QTL that are either fixed or segregating within founder lines.
Step 2: Estimate the within-line correlation (r) at significant QTL locations and test H0:r ¼1vs. H1:
r,1.
Step 3: If H0can be rejected, different correlations will be estimated within lines and different allele effects will be identified within lines by analyzing the least-squares estimates of the base generation allele effects. The traditional single-locus VC model for general pedigrees withnphenotyped individuals is given by
y¼Xb1v1a1e ð1aÞ
(e.g., Lynchand Walsh1998, Chap. 16), whereyis the
vector of individual phenotypes (length n), b is the
vector of fixed effects andXis the corresponding design matrix,vis a vector of random individual QTL effects (lengthn) in positiont,ais a vector of random poly-genic effects (lengthn), andeis a vector of residual ef-fects (lengthn). The variance–covariance matrix ofy, assuming independent allelic effects in the base gener-ation, is:
VðyÞ ¼Ps2v1Asa21Ins2e; ð1bÞ
where P is the genotype identity-by-descent (IBD) matrix (size n 3 n) calculated in positiont,s2
v is the corresponding genotype QTL variance,Ais the additive relationship matrix, s2
a is the variance of polygenic effects,Inis the identity matrix of sizen3n, ands2e is the residual variance.
An alternative, and equivalent, presentation of model (1) is
y¼Xb1Zv*1a1e ð2Þ
(Ro¨ nnega˚ rd and Carlborg 2007), where v* is the
vector of m independent normal-distributed base generation QTL alleles with variance 1
2s 2
v, Z is an incidence matrix of size n 3 m relating individuals with the QTL alleles in the base generation, andeis the residual vector with variances2
e. In the calculations of the IBD matrix in model (1), it is implicitly assumed that the QTL allele effects are uncorrelated in the base generation, so Vðv*Þ ¼1
2s 2
vIm, whereImis the identity
matrix of size m 3 m. We also have the identity
Ps2
v ¼ZZ912s 2 v.
The single-locus VC QTL model for experimental line crosses: In a line cross, the QTL allele effects will be correlated within the base generation lines A and B. This correlation can be included in model (2). We then get a mixed linear model y¼Xb1Zv*1a1e, wherev* is a random effect withmlevels, wherem¼
mA1mBandmAis twice the number of individuals in
line A and mB is twice the number of individuals in
lineB. In our model, there is an unknown correlation
r between the firstmA levels and the lastmBlevels of
v*, such that v* MVN(0, G) and, e.g., for one founder in lineAand three founders in lineB(mA¼2
andmB¼6),
G¼1
2
s2 v s2c
s2 c s2v
s2
v s2c s2c s2c s2c s2c
s2
c s2v s2c s2c s2c s2c
s2c s2c s2v s2c s2c s2c s2c s2c s2c s2v s2c s2c s2c s2c s2c s2c s2v s2c s2c s2c s2c s2c s2c s2v
0 B B B B B B B B B B B B @
1 C C C C C C C C C C C C A
ð3aÞ
G¼1 2s 2 v 1 r r 1
1 r r r r r
r 1 r r r r
r r 1 r r r
r r r 1 r r
r r r r 1 r
r r r r r 1
0 B B B B B B B B B B @ 1 C C C C C C C C C C A
: ð3bÞ
Hence,yMVNðXb;VÞ, where
V¼ZGZ9 1As2a1Ins2e: ð4aÞ
Using the gametic IBD matrix formulation (e.g., Pong-Wonget al. 2001), we have a gametic IBD matrix
W for the base individuals, with1 2s
2
vW¼Gand V¼12
s2
vKWK9 1As2a1Ins2e, where K ¼In5ð1;1Þ (5 de-notes the Kronecker product).
The key to estimatings2
vands2c(and thereby alsor) is to formulate the variance–covariance matrix ofyas
V¼Ps2v1ðPJPÞs2c1As2a1Ins2e; ð4bÞ
wherePandPJare the IBD matrices calculated for base-generation structures with alleles independent and fixed within lines, respectively. From (2), it is possible to show that (4a) and (4b) are equivalent since
ZGZ9¼Z Im 1 2s
2
v1ðJmA;mBImÞ
1 2s 2 c Z9
¼ZImZ9 1 2s
2
v1ðZJmA;mBZ9ZImZ9Þ
1 2s
2 c
¼ZZ91
2s 2
v1ðZJmA;mBZ9ZZ9Þ
1 2s
2 c
¼Ps2v1ðPJPÞs2c;
Where Jm
A;mB is a block diagonal matrix with ones in
blocks of sizemA3mAandmB3mB.
Epistatic VC QTL model: Including epistasis is an essential part of QTL modeling (Carlborgand Haley
2004). FIA accounts for epistasis by an extension of model (4b) as
V¼P1s2
v1ðPJP1Þs2c1P1+P2s2121Ins2e; ð5Þ
whereP1andP2are the IBD matrices for the two QTL, assuming an outbred base generation, and the Hadamard product+was used for the epistatic variance component (Mitchellet al. 1997; Ro¨ nnega˚ rdet al. 2008).
Genome scan with the score statistic:The score statistic is calculated as S¼D9F1D (Cox and Hinkley 1974;
Tangand Siegmund 2001; Putter et al. 2002), where
Dis the gradient vector for the log-likelihood function under the alternative hypothesis calculated at the param-eter values given by the null hypothesis, andFis Fisher’s information matrix (see Lynchand Walsh1998).
We base our analysis on the residual log-likelihood function (Pattersonand Thompson1971):
L¼ 1
2logjVj 1
2ðyXbˆÞ9V
1ðyXbˆÞ
1
2logjX9V 1Xj:
Letu¼ s2 v s 2 c s 2 a s 2 e
be the parameter vector for the VC part of the model. We then have the following partial derivatives:
@V
@u1 ¼
@V
@s2v ¼PI
@V
@u2
¼ @V @s2 c
¼PJPI
@V
@u3
¼ @V @s2a¼A
@V
@u4 ¼
@V
@s2e¼In:
The elements of the gradient D under the null hypothesis ofs2
v ¼0 were calculated as
@L
@ui¼
1 2tr
@V
@uiP0
11
2y9P0
@V
@uiP0y
(Lynch and Walsh 1998), where P0¼V1
0 V
1
0 X
ðX9V1 0 XÞ
1
X9V1
0 , and V0 ¼As˜2a1Ins˜2e with ˜s2a and ˜
s2
ebeing the estimated polygenic and residual variance under the null hypothesis. The elements of F are calculated as
Fij¼ 1 2tr
@V
@ui P0@V
@uj P0
:
Note that the value of P0 does not change between positions along the genome and that the computational requirements for the score statistic are low.
Parameter estimation:The parameters in the model are estimated using average information–restricted maxi-mum likelihood (AI–REML) ( Johnsonand Thompson
1995). The algorithm was programmed in R (R Development Core Team 2004) and set to converge
when the log likelihood differed ,104 between
iter-ations. The derivatives of the log-likelihood function used in the algorithm are
@L
@ui
¼ 1
2tr
@V
@ui P
11
2y9P
@V
@ui Py;
where P¼V1V1XðX9V1
XÞ1X9V1 with Vgiven in (4b).
Identification of segregating alleles within founder lines: When a QTL withr,1 is detected, we test within which line and individual that the alleles are segregating. First, we estimate separate correlations within each line, so that½following the example in (3)we have
G¼1
2s 2 v
1 rA rA 1
1 rB rB rB rB rB rB 1 rB rB rB rB rB rB 1 rB rB rB rB rB rB 1 rB rB rB rB rB rB 1 rB rB rB rB rB rB 1 0
B B B B B B B B B B @
1 C C C C C C C C C C A
;
whererAis the correlation within founder lineAandrBis
the correlation within founder lineB. Furthermore, the individual base generation allele effects can be estimated. The least-squares estimates are obtained by constructing a design matrix Xm from the first m columns of the
gametic IBD matrixW. The base generation allele effects
bmare then estimated from the linear modely¼Xb1
Xmbm1e.
Calculation of significance thresholds: The significance thresholds for the genome scan are calculated by means of permutation testing (Churchilland Doerge1994;
Good2005). An important assumption of a
permuta-tion test is that the observapermuta-tions are exchangeable under the null hypothesis (Davison and Hinkley 1997, p.
143; Andersonand TerBraak2002) and we guarantee
this by permuting residuals estimated from the null model y¼Xb1a1e. Replicates of the phenotypic data were simulated withy¼Xb˜1˜a1 ˘e, where ˘eis the vector of permuted residuals, and ˜b and ˜a are the estimated fixed and random polygenic effects obtained from the null model. (In our analyses of the European Wild Boar3Large White F2cross and the Red Jungle Fowl 3 White Leghorn F2 cross no polygenic effects were detected and we therefore used ˜a¼0). For each replicate, the score statistic was calculated at every tested position (5 cM apart) along the genome using (4). The empirical distribution of the maximum score value from each replicate was used to obtain significance thresholds.
IBD-matrix estimation: Several different IBD estima-tion programs are available. We use a deterministic algorithm based on Pong-Wonget al. (2001) to
calcu-late the IBD matrices in (4b). The original algorithm by Pong-Wonget al. assumes that founder marker phases are unknown and does not enable general base gener-ation structures. We implemented the original algo-rithm to account for known phases of marker genotypes and consequently allow user-specified base generation structures. The most likely phases of the marker geno-types in the base generation are estimated using a genetic algorithm that uses both marker and pedigree information as input. Resulting marker genotype phases
were subsequently used as input in the IBD estimation algorithm (F. Besnier, B.-W. Kimand O¨ . Carlbourg,
unpublished data).
Simulation setup for a single QTL: We used simu-lations to study the distribution ofrand variation of LR for different levels of fixation within lines. In the results, if not otherwise stated, LR¼ 2(l0l1) withl1equaling the likelihood of model (4) and l0equaling the likeli-hood of the same model withs2
v ¼0. Furthermore, we wished to compare the power of the Haley–Knott regression with additive effects (Haley et al. 1994) to
our more flexible method.
In the analyses of VC estimates and comparisons of LRs to the ones obtained from Haley–Knott regression, 100 replicates were simulated for each of the four cases described below with four founders and 800 F2 individ-uals, and a 20% QTL at a fully informative marker. The setup for these simulations gives expected values ofr¼
1.00, 0.68, 0.20, and 0.00 for cases 1–4, respectively. In the power analyses, four parameters were varied to thoroughly evaluate the differences between FIA and Haley–Knott regression: number of founders in base generation, number of F2individuals, marker informa-tion, and level of fixation within founder lines. The methods were compared by their power to detect a QTL for a given position at a 5% significance level.
Base generation size: Two types of pedigrees were simulated with random mating: one with a small base generation (no. of founders¼4) and one with a large base generation (no. of founders ¼ 50). These are referred to assmall baseandlarge base, respectively. The structure for the small base pedigree was designed to mimic the pedigree of a Red Jungle Fowl 3 White Leghorn F2cross (Kerjeet al. 2003) with one jungle fowl male mated to three leghorn females in the base gen-eration. The large base generation structure pedigree consisted of 25 individuals in each line and resembles an F2 intercross between two divergently selected body-weight chicken lines described in Jacobsson et al.
(2005). The two simulated base generation sizes were chosen as most experimental intercrosses are expected to have base generation sizes intermediate to these.
Number of F2individuals:The number of F2individuals simulated was either 200 or 800. A biallelic QTL was simulated with a difference between the two QTL allele effects ofpffiffiffiffiffiffiffiffi2h2, whereh2is the QTL heritability in an
outbred population. For the pedigrees with 200 F2 individuals, h2 was set to 0.05, whereas h2 was set to
0.02 for the pedigrees with 800 F2 individuals. The phenotype of an F2 individual i was simulated with yi¼A1i1A2i1ei, whereA1i is the QTL allele effect on
the paternally inherited chromosome and A2i is the
QTL allele effect on the maternally inherited chromo-some, and ei is an i.i.d. normally distributed residual
effect with a variance of 1 h2.
marker interval flanked by two fully informative markers.
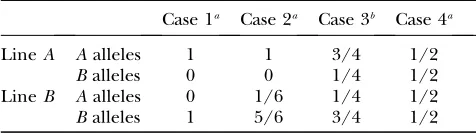
Level of fixation within founder lines: Four different cases (Table 1) were studied by varying the fixation level within lines ofA andBalleles for a biallelic QTL. The theoretical values of r for each of the four cases are derived in theappendix.
Simulation setup for a QTL with epistatic interac-tion: Using simulations, we evaluated how well our model estimates epistatic variance components and how the existence of epistasis influences the estimates of other variance components in the presence of QTL segregation. A small base generation and 800 F2 individuals were simulated for cases 1–4 (Table 1). A biallelic QTL was simulated with a difference between the two QTL allele effects of 3.162. An additional unlinked QTL was simulated with no main effect. The base alleles of this QTL were assumed to be unique and to be interacting with the former biallelic QTL. For every possible pairwise combination of alleles between the two QTL a value for the epistatic interaction was drawn from N 0;s2
12
, where s2
12 is the epistatic variance. The residual variance was 95 s2
12, which gives a heritability for the main QTL effect of 5% in an outbred population. One hundred replicates were simulated for each of the four cases and fors2
12¼0, 5, or 10, and a fully informative marker was assumed.
Analyses of experimental data:European Wild Boar3
Large White F2cross:To compare the properties of FIA to
Haley–Knott regression when applied to real data, we analyzed data from a European Wild Boar 3 Large White cross, where the causal mutation underlying the studied trait has been detected (Lundstro¨ met al. 1995)
and is known to be segregating in the founders. In this cross, two European Wild Boars were mated to eight Large White sows, producing 191 F2 offspring with measured genotypes and phenotypes. Twenty-two markers were genotyped on the studied chromosome 6 at 0.0, 8.6, 36.6, 49.7, 50.5, 62.9, 79.2, 80.4, 83.7, 84.1, 84.8, 90.6, 95.4, 100.7, 101.9, 115.9, 116.7, 119.0, 120.2,
124.0, 127.0, and 170.9 cM. In our analysis, we examined a meat quality trait (reflectance value, EEL, scored over a cross-section of the longissimus dorsi muscle), which is known to be affected by the halothane gene (Lundstro¨ m
et al. 1995) located at 80.4 cM. One of the founder boars is known to be heterozygous (HalN/Haln), whereas all
other founders are homozygous for the wild-type allele (HalN
/HalN
). We performed a QTL scan on chromo-some 6 using Haley–Knott regression and FIA and also explored whether FIA could identify which founder allele carried the mutated halothane allele (Haln
). Fol-lowing Knottet al. (1998), we included sex, litter, and
slaughter weight as fixed effects in our analysis. The data are described in detail in Knott et al. (1998) and
Andersson-Eklundet al. (1998).
Red Jungle Fowl 3 White Leghorn F2 cross: In a Red
Jungle Fowl3White Leghorn F2cross, we performed a full-genome scan using FIA and Haley–Knott regres-sion. In this pedigree, one Red Jungle Fowl male was mated to three White Leghorn females, producing 756 F2offspring with measured genotypes and phenotypes. We used an updated marker map to those reported in Kerjeet al. (2003), including 439 markers (L. Andersson,
personal communication) covering chromosomes 1–28. We analyzed body weight at 200 days of age for which Kerje et al. (2003) found two 1% genomewide
signifi-cant QTL on chromosome 1 (growth 1 at 68 cM and growth 2 at 420 cM) and 5% genomewide significant QTL on chromosome 5 (growth 8 at 21 cM) and chro-mosome 27 (growth 13 at 20 cM). Two additional 5% genomewide significant QTL were also found in this study, which had large and significant dominance effects. In the original publication, it was noted that there was a within-line QTL variation for growth 2 on the basis of indications from a heterogeneity test among the four largest F1families, but it was not investigated how this influenced the results or within which founder line the QTL was segregating. We repeated the genome scan to explore how many of the previously detected QTL were segregating. Following Kerjeet al. (2003), we
included sex and batch as fixed effects in the model. The data are described in detail in Kerjeet al. (2003).
RESULTS
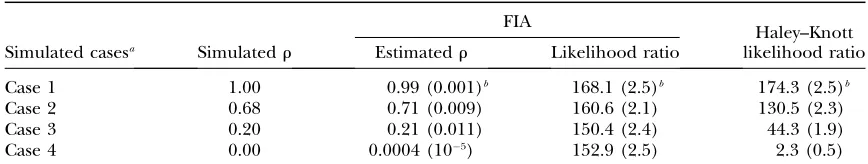
Simulations of a single QTL: Estimates of within-line correlations and comparisons to LRs from Haley–Knott regression: We compared the LRs from our VC model using REML with those obtained from Haley–Knott regression. LRs from Haley–Knott regression decrease rapidly when the level of segregation within lines increases (Table 2), whereas LRs from our model differed only marginally between the evaluated cases. The estimated within-line correlation (r) drops from one to zero as the level of fixation decreases in cases 1–4 (Table 2).
TABLE 1
Proportion ofAandBQTL alleles in the two founder lines of a line cross for the four simulated scenarios ranging from a fixed QTL (case 1) to a completely segregating QTL (case 4)
Case 1a Case 2a Case 3b Case 4a
LineA Aalleles 1 1 3/4 1/2
Balleles 0 0 1/4 1/2
LineB Aalleles 0 1/6 1/4 1/2 Balleles 1 5/6 3/4 1/2
aFor cases 1, 2, and 4, the small base pedigree consisted of
one founder in lineAand three founders in lineB, which was the base generation structure in the Red Jungle Fowl3White Leghorn F2intercross reported by Kerjeet al. (2003).
b
Power analysis: There were no substantial differences in power between FIA and Haley–Knott regression when the QTL were fixed within lines (case 1 in Figure 1). The power of FIA was up to 10 times higher, however, when there was segregation within lines (Figure 1, case 4). For case 4, the difference between Haley–Knott regression and FIA was largest when the base generation was small and the number of F2individuals was high (Figure 1a), i.e., when there were a large number of copies of each base generation allele in the F2. The difference in power was highest when the QTL was located at the marker.
With a large base generation, the power of both Haley–Knott regression and FIA decreases significantly. For example, in case 4, Haley–Knott regression had no power at all to detect the segregating QTL (detection equal to the type I error rate of 5%). FIA, however, still had some power (18%) to detect the segregating QTL near a fully informative marker in the 800 F2pedigree. Decreasing the number of copies of each base genera-tion allele in the F2 increases the uncertainty of the estimated base generation structure, especially when the base is fully outbred or close to outbred. Therefore a decline in the power of FIA going from case 1 to 4, as shown in Figure 1, c and d, is expected.
Simulations of a QTL with epistatic interaction:Both the main and the epistatic QTL variance were estimated satisfactorily with FIA (Table 3), although the average epistatic variance tended to be slightly overestimated for
s2
12¼0 and s212¼5 because the distribution of esti-mates was highly skewed. Most estiesti-mates were, however, very close to the true value with the medians fors2
12¼0 being,0.02. The estimated residual variances were all close to the simulated ones with no bias detected in any of the simulated cases (results not shown). Thus, FIA gives accurate estimates of the QTL variances also when there are substantial epistatic effects. The estimated within-line correlation was, however, confounded with the epistatic variance, giving an increased ˆrfor cases 2 and 3 when s2
12¼5 and s 2
12¼10. We may therefore expect that the estimated degree of segregation within lines is conservative in the presence of epistasis.
Analyses of experimental data:European wild boar3
Large White F2cross:In the scan of chromosome 6 for the
meat quality trait EEL (reflectance score), FIA gave a maximum score value of 135.9 (LR¼33.3 from REML) and the Haley–Knott regression resulted in LR¼3.5. Both maxima were located at 80 cM (Figure 2). The LR for a segregating QTL vs. a fixed QTL was 26.0 (P ,
0.01) with an estimated within-line correlation of ˆr¼
0:0. The 1% chromosomewise significance threshold was obtained using 10,000 permutations. The estimates for different within-line correlations were ˆrA¼0:0 and ˆ
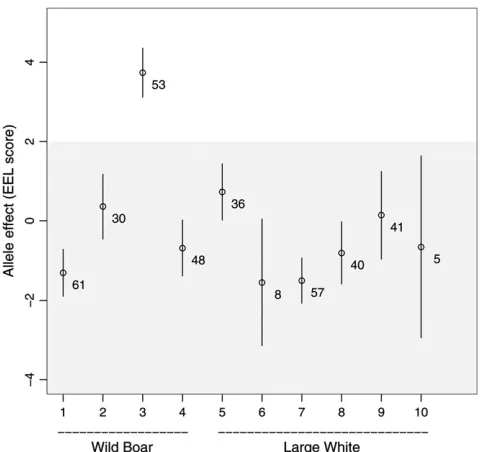
rB¼0:79, thus indicating that the QTL is segregating within the wild boars but not within the domestic pigs. The estimates of the allelic effects clearly show that only one of the wild boar alleles (allele no. 3) carries the halothane mutation (Figure 3).
Red Jungle Fowl 3 White Leghorn F2 intercross: Six
genomewide significant QTL were detected with both FIA and Haley–Knott regression (Table 4). FIA showed that at least two of the six QTL segregate within the founder lines. The segregating QTL are located on chromosomes 1 and 27. The REML estimates (chromo-some 1, 488 cM: ˆrA¼0:87, ˆrB ¼0:0; chromosome 27, 21 cM: ˆrA¼1:0, ˆrB ¼0:0) and the estimated allele effects (Figures 4 and 5) indicate that both QTL are segregating among the White Leghorn base individuals but not within the Red Jungle Fowl male. Moreover, for both of the two segregating QTL, it was possible to separate the allele effects into three distinct groups (Figures 4 and 5), indicating that these QTL are triallelic.
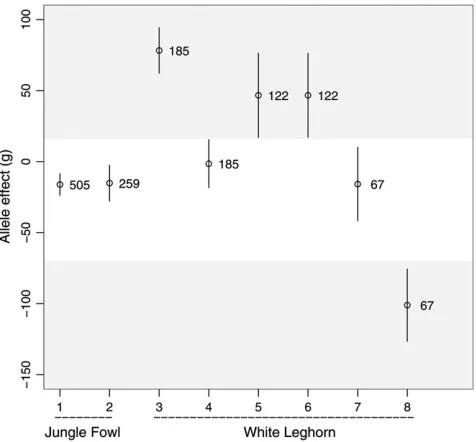
An additional QTL on chromosome 5 was segregating according to the test for fixation (P¼0.01, Table 4), but the REML estimates for the model with different within-line correlations did not converge. The estimates of the base allele effects (Figure 6) were significantly different within the Jungle Fowl founder, whereas the differences within the White Leghorn founders were relatively small.
The QTL heritabilities (calculated ass2 v=s˜
2 e, with ˜s
2 e¼ 29614.4 estimated as the residual variance without any
TABLE 2
Likelihood ratios from Haley–Knott regression with additive effects and FIA together with the estimated within-line correlation (r) for four simulated scenarios
FIA
Haley–Knott Simulated casesa Simulatedr Estimatedr Likelihood ratio likelihood ratio
Case 1 1.00 0.99 (0.001)b 168.1 (2.5)b 174.3 (2.5)b
Case 2 0.68 0.71 (0.009) 160.6 (2.1) 130.5 (2.3)
Case 3 0.20 0.21 (0.011) 150.4 (2.4) 44.3 (1.9)
Case 4 0.00 0.0004 (105) 152.9 (2.5) 2.3 (0.5)
a
The simulated cases 1–4 cover scenarios from total fixation to complete segregation within lines. One hun-dred replicates of an F2pedigree with four founders and 800 F2individuals with a strong QTL effect having a
20% heritability were simulated.
b
random effect in the model) were between 0.04 and 0.10. The 5% genomewide significance threshold was calculated from 1000 replicates of permuted data.
DISCUSSION
We have developed a new, general and powerful method for QTL detection in line-cross experiments, which does not rely on the assumption of fixation within founder lines. The method is based on VC theory and includes a parameter of within-line correlation to model segregation of QTL within the founder lines. It uses the
score statistic for significance testing, which enables fast and robust genome scans based on empirical signifi-cance thresholds. The new method, FIA, is powerful in detecting fixed and segregating QTL and provides good estimates of epistasis among QTL. Our simulations showed that the reduction in power, compared to Haley–Knott regression, was only marginal for fixed QTL, whereas the gain in power was substantial for segregating QTL. Since the power to detect fixed QTL is high in F2line crosses, the advantage of getting a major increase in the power to detect segregating QTL supersedes the minor reduction in the power to detect fixed QTL, and we Figure1.—Power to detect a QTL with Haley–Knott regression (HK) and FIA for the four simulated cases presented in Table 1, ranging from total fixation (case 1) to complete segregation within lines (case 4). Four different types of F2pedigrees were
sim-ulated: (a) small base (4 founders) and 800 F2individuals, (b) small base and 200 F2individuals, (c) large base (50 founders) and
800 F2individuals, and (d) large base and 200 F2individuals. For the pedigrees with 800 F2individuals, 1000 replicates were
sim-ulated with a 2% QTL heritability. For the pedigrees with 200 F2individuals, 5000 replicates were simulated with a 5% QTL
therefore recommend FIA as a standard QTL method in F2intercross designs.
A substantial gain in power, compared to Haley–Knott regression, was also shown in real data (Figure 2) from a European Wild Boar3Large White F2cross, where the functional halothane gene affecting meat quality as well as the mutated base generation allele could be identi-fied using FIA but not with Haley–Knott regression. In the analyses of body weight in the Red Jungle Fowl3
White Leghorn F2 cross, there was a tendency for the estimated within-line correlation to decrease with the level of the QTL effect (Table 4). The reason for this decrease is not known, but it might be due to chance,
since the uncertainty of ˆrincreases as the QTL effect decreases, or has an underlying genetic explanation as it is more likely that QTL with large effects have been fixed during selection for increased body weight.
The method was given for an F2 pedigree, but the extension to backcrosses, deeper pedigrees (e.g., ad-vanced intercross lines; Darvasiand Soller1995), and
several founder lines (e.g., heterogeneous stocks; Talbot
et al. 1999) is relatively straightforward since it is a VC-based method. The only principal modification needed is to construct suitable IBD matrices and, in the case of
TABLE 3
Estimated within-line correlation (r) and variance components (variance of main QTL effects2 v,
epistatic variances2
12) for four simulated scenarios
Simulated values s2
12¼0 s
2
12¼5 s
2 12¼10
r s2
v rˆ sˆ
2
v sˆ
2
12 rˆ sˆ
2
v sˆ
2
12 rˆ sˆ
2
v sˆ
2 12
Case 1 1.00 10.0 0.98 10.63 0.40* 1.00 10.86 5.45 1.00 13.73 9.71
Case 2 0.68 8.80 0.66 8.74 0.38* 0.80 8.38 5.80 0.88 8.94 10.63
Case 3 0.20 6.25 0.21 6.29 0.63* 0.34 5.78 5.87 0.46 5.15 11.35
Case 4 0.00 4.44 0.00 4.62 0.44* 0.02 3.70 5.83 0.02 4.02 10.28
The simulated cases 1–4 cover scenarios from total fixation to complete segregation within lines. One hundred replicates of an F2pedigree with four founders and 800 F2individuals with a QTL effect having a 5% heritability in an outbred base population
were simulated. Bias withP,0.05 is in italics,P,0.01 is underlined, and * indicates biased estimates (P,0.01) but with median value,0.02.
Figure 2.—Scan of pig chromosome 6 in a Wild Boar3 Large White intercross for the reflectance (EEL) score. The curves given are the score statistic from the FIA model (solid line) and the Haley–Knott LR values (dashed line). The scale of the right-hand axis has been transformed such that the heights of the two curves correspond to approximately the same significance level. The dotted line is the 1% chromoso-mewise significance level.
Figure 3.—Estimated base generation allele effects (61 SE) of the reflectance (EEL) score from the Wild Boar3
Large White intercross. Eight alleles from the domestic line were not transmitted to the F2and only 10 of the total 20 base
generation alleles had two or more copies in the F2
genera-tion. The numbers indicate the expected number of copies in the F2 generation. Estimated effects for alleles with two
or less copies had large standard errors and are not included. Allele no. 3 was known to be the only carrier of the halothane mutation. TheHalN-type alleles are shown in the shaded
several founder lines, allow for several within-line corre-lations. An analysis of heterogeneous stocks, for instance, could enable estimation of correlations between founder line QTL effects and thereby improve QTL detection. Previous studies indicate that similarities between the founder lines vary between genome positions (Talbot
et al. 1999). We might therefore expect to get different correlation estimates at different QTL positions. An analysis of this kind should improve our understanding of how the QTL were generated in the founder lines.
Following the modeling of Meuwissenand Goddard
(2000), we included both the between- and the within-line effects as random. There are several advantages of using a pure random QTL-effects model. Including a potential QTL as a fixed effect in a linear model does not account for the extra sampling variation due to uncertain transmission of alleles through the pedigree (Xu1998a;
Feenstra et al. 2006), whereas a VC approach does
Figure 4.—Estimated base generation allele effects for growth 2 (Table 4) on chromosome 1 (61 SE) in the Red Jun-gle Fowl3White Leghorn F2intercross. The studied trait was
body weight (grams) at 200 days of age. The numbers indicate the expected number of copies of the founder alleles in the F2
generation. The shaded regions show the clustering of the suggested triallelic QTL.
Figure 5.—Estimated base generation allele effects for growth 13 (Table 4) on chromosome 27 (61 SE) in the Red Jungle Fowl3White Leghorn F2intercross. The studied
trait was body weight (grams) at 200 days of age. The numbers indicate the expected number of copies of the founder alleles in the F2generation. There was no marker information to
sep-arate alleles 5 and 6, and they were therefore merged in the analysis to estimate a common effect for both alleles. The shaded regions show the clustering of the suggested triallelic QTL.
TABLE 4
Genomewide significant QTL for body weight at 200 days of age using Haley–Knott regression with additive effects and FIA, and estimated levels of fixation within founder lines, from an F2Red Jungle Fowl3White Leghorn intercross
Haley–Knott FIA
Chr.
Pos. (cM)
Locus namea
LR:
H0: no QTL Chr.
Pos.
(cM) Score
LR:
H0: no QTL s2v r
P-value:b
H0: fixed QTL
1 102 Growth 1 249.6c 1 102 22,312c 235.0 1,755 1.00 1.00
1 488 Growth 2 69.2c 1 488 2,222c 73.0 2,448 0.17 ,0.01
5 32 Growth 8 14.9d 5 32 99.6d 18.0 2,903 0.86 0.01
6 30 New 13.6d 6 30 85.8d 11.4 1,300 0.80 0.10
27 20 Growth 13 12.8d 27 21 89.1d 23.6 2,919 0.00 ,0.01
28 35 New 13.8d 28 35 101.6d 12.4 1,219 0.00 0.05
Chr., chromosome; Pos., position.
aLocus name as assigned in Kerjeet al. (2003). The QTL on chromosomes 6 and 28 were not detected in Kerjeet al. (2003)
where a less dense marker map was used.
b
Calculated from the likelihood-ratio test statistic1 2x
2 0:12x
2
1distributed under the null hypothesis (Selfand Liang1987). c
1% genomewide significance.
d
(Ro¨ nnega˚ rdand Carlborg2007). Moreover, Xu(1998b)
pointed out that the interpretation in terms of herit-abilities and average gene substitution effects is concep-tually more logical in VC modeling than in models where the family-specific QTL effects are included as fixed effects. Furthermore, when the parameters of in-terest are modeled as a combination of fixed and random, model selection using a residual likelihood is not straightforward (Welham and Thompson 1997)
since the residual likelihood is based on the residual values after fitting the fixed effects. Hence, standard derivative-based REML estimation algorithms cannot be used, and the method of Perez-Enciso and Varona
(2000), therefore, maximizes the likelihood with a rel-atively slow nonderivative algorithm. The method of Perez-Encisoand Varona(2000) may be powerful but
is too slow for practical use in large-scale QTL studies where empirical thresholds are desirable.
The nested within-half-sib family model developed by Knottet al. (1996) allows for QTL segregating within
lines and is simple and fast. Its use in F2intercrosses is, however, limited to pedigrees with a low degree of relationship between the F1individuals. Moreover, the power decreases with the number of F1males, because each male is assumed to have fixed and independent QTL effects.
In our model, we did not include dominance. Dom-inance is possible to implement in a VC model assuming an outbred base population (e.g., Xu1996). Including
dominance in our segregation model should be feasible by incorporating the two dominance IBD matrices (Xu
1996) obtained by letting the base generation alleles be
all independent in the first matrix and fixed within lines in the second matrix. Dominance was not included here to keep the model and the analyses simple. FIA did not detect the two QTL with large dominance effects published in Kerjeet al. (2003) and our intention is to
develop the model to include dominance in the future. Our analysis of additive-by-additive epistasis showed that both the variance component of the main QTL effect and the epistatic effect could be adequately estimated. The within-line correlation was, however, overestimated when epistasis was included. This bias might be explained by the fact that we did not include the within-line correlation in the interaction part of the model. We plan to include within-line correlation in the modeling of epistasis, which will require a REML algorithm that allows a nonlinear VC model since the parameterris included both in the variance component of the main effect and the epistatic effect.
We used a common correlation within lines in the genome-scan model. A possible extension would be to use a model with different correlations within the two founder lines. We do, however, recommend that the number of parameters (and the degrees of freedom used) should be as few as possible, not to decrease the power to detect fixed QTL. For the same reason, we do not expect that different QTL variances in the two founder lines would improve the model.
The REML estimates for different within-line corre-lations did not converge for the QTL on chromosome 5. Convergence problems in REML are common when many VCs are included and our model with different within-line correlations includes three different VCs for the QTL effect plus the residual variance. The observa-tion that the QTL is likely to be segregating only within the jungle fowl founder line (Figure 6), consisting of a single individual and only two alleles, can also be a reason why the model did not converge. One of the great advantages of using the score statistic in the genome scan is that problems of convergence are completely avoided, since the calculation of the score statistic is noniterative.
The computational requirements with FIA are higher than with Haley–Knott regression, but the computation time is still low. For the simulated pedigree with 800 F2 individuals, the computation time at one position for Haley–Knott regression was,1 sec whereas the calcu-lations of our score statistic took,10 sec (on a standard laptop computer 1.33 GHz PowerPC G4). Including epistasis (Equation 5) increased the computation time to,20 sec. Our implementation of the score statistic in R was not numerically optimized and we may therefore expect the computation time to be reduced even further in the future.
When generating F2pedigrees with large base gener-ations for QTL analyses it is plausible that several base generation alleles will be represented only with few or no copies in the F2 generation. Hence, a substantial pro-Figure 6.—Estimated base generation allele effects for
growth 8 (Table 4) on chromosome 5 (61 SE) in the Red Jun-gle Fowl3White Leghorn F2intercross. The studied trait was
body weight (grams) at 200 days of age. The numbers indicate the expected number of copies of the founder alleles in the F2
portion of the genetic information about segregation among the founders cannot be utilized. Our results show that the power to detect QTL segregating within lines increases when there are few F0and many F2individuals, since there will be more copies of each base generation allele among the F2individuals. Increasing the number of founders will, however, increase the chance of having alleles with different effects if they are not fixed within lines. Our simulations were not designed to recommend an optimum number of founders to be used in F2 inter-crosses, but the results showed a clear increase in power to detect QTL segregating within lines when the ratio of F2to F0individuals was increased from 16 to 50 (Figure 1). On the basis of these results, a rough guideline would be to use ,20 founders for an intercross of 1000 F2 individuals.
A major advantage of our model is that it is quite general and easy to implement. We therefore expect that the method will have large practical importance for future QTL analyses of line crosses. The information that the method gives about which QTL that are likely to segregate within lines, the number of alleles having different effects, and which founders that are likely to carry these will be useful for fine mapping of QTL and detection of functional genes. The ability to obtain this new information in a single analysis with a method that has the same, or higher, power as the most frequently used method in all evaluated scenarios indicates that it will be the method of choice in the future. For more complex models with,e.g., dominance and linked QTL, further investigation is required.
LITERATURE CITED
Anderson, M. J., and C. F. J. TerBraak, 2002 Permutation tests for
multi-factorial analysis of variance. J. Stat. Comput. Simul.73:85– 113.
Andersson, L., 2001 Genetic dissection of phenotypic diversity in
farm animals. Nat. Rev. Genet.2:1–11.
Andersson-Eklund, L., L. Marklund, K. Lundstro¨ m, C. S. Haley,
K. Anderssonet al., 1998 Mapping quantitative trait loci for
carcass and meat quality traits in a Wild Boar x Large White in-tercross. J. Anim. Sci.76:694–700.
Brockmann, G. A., C. S. Haley, U. Renne, S. A. Knott and M.
Schwerin, 1998 Quantitative trait loci affecting body weight
and fatness from a mouse line selected for extreme high growth. Genetics150:369–381.
Carlborg, O¨ ., and C. S. Haley, 2004 Epistasis: Too often neglected
in complex trait studies? Nat. Rev. Genet.5:618–625.
Churchill, G. A., and R. W. Doerge, 1994 Empirical threshold
val-ues for quantitative trait mapping. Genetics138:963–971. Cox, D., and C. Hinkley, 1974 Theoretical Statistics. Chapman &
Hall, London.
Darvasi, A., and M. Soller, 1995 Advanced intercross lines, an
ex-perimental population for fine genetic mapping. Genetics141:
1199–1207.
Davison, A. C., and D. V. Hinkley, 1997 Bootstrap Methods and Their
Application. Cambridge University Press, Cambridge, UK/ London.
Feenstra, B., I. M. Skovgaardand K. W. Broman, 2006 Mapping
quantitative trait loci by an extension of the Haley–Knott regres-sion method using estimating equations. Genetics173: 2269– 2282.
Fernando, R. L., and M. Grossman, 1989 Marker-assisted selection
using best linear unbiased prediction. Genet. Sel. Evol.21:467– 477.
Goddard, M. E., 1992 A mixed model for analyses of data on
mul-tiple genetic markers. Theor. Appl. Genet.83:878–886. Goldgar, D. E., 1990 Multipoint analysis of human quantitative
ge-netic variation. Am. J. Hum. Genet.47:957–967.
Good, P., 2005 Permutation, Parametric, and Bootstrap Tests of
Hypothe-sis, Ed. 3. Springer, New York.
Haley, C. S., S. A. Knottand J. M. Elsen, 1994 Mapping
quantita-tive trait loci in crosses between outbred lines using least squares. Genetics136:1195–1207.
Henderson, C. R., 1953 Estimation of variance and covariance
com-ponents. Biometrics9:226–252.
Jacobsson, L., H. B. Park, P. Wahlberg, R. Fredriksson, M. Perez
-Encisoet al., 2005 Many QTLs with minor additive effects are
associated with a large difference in growth between two selec-tion lines in chickens. Genet. Res.86:115–125.
Johnson, D. L., and R. Thompson, 1995 Restricted maximum
likeli-hood estimation of variance components for univariate animal models using sparse matrix techniques and average information. J. Dairy Sci.78:449–456.
Kerje, S., O¨ . Carlborg, L. Jacobsson, K. Schu¨ tz, C. Hartmann
et al., 2003 The twofold difference in adult size between the red junglefowl and White Leghorn chickens is largely explained by a limited number of QTLs. Anim. Genet.34:264–274. Knott, S. A., J. M. Elsenand C. S. Haley, 1996 Methods for
mul-tiple-marker mapping of quantitative trait loci in half-sib popula-tions. Theor. Appl. Genet.93:71–80.
Knott, S. A., L. Marklund, C. S. Haley, K. Andersson, D. Davies
et al., 1998 Multiple marker mapping of quantitative trait loci in a cross between outbred Wild Boar and Large White pigs. Genet-ics149:1069–1080.
Lundstro¨ m, K., A. Karlsson, J. Ha˚ kansson, I. Hansson, M. Johansson
et al., 1995 Production, carcass and meat quality traits of F2-crosses between European wild pigs and domestic pigs including halothane gene carriers. Anim. Sci.61:325–331.
Lynch, M., and B. Walsh, 1998 Genetics and Analysis of Quantitative
Traits. Sinauer Associates, Sunderland, MA.
Meuwissen, T. H. E., and M. E. Goddard, 2000 Fine mapping of
quantitative trait loci using linkage disequilibria with closely linked marker loci. Genetics155:421–430.
Mitchell, B. D., S. Ghosh, J. L. Schneider, G. Birznieksand J.
Blangero, 1997 Power of variance component linkage analysis
to detect epistasis. Genet. Epidemiol.14:1017–1022.
Patterson, H. D., and R. Thompson, 1971 Recovery of inter-block
in-formation when block sizes are unequal. Biometrika58:545–554. Perez-Enciso, M., and L. Varona, 2000 Quantitative trait loci
map-ping in F2 crosses between outbred lines. Genetics155:391–405. Perez-Enciso, M., R. L. Fernando, J. P. Bidanel and P. Le Roy,
2001 Quantitative trait locus analysis in crosses between outbred lines with dominance and inbreeding. Genetics159:413–422. Pong-Wong, R., A. W. George, J. A. Woolliamsand C. S. Haley,
2001 A simple and rapid method for calculating identity-by-de-scent matrices using multiple markers. Genet. Sel. Evol.33:453–471. Putter, H., L. A. Sandkuijland J. C.vanHouwelingen, 2002 Score
test for detecting linkage to quantitative traits. Genet. Epidemiol.
22:345–355.
R DevelopmentCoreTeam, 2004 R: A Language and Environment for
Statistical Computing. R Foundation for Statistical Computing, Vienna. http://www.r-project.org.
Ro¨ nnega˚ rd, L., and O¨ . Carlborg, 2007 Separation of base allele
and sampling term effects gives new insights in variance compo-nent QTL analysis. BMC Genet.8:1.
Ro¨ nnega˚ rd, L., R. Pong-Wongand O¨ . Carlborg, 2008 Defining
the assumptions underlying modelling of epistatic QTL using variance component methods. J. Hered. (in press).
Self, S. G., and K.-Y. Liang, 1987 Asymptotic properties of
maxi-mum likelihood estimators and likelihood ratio tests under non-standard conditions. J. Am. Stat. Assoc.82:605–610.
Talbot, C. J., A. Nicod, S. S. Cherny, D. W. Fulker, A. C. Collins
et al., 1999 High resolution mapping of quantitative trait loci in outbred mice. Nat. Genet.21:305–308.
Tang, H.-K., and D. Siegmund, 2001 Mapping quantitative trait loci
Wang, T., R. L. Fernandoand M. Grossman, 1998 Genetic
evalu-ation by best linear unbiased prediction using marker and trait information in a multibreed population. Genetics148:507–515. Welham, S. J., and R. Thompson, 1997 Likelihood ratio tests for
fixed model terms using residual maximum likelihood. J. R. Stat. Soc. Ser. B (Methodol.)59:701–714.
Xu, S., 1996 Computation of the full likelihood function for
estimat-ing variance at a quantitative trait locus. Genetics144:1951–1960. Xu, S., 1998a Further investigation on the regression method of
mapping quantitative trait loci. Heredity80:364–373.
Xu, S., 1998b Mapping quantitative trait loci using multiple families
of line crosses. Genetics148:517–524.
Communicating editor: L. McIntyre
APPENDIX: DERIVING THE THEORETICAL VALUES OF THE VARIANCE COMPONENTS FOR CASES 1–4
The theoretical values of the variance components for cases 1–4 can be derived using Henderson’s (1953) method 1. It is important to keep in mind that the estimated variances in a VC model are measures of the variances in the population that the founders were taken from. If themfounders are outbred, the 2mQTL alleles are independently sampled from a common metapopu-lation, whereas if the two founder lines are fixed then only two QTL alleles have been drawn from the common metapopulation of alleles. Hence, a VC QTL model estimates the QTL variance of this metapopulation.
Letybe the vector of allele effects in the founders and a the simulated QTL allele effect. Then for the small base population with four founders we have for cases 1, 2, 3, and 4, respectively,
y¼ 0 0 a a a a a a 0 B B B B B B B B B B @ 1 C C C C C C C C C C A
;y¼
0 0 a a a 0 a a 0 B B B B B B B B B B @ 1 C C C C C C C C C C A
;y¼
0 0 0 a a a 0 a 0 B B B B B B B B B B @ 1 C C C C C C C C C C A
;y¼
0 a 0 a 0 a 0 a 0 B B B B B B B B B B @ 1 C C C C C C C C C C A :
Let Zbe the incidence matrix relating the founder allele effects to lines. Then for cases 1, 2, and 4 we have
Z¼ 1 0 1 0 0 1 0 1 0 1 0 1 0 1 0 1 0 B B B B B B B B B B @ 1 C C C C C C C C C C A
and for case 3
Z¼ 1 0 1 0 1 0 1 0 0 1 0 1 0 1 0 1 0 B B B B B B B B B B @ 1 C C C C C C C C C C A :
For simplicity, we assume that the only fixed effect we have is the population mean, which is the case in our simulations also. Letube the parameter vector
u¼ m2 s2b s2w
0 B @ 1 C A;
where mis the population mean from which the QTL alleles have been sampled,s2
bis the variance between lines ands2
wis the within-line variance. The genotypic QTL variance is then given by 2 s2
b1s 2 w
and the within-line correlation is given by
s2b s2b1s2w
:
The theoretical value for the genotypic variance is easy to obtain intuitively for case 1. In case 1 the random effects are known to be1
2a and 1
2a givenyabove, and since they have been sampled from a common popula-tion of allelic effects the estimated variance of this population isð1=ðN 1ÞÞPN
i¼1 12a 2
withN¼2, which is equal to1
2a
2, and the genotypic variance is twice the allelic variance. Hence, the genotypic variance isa2for
case 1.
For cases 2–4, it is more difficult to derive the expectation ofu intuitively. The expectation ofu may then obtained from Henderson’s method 1 as
u¼A1w;
where
w¼
y9y 1 n0y9Jy
y9ZðZ9ZÞ1Z9y 0 B @ 1 C A;
wheren0¼8 andJis ann03n0matrix of ones,
A¼
n0 n0 n0 n0 trðQ2ZZ9Þ trðQ2Þ
n0 trðQ3ZZ9Þ trðQ3Þ
0 @
1 A;
whereQ2 ¼ ð1=n0ÞJ, andQ3¼ZðZ9ZÞ
1