Comparative Analysis of Clustering & Enhancing
Classification Using Bio- Inspired Approaches
Navpreet Rupal 1, Poonam Kataria 2
1&2 Department of CSE, SUSCET, Tangori, Distt.Mohali,
Punjab ,India
Abstract — Data Mining is a technique of discovering hidden patterns & relationship in data with the help of various tools & techniques to make a valid prediction . Clustering is defined as process of partitioning a set of objects or data into a set of meaningful sub-classes called as clusters. It helps the users to understand the structure in a data set. Classification groups the data under different classes. Bio- inspired approaches are various evolutionary algorithms inspired from nature and solves hard and complex computing problems. In this work , we first form the clusters of the dataset of a bank with the help of h-means clustering. This work is also based on comparative study of GA, PSO & BFO based Data clustering methods. To compare the results we use different performance parameters for classification such as precision, cohesion, recall and variance. The results prove that BFO yields better outputs as compared to GA and PSO. So this work shows that BFO results as a better optimization technique
Keywords— Data Mining; Clustering; Bio-inspired approaches; GA; BFO; PSO
I. INTRODUCTION
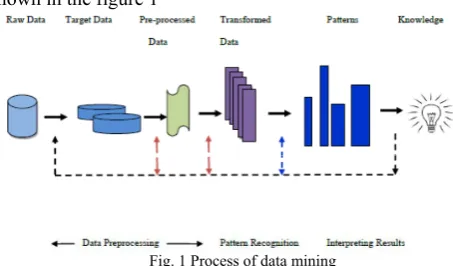
Recent development in science and technology has given a big rise to the data in the data warehouse, so it becomes a cumbersome task to the information required. To solve this problem, various data mining techniques has been proposed. Data mining simply means to extract the data from the database, but to improve the result of query these data mining techniques have to be more efficient in order to get the optimized result of a query. Thus data mining is a process through which data is discovered with respect to its pattern and interrelationship because of which it has become a powerful tool. The process of data mining is shown in the figure 1
Fig. 1 Process of data mining
The data mining process involves various techniques and methods such as clustering, classification, association, regression, pattern matching etc. Here classification maps each data element to one of a set of pre-determined classes
based on the difference among data elements belonging to different classes. Clustering groups data elements into different groups based on similarity between elements within a single group. Association is a rule of form, if X then Y denoted by X-> Y.Regression uses a numerical data set to develop a best fit mathematical formula. Pattern Matching allows predicting behaviour patterns and trends based on the sequential rule A->B which implies that event B will always be followed by A. The paper here presents an overview of pattern clustering methods from a statistical pattern recognition perspective with a goal of providing useful advice and references to fundamental concepts accessible to the broad community of clustering practitioners. Different approaches to clustering data can be described. The other representations of clustering methodology are possible. At the top level, there is a distinction between hierarchical and partitioned approaches (hierarchical methods produce a nested series of partitions while partitioned methods produce only one) [8].
II. PROPOSED METHODOLOGY
As discussed earlier, data mining is a technique of discovering the hidden patterns of data which helps in decision making. Classification is the supervised learning technique that maps each data element to one of a set of pre-determined classes based on the difference among data elements belonging to different classes. Clustering groups the data elements under different groups based on similarity between within a single group.
There are number of artificial intelligence techniques which helps in data mining to get the optimized result of the query. Various bio-inspired approaches (Genetic Algorithm, Particle Swarm Optimization, Bacterial Foraging Optimization) will be compared on the basis of performance parameters of classification (precision, recall, cohesion, variance) and therefore enhancement will be done.
• To form the clusters of the dataset using H- means clustering.
• To study and implement the various bio-inspired techniques GA,PSO, BFO on the dataset of a bank.
• To make enhancement through various performance parameters for evaluation of classification scheme.
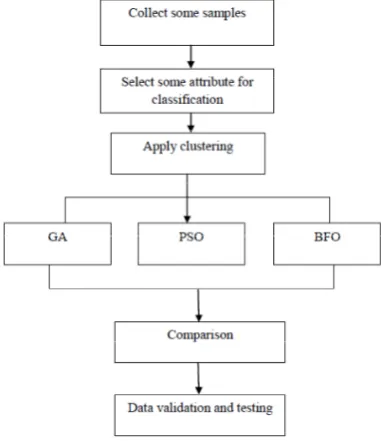
The proposed model focuses on the above objectives which are helpful in improving the classification parameters and are practically implemented using MATLAB 7.11.0 environment. In this proposed work, we used Bacterial foraging optimization algorithm to enhance the classification process. This algorithm provides better results as compare to previous techniques. The data set chosen for the experimental simulation test was of a bank and that was obtained from the UCI Repository of Machine Learning Databases.. The work is proposed to be completed in following stages which have to be preceded in parallel fashion, as described below in Figure 2:
Figure 2: Basic Design of the System
2.1 Database used for mining Samples
The data set chosen for the experimental simulation test were obtained from the UCI Repository of Machine Learning Databases. Dataset of a bank is taken for the experimental work..
Attributes
The dataset taken is of a bank which is extracted from UCI Repository. It is a multivariate data set and it has 17 attributes and 45222 instances. The description of dataset is shown as below. The attributes on which experimental work is done is age and balance.
TABLE 1: TESTED ATTRIBUTES
Att. No.
Testing Attribute Symbols
1 Age Age
2 Type of job Job
3 Marital Status Marital
4 Educational details Educational
5 Balance Balance
6 Housing required Housing
7 Loan Availed Loan
8 Type of contact Contact
9 Duration time Duration
10 Pay days Pdays
III.H-MEANS CLUSTERING
K-means algorithm performs clustering based on partitioning the total population as k-number of clusters. The convergence speed depends on the number of iterations chosen for achieving stated clusters. k-means+ algorithm may contain empty clusters. The L loyd’s h-means+ algorithm improve the concept of k-mean+ algorithm. It is more appropriate for finding a local optimal solution and is faster compared to k-means. The h-means+ algorithms improve the cluster classification by performing iterations in order to reduce error function. This algorithm includes repeats until loop which is executed repeated until optimal clustering is obtained with non-empty clusters. The two algorithms can be used together referred as two-phase hk-means algorithm. The optimal partitioning works well or not it depends upon the randomly and initially chosen partition classes for the formation of clusters. Subsequently the partitioning is optimized by minimizing the distance among the objects in a cluster in terms of minimum sum squared error. Algorithm iterations can remove empty clusters if found during the execution. Additional clusters are added to the current partition and computation is repeated until an optimal partition is obtained. The algorithm also searches for outliers. If outliers are found these are removed from clusters. This operation splits one cluster in two parts to increase the value of k. The algorithm also looks for overlapping clusters and if found these are merged to form one unique cluster. H-means+ algorithm execution steps can be summarized as follows.
Step 1: Assign each sample randomly to one of the
k-clusters
Step 2: repeat until all samples assigned to clusters Step 3: Compute t, the number of empty clusters
Step 4: If some of the clusters are empty, then find the t
samples farther from their centers
Step 5: for each of these t samples, assign the sample to an
empty cluster, end for, end if
Step 6: Compute center for each of the clusters while
clusters are not stable
Step 7: for each sample compute the distances between
Samples and all the centers
Step 8: Find the location of the sample which is close to the
center
Step 9: Assign Sample to the cluster, end for, end while Step 10: Re-compute all the centers until all the clusters are
non-empty
The main functions of the h-means+ algorithm involve
selecting of clusters and determining precision, recall, cohesion, variance for 2 attributes. Subsequently the classes are tested for positive and negative conditions.
IV.OPTIMIZATION BASED CLUSTERING
4.1 Genetic Algorithm
Genetic algorithms can be considered as a search technique whose algorithm is based on the mechanics of natural selection and genetics. It has been used in realms as diverse as search optimization and machine learning problems since they are not restricted by problem specific assumptions such as continuity or unimodality. In rough terms a genetic algorithm creates a collection of possible solutions to a specific problem. Initially the solutions are typically randomly generated solutions so their initial performance is normally poor. No matters how bad, there will be small segments of our collection of solutions that will be nearby our desired solution that is partially correct answers. Genetic Algorithms exploit this characteristic by recombination and progressively creating better solutions so that by the end of the run one have achieved one solution that is at least nearly optimal.[16]
The flow steps of genetic algorithm for finding a solution of a given problem may be summarised as follows.
Step 1: Initialize population for possible solution
Step 2: Generate chromosomes of a population with 0’s and 1’s randomly
Step 3: If the solution is satisfied then terminate else jump to next step
Step 4: Compute population fitness value Step 5: Initialize number of generation
Step 6: While number of generation * 2 ≤ termination condition; do
Step 7: Select all the genetic solutions which can propagate to next generation
Step 8: Increment number of generation Step 9: Identify each bit in genetic solution
Step 10: Perform crossover operation up to until 50% of bits are crossed
Step 11: end while
Step 12: if the solution is efficient then terminate else perform mutation operation up to 0.05%
A genetic algorithm searches best solution within a collection of large number of solutions of a problem being solved. Figure 3 shows the cluster forming by using Genetic Algorithm.
Figure 3: GA Clustering
4.2 Bacterial Foraging Optimization
Bacterial foraging Optimization is a type of evolutionary algorithm which estimates cost function after each iterative step of program and finally gives the better fitness. The parameters to be optimized represent coordinates of bacteria. Bacteria is positioned at different coordinates. At each progressive step, the bacteria move to new point and each position cost function is calculated.
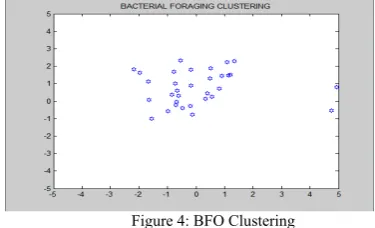
decided by decreasing direction of cost function. This finally leads to position with highest fitness. The foraging strategy of E.Coli is governed by four processes. i.e. Chemotaxis, Swarming, Reproduction, Elimination & Dispersion. When bacterium meets favourable environment it continues swimming in same direction. The increase in cost function represents unfavourable environment and then tumbles. In swarming, bacteria move out from their respective places in ring of cells by bringing mean square to minimum value.[24] Figure4 shows BFO clustering.
Figure 4: BFO Clustering
4.3 Particle Swarm Optimization
PSO is a computational method that optimizes a problem by trying to improve a candidate solution through a number of iterations with respect to quality. In PSO, each single solution is a bird in a search space, call it a “particle”. All of the particles have fitness values which are to be evaluated by fitness function to be optimized. Each particle has velocity and position . at each iteration it updates particles for two best values pbest(best fitness it has achieved so far) and gbest(best value obtained by any particle). PSO combines local search method and global search method to balance exploration and exploitation. Figure 5 shows the cluster forming by using Particle Swarm Optimization Algorithm.
Figure 5: PSO Clustering
V. RESULTS ANALYSIS BASED ON PARAMETERS
A. Implementation of BFO
The figure 6 shows the implementation of BFO on dataset of a bank.
The clusters formed from the dataset is represented in the figure 7. In this graph the clusters are in the form of circles and the dataset under the clusters are symbolise by same colour.
Figure 7 Clusters formation
B. Performance Parameters for Classific C. ation
Performance metric measures how well your data mining algorithm is performing on a given dataset. For example, if we apply a classification algorithm on a dataset, we first check to see how many of the data points were classified correctly. The various parameters taken for performance evaluation are as follows:
1 Precision:- It is also known as positive predictive value which is fraction of retrieved instances that are relevant 2 Recall :- It is defined as a set of relevant documents (e.g. the list of all documents on the internet that are relevant for a certain topic)
3 Cohesion:- It measures how closely objects in the same cluster are related
4 Variance:- Variance measures how distinct or well separated are clusters from each other
D. Results
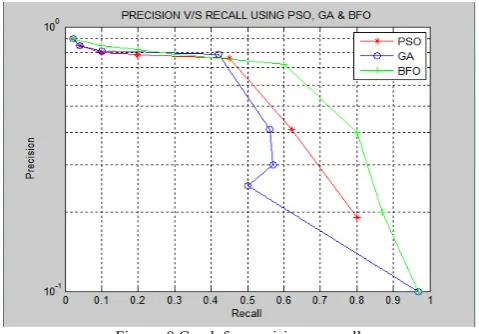
The Precision v/s Recall graph using PSO, GA and BFO is represented in the figure 8 . In the figure, x -axis represents recall and y- axis represents precision. BFO has highest precision for low recall values, while PSO has highest precision for high recall value. Genetic Algorithm is worse than BFO and PSO
Figure 8 Graph for precision vs recall
In the figure 9, the x-axis represent precision and y-axis represent cut-off similarity . This graph shows that
precision increases with respect to similarity. BFO has highest precision followed by PSO and GA.
Figure 9 Precision with Cut-off Similarity Using GA, PSO & BFO
In the figure 10, precision using PSO and BFO is taken into account to check it on more closer detail. This graph indicate BFO is better, recall increases as precision increases.
Figure 10 Precision Using PSO & BFO
In the figure 11, the graph shows recall with cut-off similarity using GA and BFO. This graph indicate BFO is better, cut-off increases as recall decreases.
Figure 11 Recall with Cut-off Similarity
Comparison of Evaluation Parameters
TABLE 2 COMPARISON OF GA,PSO,BFO ON THE BASIS OF EVALUATION PARAMETERS
Data
name Parameters GA PSO BFO
Data 1
Cohesion .3079 .6850 .7120
Variance .3910 .2910 .1634
Precision .20 .32 .41
Recall .29 .31 .40
Data 2
Cohesion .4008 .6221 .7890
Variance .2450 .2301 ..2010
Precision .32 .36 .39
Recall .26 .34 .46
Data 3
Cohesion .5087 .8012 .8490
Variance .4960 .3810 .2816
Precision .49 .52 .64
Recall .31 .35 .40
VI.CONCLUSION &FUTURE WORK
The paper presents enhancement of classification scheme using various bio-inspired approaches. In the thesis, three algorithms GA,PSO and BFO are implemented on dataset of a bank taken from UCI Machine Learning Repository. Using each algorithm, some performance parameters such as Cohesion, Variance, Precision, Recall are calculated. It can be concluded that Cohesion, Recall, Precision on dataset is more in Bacterial Foraging Optimization as compared to Genetic Algorithm and Particle Swarm optimization, while Variance is less in BFO. As seen in this work, BFO has been implemented successfully over GA,PSO
In the present work we have implemented the BFO based classification quite successfully using UCI Repository of Machine Learning Databases. If we can use more than two optimization algorithms together with large data sets for the classification, the results could have been better as compare to single optimization algorithm. So, future work could go on the direction of hybrid systems using more than one algorithm together.
REFERENCES
[1] Lyman, P., and Hal R. Varian, "How much storage is enough?"
Storage, 1:4 (2003).
[2] Way, Jay, and E. A. Smith,"Evolution of Synthetic Aperture Radar
Systems and Their Progression to the EOS SAR," IEEE Trans. Geoscience and Remote Sensing, 29:6 (1991), pp. 962-985.
[3] Usama, M. Fayyad, "Data-Mining and Knowledge Discovery:
Making Sense Out of Data," Microsoft Research IEEE Expert, 11:5. (1996), pp. 20-25.
[4] Berson, A., K. Thearling, and J. Stephen, Building Data Mining
Applications for CRM, USA, McGraw-Hill (1999).
[5] Berry, Michael J. A. et al., Data-Mining Techniques for Marketing,
Sales and Customer Support. U.S.A: John Wiley and Sons (1997).
[6] Weiss, Sholom M. et al., Predictive Data-Mining: A Practical Guide.
San Francisco, Morgan Kaufmann (1998).
[7] Giudici, P., Applied Data-Mining: Statistical Methods for Business
and Industry. West Sussex, England: John Wiley and Sons (2003).
[8] A.K. JAIN,M.N. MURTY AND P.J. FLYNN, “Data Clustering”,
ACM Computing Surveys, Vol.31, No. 3, September 1999.
[9] Enrico Minack, Gianluca Demartini, and Wolfgang Nejdl, “Current
Approaches to Search Result Diversitication”,L3S Research Center, Leibniz Universität Hannover, 30167 Hannover, Germany
[10] Basheer M. Al-Maqaleh and Hamid Shahbazkia, “A Genetic
Algorithm for Discovering Classification Rules in Data Mining” International Journal of Computer Applications (0975 – 8887), Volume 41– No.18, March 2012.
[11] Vivekanandan , P., Dr. R. Nedunchezhian, “A New Incremental Genetic Algorithm Based Classification Model to Mine Data with Concept Drift” Journal of Theoretical and Applied Information Technology.
[12] Andy Tsai, William M. Wells, Simon K. Warfield, and Alan S. Willsky, “An EM algorithm for shape classification based on level sets” Medical Image Analysis, Elsevier, pp. 491-502.
[13] Kamal Nigam, Andrew Kachites Mccallum, Sebastian Thrun, and Tom Mitchell, “Text Classification from Labeled and Unlabeled Documents using EM” Machine Learning, pp. 1-34.
[14]Bhanumathi, S., and Sakthivel., “A New Model for Privacy Preserving Multiparty Collaborative Data Mining”, 2013 International Conference on Circuits, Power and Computing Technologies [ICCPCT-2013].
[15] Ciubancan, Mihai., et al., “Data Mining preprocessing using GRID technologies”, 2013 11th Roedunet International Conference (RoEduNet), pp. 1-3.
[16]Velu, C.M., and Kashwan, K.R., “Visual Data Mining Techniques for Classification of Diabetic Patients”, 3rd International Advance Computing Conference (IACC), pp. 1070-1075, 2013 IEEE. [17] Ming-Hsien Hiesh; Lam, Y.-Y.A. ; Chia-Ping Shen ; and Wei Chen,
“Classification of schizophrenia using Genetic Algorithm-Support Vector Machine (GA-SVM)” 2013 35th Annual International Conference of the IEEE Engineering in Medicine and Biology Society (EMBC), pp. 6047 – 6050.
[18] Feng-Seng Lin ; Chia-Ping Shen ; Hsiao-Ya Sung ; and Yan-Yu Lam, “A High performance cloud computing platform for mRNA analysis” 2013 35th Annual International Conference of the IEEE Engineering in Medicine and Biology Society (EMBC), pp. 1510-1513.
[19] Saraswathi, S. ; Mahanand, B.S. ; Kloczkowski, A. ; and Suresh, S., “Detection of onset of Alzheimer's disease from MRI images using a GA-ELM-PSO classifier” 2013 IEEE Fourth International Workshop on Computational Intelligence in Medical Imaging (CIMI), pp. 42-48.
[20] Relan, D. ; MacGillivray, T. ; Ballerini, L. ; and Trucco, E., “Retinal vessel classification: Sorting arteries and veins” 2013 35th Annual International Conference of the IEEE Engineering in Medicine and Biology Society (EMBC), pp. 7396-7399.
[21] Samdin, S.B. ; Chee-Ming Ting ; Salleh, S.-H. ; and Ariff, A.K., “Linear dynamic models for classification of single-trial EEG” 2013 35th Annual International Conference of the IEEE Engineering in Medicine and Biology Society (EMBC), pp. 4827-4830.
[22] Vargas Cardona, H.D.; Orozco, A.A. ; and Alvarez, M.A.,
“Unsupervised learning applied in MER and ECG signals through Gaussians mixtures with the Expectation-Maximization algorithm and Variational Bayesian Inference” 2013 35th Annual International Conference of the IEEE Engineering in Medicine and Biology Society (EMBC), pp. 4326-4329.
[23] Keshavamurthy B. N, Asad Mohammed Khan & Durga Toshniwal, “Improved Genetic Algorithm Based Classification” International Journal of Computer Science and Informatics (IJCSI), Volume-1, Issue-3.
[24] Sharma Vipul , S S Pattnaik and Tanuj Garg (2012)”A Review of
Bacterial Foraging Optimization and Its Applications. IJCA