ISSN (Print) : 2320 – 3765 ISSN (Online): 2278 – 8875
I
nternational
J
ournal of
A
dvanced
R
esearch in
E
lectrical,
E
lectronics and
I
nstrumentation
E
ngineering
(An ISO 3297: 2007 Certified Organization)
Website: www.ijareeie.com
Vol. 6, Issue 7, July 2017
Result Analysis on Load Flow by Using
Newton Raphson Method
Deepinder Kaur Mander1, GS Virdi 2
PG Student [EE], Dept. of EE, Guru Gobind Singh College of Modern Technology, Kharar, Punjab, India1 Director, Guru Gobind Singh College of Modern Technology, Kharar, Punjab, India2
ABSTRACT:The load flow study in a power system constitutes a study of paramount importance. The study reveals the electrical performance and power flows (real and reactive) for specified condition when the system is operating under steady state. This paper gives an overview of different techniques used for load flow analysis results by using Newton Raphson Method.
KEYWORDS: Load Flow Studies, Newton-Raphson method, Fast Decoupled method, Fuzzy logic, Artificial Neural Network.
I. INTRODUCTION
Besides giving real and reactive power the load flow study provides information about line and transformer loading (as well as losses) throughout the system and voltages at different points in the system for evaluation and regulation of the performance of the power systems.
The state of a power system and the methods of calculating this state are very important in evaluating the operation and control of the power system and the determination of future expansion for this system. The state of any power system can be determined using load flow analysis that calculates the power flowing through the lines of the system. There are different methods to determine the load flow for a particular system such as: Gauss-Seidel, Newton Raphson Load, and the Fast-Decoupled method. Over the past few years, developments have been made in finding digital computer solutions for power-system load flows. This involves increasing the reliability and the speed of convergence of the numerical-solution techniques. In routine use, even few failures to give first-time convergence for physically feasible problems can be uneconomical. Hence, the Newton-Raphson (NR) approach is the most preferred general method. The characteristics and performance of transmission lines can vary over wide limits mainly dependent on their system. Hence, the NR method is used to maintain an acceptable voltage profile at various buses with varying power flow. The transmission system is loop in nature having low R/X ratio. Therefore, the variables for the load−flow analysis of
transmission systems are different from that of distribution systems which have high R/X ratio. Thus, unlike in distribution systems NR method is satisfactorily used for load flow studies in transmission systems [1].
The main purpose of the load-flow solution is to evaluate the individual phase voltages at all busbars/buses connected to the network corresponding to specified system conditions. As the active and reactive powers, voltage magnitudes, and angles are involved for each bus four independent constraints are required to solve for the above mentioned four unknowns parameters. There are two main types of buses, i.e., load and generator buses. A special type of generator bus is used as reference bus and is named as slack bus. For different types of buses the constraints are different [2], [3]. The Newton-Raphson approach is the most preferred load flow method because of its various advantages. It has powerful convergence characteristics compared to alternative processes and considerably low computing times are achieved when the sparse network equations are solved by the technique of sparsely-programmed ordered elimination [4].
ISSN (Print) : 2320 – 3765 ISSN (Online): 2278 – 8875
I
nternational
J
ournal of
A
dvanced
R
esearch in
E
lectrical,
E
lectronics and
I
nstrumentation
E
ngineering
(An ISO 3297: 2007 Certified Organization)
Website: www.ijareeie.com
Vol. 6, Issue 7, July 2017
problem. Load flow studies must forcibly ensure that electrical power transfer from generators to consumers through the grid system is stable, reliable and economic. Newton-Raphson or the Gauss-Seidel methods are the most conventional tools to solve load flow problems. Load flow analysis is forming an essential prerequisite for power system studies [5].
Over the past few decades, much research has been carried out for developing the computer programs for load flow analysis of large power systems. A number of solution techniques have been discovered to solve load flow problems. Depending on formulation, a procedure can be precise or approximate, having adjusted or unadjusted values, meant for either on-line or off-line application, and designed for either single-case or multiple-case applications. Efficient optimum economic operation and planning engineering is essential as an engineer is always concerned with minimizing the cost of products and services.
Power flow analysis plays a significant role in power network studies. It deals with the study of various power quantities like real power, reactive power, and magnitude of voltage and phase angle. Basically load flow analysis is carried out to ensure that generation fulfils load and loss requirements. Load flow study ensures nearness of bus voltage to rated value of voltage and the generator is operating within real and reactive power limits. With load flow analysis, overloading conditions of transmission and distribution line s are also violated. Load flow analysis is used in the planning stages of new networks, addition and removal of a new line to the existing substation. It provides us with the node voltage values and their respective phase angles, injected power at all the buses in a connected network hence defining the best location as well as optimum ability of the proposed design of generating station or substation. Conditions of over voltage or over load may occur at power system network and to deal with these problems power flow analysis is an important technique [6].
Load flow studies also known as load flow solution is an essential tool in power system studies and is extensively used in planning and operation of a power system network. Balanced operating conditions as well as single phase problems can be solved using this technique as it provides with voltage magnitude and phase angle at each bus, the active and reactive power flow voltage magnitude, voltage phase angle, real power injection and reactive power injections. The load flow analysis also include details about the steady state behaviour of the system active and reactive powers generated as and absorbed and also account for losses in the line. Load being a static quantity of power system and it is the power that flows across the transmission lines, the tripper prefer to call this Power Flow studies rather than the load flow studies. Moreover over or under load conditions can also be determined from lone flow. Non linear algebraic equations are used to represent steady state active and reactive powers in a power system. All these functions of planning, operation, conserving data and economically dispatching it are performed using load flow analysis and for this analysis conventional iterative methods are used which include Newton-Raphson or the Gauss-Seidel methods [7]. Load flow study mostly make use of simplified notation such as per unit system and one line diagram, and focuses on various form of AC power (i.e.: reactive, real and apparent) rather than voltage and current. The advantage of LFS lies in planning for future advancements in power systems as well as in determining the best operation of already designed systems. LFS is being used for solving Load flow problem by Newton Raphson method and Fast decoupled load flow method [8].
II. METHODS OF LOAD FLOW ANALYSIS
ISSN (Print) : 2320 – 3765 ISSN (Online): 2278 – 8875
I
nternational
J
ournal of
A
dvanced
R
esearch in
E
lectrical,
E
lectronics and
I
nstrumentation
E
ngineering
(An ISO 3297: 2007 Certified Organization)
Website: www.ijareeie.com
Vol. 6, Issue 7, July 2017
III. REVIEW OF NUMERICAL LOAD FLOW TECHNIQUES
Various numerical methods developed for load flow analysis from time to time are listed as below:
3.1. Solution of Linear equations:
Direct methods:
- Cramer’s (Determinant) Method,
- Gauss Elimination Method (only for smaller systems), - Linear Factorization (more preferred method), etc.
Iterative methods:
- Gauss Method
- Gauss-Siedel Method (for diagonally dominant systems)
3.2. Solution of Nonlinear equations:
Iterative methods only:
- Gauss-Siedel Method (for smaller systems
- Newton-Raphson Method (if corrections for variables are small)
3.3. Solution of differential equations:
Iterative methods only:
- Euler and Modified Euler method, - RX IV-order method,
- Milne’s predictor-corrector method, etc.
IV. PROPERTIES OF LOAD FLOW SOLUTION METHOD
To be a good method for load flow analysis, it must acquire following properties:
a. High computational speed. To deal with large power system networks, real time applications or multiple case data, high
computational speed is required for efficient results.
b. Low computer storage. A large computer memory is required to store load flow data for large power system networks
and this can be achieved by using mini-computers mainly for on-line applications.
c. Reliability of solution. It isvery essential that the results obtained after carrying out load flow calculations must be reliable
and should provide efficient data.
d. Versatility. Versatility of the solution means the ability of the load flow method to handle conventional and special
features. E.g. the adjustment of tap ratios on transformers. The load flow solution obtained must be versatile one.
e. Simplicity. While carrying out load flow calculations, the load flow method should provide ease of coding a computer
program for the load flow algorithm so that calculations can be done conveniently.
V. COMPUTATIONAL ALGORITHMS FOR NEWTON RAPHSON LOAD FLOW METHOD
5.1 ALGORITHMS
To perform load flow analysis using Newton Raphson method, the algorithm developed is as follows: Step 1: Form the nodal admittance matrix (Yij).
Step 2: Assume an initial set of bus voltage and set bus n as the reference bus as: Vi= Vi, spec.∠00 (at all PV buses)
Vi= 1∠0 0
(at all PQ buses)
Step 3: Calculate the real Power Piusing the load flow equation;
2
1
cos
sin
n
i ii i i j ij ij ij ij
j
P
G V
V V
G
B
Step 4: Calculate the reactive PowerQiusing the load flow equation;
2
1
sin
cos
n
i ii i i j ij ij ij ij
j
Q
B V
V V
G
B
ISSN (Print) : 2320 – 3765 ISSN (Online): 2278 – 8875
I
nternational
J
ournal of
A
dvanced
R
esearch in
E
lectrical,
E
lectronics and
I
nstrumentation
E
ngineering
(An ISO 3297: 2007 Certified Organization)
Website: www.ijareeie.com
Vol. 6, Issue 7, July 2017
∆ = , .− , .
∆ = , .− , .
Step 7: Choose the tolerance values.
Step 8: Stop the iteration if all ΔPiand ΔQi are within the tolerance values.
Step 9: Update the values of Vi and δi using the equation x k+1
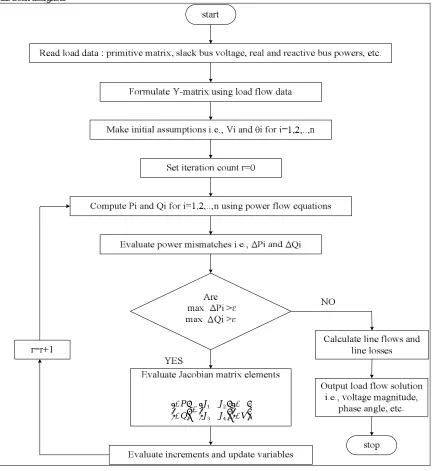
=xk+ Δxk. 5.2 Detailed flow chart for Newton Raphson load flow method:
In context to various steps involved in carrying out load flow studies with Newton Raphson method, following detailed flow chart has been designed:
1 2
3 4
J J
P
J J
Q V
ISSN (Print) : 2320 – 3765 ISSN (Online): 2278 – 8875
I
nternational
J
ournal of
A
dvanced
R
esearch in
E
lectrical,
E
lectronics and
I
nstrumentation
E
ngineering
(An ISO 3297: 2007 Certified Organization)
Website: www.ijareeie.com
Vol. 6, Issue 7, July 2017
VI. RESULTS
6.1Test bus systems
Test network systems are widely used in power system research and education. The importance of using the standard test network should be completely understood. The use of test systems is very vital because in practical power systems, data are partially confidential, also the dynamic and static data of the system are not well documented, moreover, calculations of numerous scenarios are difficult due to large set of data and the lack of software capabilities for handling large set of data.
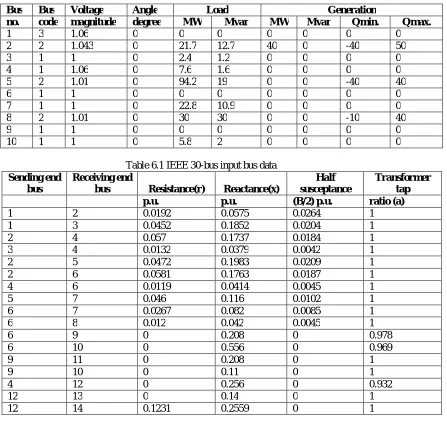
6.1 .1 Case Study1: IEEE 30-Bus System
In present research work, two cases have been studied and analyzed using MATPOWER software[9]. To compute the results NR and FDLF load flow methods have been used. First case study includes power flow analysis of IEEE 30- bus distribution system. The input data required for carrying out power flow analysis and various results obtained are shown in tables. Results include bus data, branch loss data, and optimal power flow results.
Bus Bus Voltage Angle Load Generation
no. code magnitude degree MW Mvar MW Mvar Qmin. Qmax.
1 3 1.06 0 0 0 0 0 0 0 2 2 1.043 0 21.7 12.7 40 0 -40 50 3 1 1 0 2.4 1.2 0 0 0 0 4 1 1.06 0 7.6 1.6 0 0 0 0 5 2 1.01 0 94.2 19 0 0 -40 40 6 1 1 0 0 0 0 0 0 0 7 1 1 0 22.8 10.9 0 0 0 0 8 2 1.01 0 30 30 0 0 -10 40 9 1 1 0 0 0 0 0 0 0 10 1 1 0 5.8 2 0 0 0 0
Table 6.1 IEEE 30-bus input bus data
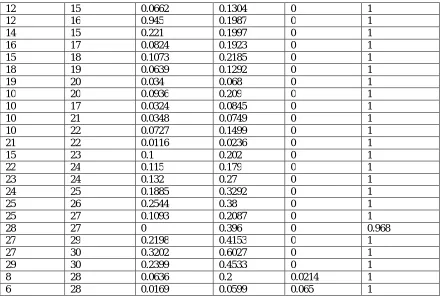
Sending end bus
Receiving end
bus Resistance(r) Reactance(x)
Half susceptance
Transformer tap
p.u. p.u. (B/2) p.u. ratio (a)
1 2 0.0192 0.0575 0.0264 1 1 3 0.0452 0.1852 0.0204 1 2 4 0.057 0.1737 0.0184 1 3 4 0.0132 0.0379 0.0042 1 2 5 0.0472 0.1983 0.0209 1 2 6 0.0581 0.1763 0.0187 1 4 6 0.0119 0.0414 0.0045 1 5 7 0.046 0.116 0.0102 1 6 7 0.0267 0.082 0.0085 1 6 8 0.012 0.042 0.0045 1
6 9 0 0.208 0 0.978
6 10 0 0.556 0 0.969
9 11 0 0.208 0 1
9 10 0 0.11 0 1
4 12 0 0.256 0 0.932
12 13 0 0.14 0 1
ISSN (Print) : 2320 – 3765 ISSN (Online): 2278 – 8875
I
nternational
J
ournal of
A
dvanced
R
esearch in
E
lectrical,
E
lectronics and
I
nstrumentation
E
ngineering
(An ISO 3297: 2007 Certified Organization)
Website: www.ijareeie.com
Vol. 6, Issue 7, July 2017
12 15 0.0662 0.1304 0 1 12 16 0.945 0.1987 0 1 14 15 0.221 0.1997 0 1 16 17 0.0824 0.1923 0 1 15 18 0.1073 0.2185 0 1 18 19 0.0639 0.1292 0 1 19 20 0.034 0.068 0 1 10 20 0.0936 0.209 0 1 10 17 0.0324 0.0845 0 1 10 21 0.0348 0.0749 0 1 10 22 0.0727 0.1499 0 1 21 22 0.0116 0.0236 0 1
15 23 0.1 0.202 0 1
22 24 0.115 0.179 0 1 23 24 0.132 0.27 0 1 24 25 0.1885 0.3292 0 1 25 26 0.2544 0.38 0 1 25 27 0.1093 0.2087 0 1 28 27 0 0.396 0 0.968 27 29 0.2198 0.4153 0 1 27 30 0.3202 0.6027 0 1 29 30 0.2399 0.4533 0 1 8 28 0.0636 0.2 0.0214 1 6 28 0.0169 0.0599 0.065 1
Table 6.2 IEEE 30-Bus input branch data
Bus Voltage Generation Load
Mag(p.u) Ang(deg) P (MW) Q (MVAr) P (MW) Q (MVAr)
1 1 0.000 25.97 -1 - -
2 1 -0.415 60.97 32 21.7 12.7 3 0.983 -1.522 - - 2.4 1.2 4 0.98 -1.795 - - 7.6 1.6 5 0.982 -1.864 - - - -
6 0.973 -2.267 - - - -
7 0.967 -2.652 - - 22.8 10.9 8 0.961 -2.726 - - 30 30 9 0.981 -2.997 - - - -
10 0.984 -3.375 - - 5.8 2 11 0.981 -2.997 - - - -
12 0.985 -1.537 - - 11.2 7.5 13 1 1.476 37 11.35 - -
ISSN (Print) : 2320 – 3765 ISSN (Online): 2278 – 8875
I
nternational
J
ournal of
A
dvanced
R
esearch in
E
lectrical,
E
lectronics and
I
nstrumentation
E
ngineering
(An ISO 3297: 2007 Certified Organization)
Website: www.ijareeie.com
Vol. 6, Issue 7, July 2017
16 0.977 -2.644 - - 3.5 1.8 17 0.977 -3.392 - - 9 5.8 18 0.968 -3.478 - - 3.2 0.9 19 0.965 -3.958 - - 9.5 3.4 20 0.969 -3.871 - - 2.2 0.7 21 0.993 -3.488 - - 17.5 11.2 22 1 -3.393 21.59 39.57 - -
23 1 -1.589 19.2 7.95 3.2 1.6 24 0.989 -2.631 - - 8.7 6.7 25 0.99 -1.69 - - - -
26 0.972 -2.139 - - 3.5 2.3 27 1 -0.828 26.91 10.54 - -
28 0.975 -2.266 - - - -
29 0.98 -2.128 - - 2.4 0.9 30 0.968 -3.042 - - 10.6 1.9 Total: 191.64 100.41 189.2 107.2
Table 6.3: Load flow analysis for IEEE 30-bus system using N-R load flow method
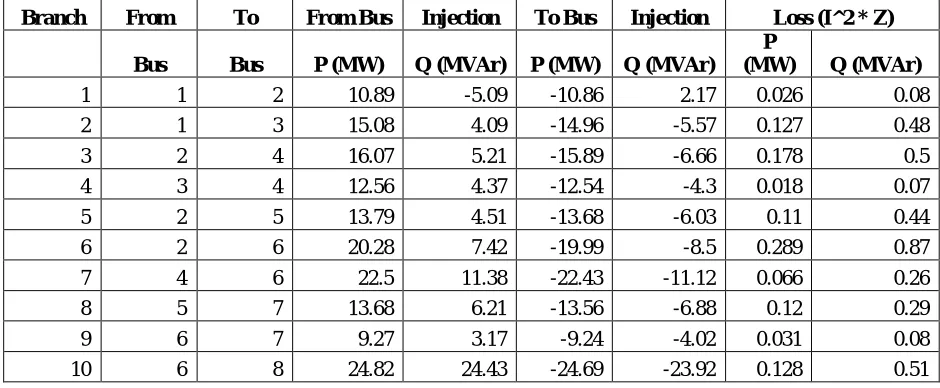
Branch From To From Bus Injection To Bus Injection Loss (I^2 * Z)
Bus Bus P (MW) Q (MVAr) P (MW) Q (MVAr)
P
(MW) Q (MVAr)
1 1 2 10.89 -5.09 -10.86 2.17 0.026 0.08 2 1 3 15.08 4.09 -14.96 -5.57 0.127 0.48 3 2 4 16.07 5.21 -15.89 -6.66 0.178 0.5 4 3 4 12.56 4.37 -12.54 -4.3 0.018 0.07 5 2 5 13.79 4.51 -13.68 -6.03 0.11 0.44 6 2 6 20.28 7.42 -19.99 -8.5 0.289 0.87 7 4 6 22.5 11.38 -22.43 -11.12 0.066 0.26 8 5 7 13.68 6.21 -13.56 -6.88 0.12 0.29 9 6 7 9.27 3.17 -9.24 -4.02 0.031 0.08 10 6 8 24.82 24.43 -24.69 -23.92 0.128 0.51
Table 6.4: Load flow losses for IEEE 30 bus system using NR method
6.1.2 Case Study 2: IEEE 57 bus system
ISSN (Print) : 2320 – 3765 ISSN (Online): 2278 – 8875
I
nternational
J
ournal of
A
dvanced
R
esearch in
E
lectrical,
E
lectronics and
I
nstrumentation
E
ngineering
(An ISO 3297: 2007 Certified Organization)
Website: www.ijareeie.com
Vol. 6, Issue 7, July 2017
Table 6.5: IEEE 57-Bus input bus data
Bus Type Pd Qd Gs Bs Area Vm Va Base Kv Zone Vmax. Vmin.
1 3 55 17 0 0 1 1.04 0 0 1 1.06 0.94 2 2 3 88 0 0 1 1.01 -1.18 0 1 1.06 0.94 3 2 41 21 0 0 1 0.985 -5.97 0 1 1.06 0.94 4 1 0 0 0 0 1 0.981 -7.32 0 1 1.06 0.94 5 1 13 4 0 0 1 0.976 -8.52 0 1 1.06 0.94 6 2 75 2 0 0 1 0.98 -8.65 0 1 1.06 0.94 7 1 0 0 0 0 1 0.984 -7.58 0 1 1.06 0.94 8 2 150 22 0 0 1 1.005 -4.45 0 1 1.06 0.94 9 2 121 26 0 0 1 0.98 -9.56 0 1 1.06 0.94 10 1 5 2 0 0 1 0.986 -11.4 0 1 1.06 0.94
Table 6.6: IEEE 57-Bus input branch data
F bus
T
bus r X B
Rate A
Rate B
Rate
C Ratio Angle Status
Ang. Min.
Ang. Max.
1 2 0.0083 0.028
0 .129 0 0 0 0 0 1 -360 360
2 3 0.0298 0.085
0 .0818 0 0 0 0 0 1 -360 360 3 4 0.0112 0.0366 0.038 0 0 0 0 0 1 -360 360 4 5 0.0625 0.132 .0258 0 0 0 0 0 1 -360 360 4 6 0.043 0.148 0348 0 0 0 0 0 1 -360 360 6 7 0.02 0.102 276 0 0 0 0 0 1 -360 360 6 8 0.0339 0.173 .047 0 0 0 0 0 1 -360 360 8 9 0.0099 1.0505 0.0548 0 0 0 0 0 1 -360 360 9 10 0.0369 0.1679 0.044 0 0 0 0 0 1 -360 360 9 11 0.0258 0.0848 0.0218 0 0 0 0 0 1 -360 360 9 12 0.0648 0.295 0.0772 0 0 0 0 0 1 -360 360 9 13 0.0481 0.158 0.0406 0 0 0 0 0 1 -360 360
Table 6.7: Load flow results for IEEE 57-bus system using N-R method
Bus Voltage Generation Load
Mag(p.u) Ang(deg) P (MW) Q (MVAr) P (MW) Q (MVAr)
1 1.04 0.000 478.66 128.85 55 17 2 1.01 -1.188 0 -0.75 3 88 3 0.985 -5.988 40 -0.9 41 21 4 0.981 -7.337 - - - - 5 0.976 -8.546 - - 13 4 6 0.98 -8.674 0 0.87 75 2 7 0.984 -7.601 - - - - 8 1.005 -4.478 450 62.1 150 22 9 0.98 -9.585 0 2.29 121 26 10 0.986 -11.45 - - 5 2
ISSN (Print) : 2320 – 3765 ISSN (Online): 2278 – 8875
I
nternational
J
ournal of
A
dvanced
R
esearch in
E
lectrical,
E
lectronics and
I
nstrumentation
E
ngineering
(An ISO 3297: 2007 Certified Organization)
Website: www.ijareeie.com
Vol. 6, Issue 7, July 2017
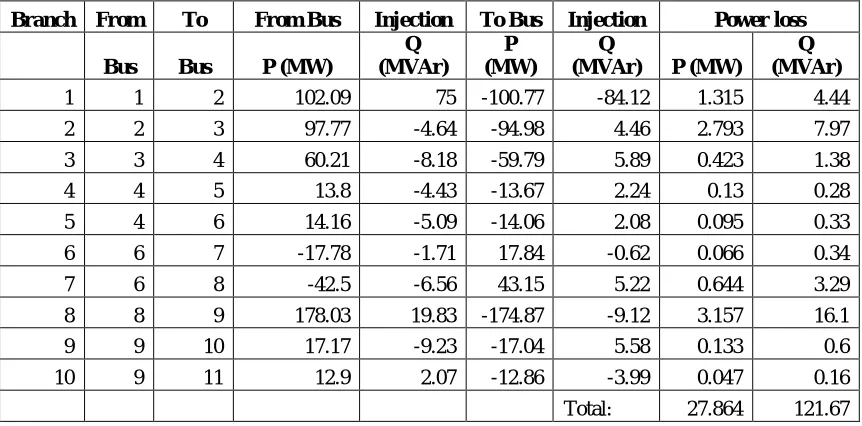
Table 6.8: Load flow losses for IEEE 57 bus system using N-R method
Branch From To From Bus Injection To Bus Injection Power loss
Bus Bus P (MW)
Q (MVAr)
P (MW)
Q
(MVAr) P (MW)
Q (MVAr)
1 1 2 102.09 75 -100.77 -84.12 1.315 4.44 2 2 3 97.77 -4.64 -94.98 4.46 2.793 7.97 3 3 4 60.21 -8.18 -59.79 5.89 0.423 1.38 4 4 5 13.8 -4.43 -13.67 2.24 0.13 0.28 5 4 6 14.16 -5.09 -14.06 2.08 0.095 0.33 6 6 7 -17.78 -1.71 17.84 -0.62 0.066 0.34 7 6 8 -42.5 -6.56 43.15 5.22 0.644 3.29 8 8 9 178.03 19.83 -174.87 -9.12 3.157 16.1 9 9 10 17.17 -9.23 -17.04 5.58 0.133 0.6 10 9 11 12.9 2.07 -12.86 -3.99 0.047 0.16 Total: 27.864 121.67
Table 6.9: Optimal power flow results for IEEE 57 bus system using NR method
Bus Voltage Generation Load
Lambda($/MVA-hr)
Mag(p.u) Ang(deg) P (MW)
Q (Mvar)
P (MW)
Q
(Mvar) P Q
1 1.009 0.000 142.63 44.6 55 17 42.13 - 2 1.008 0.821 87.81 50 3 88 41.756 0.158 3 1.003 -1.169 45.07 28.77 41 21 42.536 - 4 1.006 -1.066 - - - - 42.499 0.011 5 1.016 -0.035 - - 13 4 42.007 0.046 6 1.026 0.881 72.89 7.77 75 2 41.458 - 7 1.024 1.666 - - - - 41.233 0.17 8 1.044 4.724 459.82 87.17 150 22 40.437 - 9 1.004 -0.091 97.55 9 121 26 41.954 0.247 10 0.984 -3.579 - - 5 2 43.207 0.238 11 0.984 -2.244 - - - - 43.011 0.394 12 0.992 -3.488 361.54 43.26 377 24 43.325 -
Total: 1267.31 270.56 1250.8 336.4
VII. CONCLUSION
ISSN (Print) : 2320 – 3765 ISSN (Online): 2278 – 8875
I
nternational
J
ournal of
A
dvanced
R
esearch in
E
lectrical,
E
lectronics and
I
nstrumentation
E
ngineering
(An ISO 3297: 2007 Certified Organization)
Website: www.ijareeie.com
Vol. 6, Issue 7, July 2017
solution, the most popular methods are the Gauss-Seidel method, the Newton-Raphson method and the Fast Decoupled Load Flow method. These methods have been discussed in detail. GS method of load flow solution seems to be useful in smaller systems but as the size of system increases, the computation time increases .Hence, in large systems NR and FDLF methods are more popular. There is a comparison between various requirements like speed, storage, reliability, computation time, convergence characteristics etc. No single method has all the desirable features. So both the methods have been used to obtain power flow solutions and are tested on IEEE 30-bus and IEEE 57- bus distribution system.[10] The power flow results obtained were analyzed and discussed. Both the decoupled load flow and Newton-Raphson methods gave almost similar results. However, the convergence speed of decoupled method is faster than the Newton-Raphson method. The bus voltage magnitudes, angles of each bus along with power generated and consumed at each bus has been tabulated for IEEE 30- bus and IEEE 57-bus systems. It is seen from the tables that the total power generated in case of IEEE 30 –bus system is 191 MW whereas the total power consumed is 189 MW. This indicates that there is a line loss of about 2 MW for all the lines put together and the optimal power flow results show that the cost ranges from 3.662$/MVA-hr to 4.051$/MVA-hr. For IEEE 57-bus system, , the total power generated were 1278MW whereas the power demand were 1250MW thus a loss of 28 MW and the optimal cost ranges from 42.13$/MVA-hr to 46.83$/MVA-hr.
REFERENCES
[1] Ambriz-Perez. H, “Advanced SVC models for Newton-Raphson load flow and Newton optimal power flow studies,” IEEE Transactions on Power Apparatus and systems, vol. 15, pp. 129-136, 2002.
[2] Adriana SQ Ferreira, Carlos A., Castro, Daniel P., Bernardon, and Garcia J. Vinícius. "Power flow solution with controls and limits
represented by nonlinear programming techniques",In Universities Power Engineering Conference (UPEC), 2009 Proceedings of the 44th
International, IEEE pp. 1-5. 2009.
[3] Aswani R and Sakthivel R, “Power Flow Analysis of 110/11KV Substation Using ETAP”, International Journal of Applied Research and Studies (IJARS), Vol. 3, 2014.
[4] Balamurugan K. and Srinivasan Dipti,“Review of Power Flow Studies on Distribution Network with Distributed Generation,” IEEE PEDS, pp. 411-417, 2011.
[5] Chen P., Chen Z. and Bak-Jensen B., “Probabilistic load flow: A review”, In Electric Utility Deregulation and Restructuring and Power
Technologies, Third International Conference, IEEE,pp. 1586-1591, 2008.
[6] Wang Zian and Fernando L. Alvarado, “Interval arithmetic in power flow analysis”, IEEE transactions on power system, Vol. 7, no. 3, pp. 1341-1349, 1992.
[7] Shareef Hussain, Mohd. Wazir Mustafa, Saifulnizam Abd Khalid, Azhar Khairuddin, Akhtar Kalam, and Amanullah Maung Than Oo, “Real and Reactive Power Transfer Allocation Utilizing Modified Nodal Equations”, International Journal of Emerging Electric Power Systems, vol 9, 2008.
[8] Thomas J. Overbye, Member, IEEE, “A Power Flow Measure for Unsolvable Cases”, IEEE Transactions on Power Systems, vol. 9, pp.1359-1365, 1994.
[9] Syai’in Mat and Soeprijanto Adi, “Improved Algorithm of Newton Raphson Power Flow using GCC limit based on Neural Network,” International Journal of Electrical & Computer Sciences IJECS-IJENS, vol. 12, pp.7-12, 2012.