12 29
Jayesh et. al.,
International Journal of Research
Am. J. PharmTech Res. 2014; 4(2) ISSN: 2249-3387Available at https://edupediapublications.org/journals
e-ISSN: 2348-6848 p-ISSN: 2348-795X Volume 03 Issue 1
January 2016
Available online: https://edupediapublications.org/journals/index.php/IJR/ P a g e | 1229
ABSTRACT
In the present study nifedipine transdermal patch were prepared and developed by using D-optimal combination design with poly vinyl pyrrolidone (PVP) and ethyl cellulose (EC) as rate controlling polymer . The formulated transdermal patches were evaluated for various parameters like drug excipients compatibility study, physicochemical evaluation studies, mechanical charecteristcs, In vitro drug release and permeation tests. The result of evaluation parameters demonstrated a successful optimization of transdermal patch.
Keywords: Transdermal, D-Optimal, Permeation
INTRODUCTION
Transdermal drug delivery system (TDDS) has been associate degree increased interest within
the drug administration via the skin for local action and systemic effects1.
For transdermal merchandise the goal of dosage style is to maximise the flux through the skin into
the systemic circulation and simultaneouslyminimize the retention and metabolism of the drug within
the skin2. transdermal delivery of drug has gained a lot of interest in recent years due
to its benefits overoralroute including passes internalorgan initial passmetabolism, therefore achievin
ghigh systemic bioavailability ofdrugs, that bear either considerable or intensive first pass
metabolism and capable of sustaining the drug unleash for prolonged period of your time. Moreover,
it provides suitability for self administration and speedy termination of drug effect if needed, leading
to higher patient acceptance and compliance3, 4.
Nifedipine is calcium channel blocker, used in vasoplastic angina, chronic stable angina, hypertension, congestive heart failure and acute myocardial infarction. The drug is reported good absorption from gastrointestinal tract but its bioavailability is low (45-56 %) due to first pass metabolism and frequent dosing is required due to short biological half life5. Nifedipine transdermal patch may be beneficial to the patient since it reduce adverse effects and avoid the hepatic first-pass metabolism. The need for transdermal patch of nifedipine is further justified due to the requirement of maintaining unfluctuating plasma concentrations for effective
D- Optimal combination Designing and
Statistical development of Nifedipine Transdermal Patch
JAYESH V.N., SHAMNAS M., RAHUL SHUKLA
The purpose of present study was to develop transdermal patch of nifedipine to improve bioavailability and patient compliance by using PVP and EC polymer matrix.
MATERIALS AND METHOD
Materials
Ethyl cellulose, SD fine chemicals (Mumbai, India), Polyvinyl pyrrolidone, Loba chemicals (Mumbai, India), Glycerine, SD fine chemicals (Mumbai, India), Ethanol, Titan Biotech limited (Rajasthan, India), Potassium dihydrogen orthophosphate, SD fine chemicals (Mumbai, India) and Sodium hydroxide pellets, E Merck India Ltd. ( Mumbai, India) were purchased from local supplier and used as such without any purification. Nifedipine was kindly gifted by Alkem (Baddi, India).
Preparation of transdermal patches
12 31
Jayesh et. al.,
International Journal of Research
Res. 2014; 4(2) ISSN: 2249-3387Available at https://edupediapublications.org/journals
e-ISSN: 2348-6848 p-ISSN: 2348-795X Volume 03 Issue 1
January 2016
Available online: https://edupediapublications.org/journals/index.php/IJR/ P a g e | 1231
hour. Nifedipine and glycerine (20 % W/W of polymer blend) were then added to the polymers solution. This solution was allowed to stir until we get clear solution and stand overnight to remove all the entrapped air bubbles. The solutions were then casted onto a aluminium cups and dried in the room temperature and covered each aluminium cups with an inverted funnel for controlled evaporation of solvent4.
Optimization of Variables Using D-optimal mixture design
A D optimal mixture design (DESIGN EXPERT 8.0.1 demo version software) was used for the optimization of matrix type transdermal patch of nifedipine. In a mixture design, the independent factors are the components of a mixture and the response depends on the relative proportions of each factor (B.Rama & A.Shantha, 2012). It involves changing mixture composition and exploring how such changes will affect the properties of the mixture. In present study poly vinyl pyrrolidone (A) & ethyl cellulose (B) content were selected as the independent variables whereas amount of drug release (Q12), cumulative amount of drug permeated at 24h (P24), permeation flux (J). In a mixture design, the level of single mixture component cannot be changed independently & the sum of the mixture components has to be constant. The study design including independent factor, constrains of design & observed responses shown in Table 1. Drug-excipients compatibility study
The nifedipine and mixture of nifedipine with excipients was thoroughly blended with IR grade KBR in the ratio 1:100. The blend was then made into thin pellets on a sample plate using a hand operated compression lever. The samples were then analyzed in a Perkin Elmer Model 1330 double beam IR spectrometer using KBr film as negative control (blank).
PHYSICOCHEMICAL EVALUATION OF PATCHES
Folding endurance
The folding endurance was measured manually as the reported method(7). Briefly, a strip of the film was cut evenly and repeatedly folded at the same place till it broke. The number of times the film could be folded at the same place without breaking/cracking gave the value of folding endurance.
Thickness
Uniformity of dosage unit of patches was determined by assay of 20 units individually using UV spectrophotometric method and calculate acceptance value by using soft catalyst software (Aura pharmaceuticals, India). The acceptance value (AV) of the preparation is less than 15%, according to the JP15. In USP30, the contents should be within a range between 85% and 115%, and the relative standard deviation should be less than or equal to 6.0%(8).
Flatness
Longitudinal strips of prepared patches were cut and length of each strip was measured. Constriction(%) was calculated using following formula
l1 − l2
Constriction% = X 100 l2
Where: l1 was initial length of each strip and l2 was final length.
The value 100 – constriction(%) was considered as flatness of patch. Moisture content
The prepared patches were weighed individually and kept in a desiccator containing fused calcium chloride at 40 0C in an oven for 24 h. The patches were reweighed after 24 hr. The
moisture content of patches were calculated using following formula(7) W1 − W2
Moisture content % = X 100 W2
Where: W1 was initial weight of patch and W2 was final weight.
Moisture uptake
The dried patches, keeping over activated silica in a desiccator and then got out from desiccator and placed in a desiccator containing saturated solution of potassium chloride (84 % relative humidity) at300C until two successive weights found constant. Moisture uptake of patches were
calculated using follow formula(7)
�������� ������ % = �2 − �1 �1 � 100
Where: W1 was initial weight of patch and W2 was final weight.
Mechanical properties
12 33
Jayesh et. al., Res. 2014; 4(2) ISSN: 2249-3387
International Journal of Research
Available at https://edupediapublications.org/journals
e-ISSN: 2348-6848 p-ISSN: 2348-795X Volume 03 Issue 1
January 2016
Available online: https://edupediapublications.org/journals/index.php/IJR/ P a g e | 1233
In vitro drug release study
The In vitro drug release study of patches was studied using a USP 23 type 2 paddle method (Electrolab, EDT-08Lx). The patches were fixed on the glass disk with the help of a cyanoacrylate adhesive. The disk was put at the bottom of the dissolution vessel so that drug matrix exposed to dissolution medium, phosphate buffer (pH 7.4). Samples were withdrawn at predetermined interval and replaced with fresh medium. The samples were filtered through 0.45 μm filter and appropriately diluted with phosphate buffer (pH 7.4) and assayed spectrophotometrically at 238 nm.
Drug release kinetic study
To determine the mechanism of drug release, curve fitting method was used. The goodness of fit was performed using following kinetic models 11-13
Zero order Model:�� = �0 + �0� , where Qt is the amount of drug dissolved in time t, Q0 is the
initial amount of drug in the solution and K0 is the zero order release constant.
First order Model: �� �∞ − �� = ���0 + ��, where Qt is the amount of drug dissolved in time
t, Q0 is the initial amount of drug in the solution, Q∞ is the amount release in time ∞ (100 % drug
release) and K is the first order release constant.
Higuchi Model: Qt=Q0 + KHt1/2, where Qt is the amount of drug dissolved in time t, Q0 is the
initial amount of drug in the solution and KH is the Higuchi dissolution rate constant.
Korsmeyer–Peppas Model (power law):�� = �
�∞ , or ����� = log �� + ���� � where Qt is
the amount of drug dissolved in time t, Q∞ is the amount release in time ∞, kk is the rate constant
and n is the diffusional exponent, this indicates the drug release mechanism.
In vitro skin permeation study
The skin permeation study were performed in a modified K-C diffusion cell (cell capacity of 50 ml, cross sectional area was 3.14 cm2). The drug permeation study was performed using pig skin
obtained from local slaughter house 14,15. The skin was store at 4 to 50C in saline solution until
usage. The dermatome skin (thickness 140 μm) was washed with soap solution, followed by washing with distilled water.
The isolated pig skin was mounted between the donor and receptor compartment of the diffusion cell. The dermal side of skin was facing receptor compartment and patch was affixed on the skin
12 35
Jayesh et. al., Res. 2014; 4(2) ISSN: 2249-3387
International Journal of Research
Available at https://edupediapublications.org/journals
e-ISSN: 2348-6848 p-ISSN: 2348-795X Volume 03 Issue 1
January 2016
Available online: https://edupediapublications.org/journals/index.php/IJR/ P a g e | 1235
so that drug matrix was toward skin.
whole assembly was kept on a magnetic stirrer and solution in the receiver compartment was constantly and continuously stirred during the whole experiment using magnetic bead. The samples were withdrawn (2 ml, each time) at different time interval and phosphate buffer pH 7.4 was replaced each time. Absorbance of the sample was read spectrophotometrically at 238 nm taking phosphate buffer pH 7.4 solution, as a blank. The amount of drug permeated per square centimetre at each time interval was calculated and plotted against time.
RESULTS AND DISCUSSION
In the present study, transdermal patches of nifedipine were prepared with different polymer combinations of EC and PVP with solvent casting method. A total of 9 formulations were prepared in triplicate using a D optimal mixture design.
A FT-IR spectrum (40 scan and resolution of 1 cm-1) of drug was compared with physical mixture (drug with excipients) spectrum. FTIR spectra of drug showed characteristics peaks of the N‐H stretching vibration at 3431 cm-1and a band with main peak at 1679 cm−1 indicative of
12 37
Jayesh et. al.,
International Journal of Research
Res. 2014; 4(2) ISSN: 2249-3387Available at https://edupediapublications.org/journals
e-ISSN: 2348-6848 p-ISSN: 2348-795X Volume 03 Issue 1
January 2016
Table 1 D-optimal mixture design layout
Formulation Mixture Factor P24 J (µg/cm2.hr) Q12 (%) A( PVP %) B( EC%) (µg/cm2)
F1 0.00 100.00 1599.62 68.26 24.912
F2 50.00 50.00 1712.95 73.73 60.869
F3 25.00 75.00 1636.2 70.13 47.98
F4 100.00 0.00 1862.5 78.44 78.16
F5 75.00 25.00 1794.2 76.59 63.234
Constraints 0 % ≤ A ≤ 100 % 0 % ≤ B ≤ 100 % X1 + X2 = 100 %
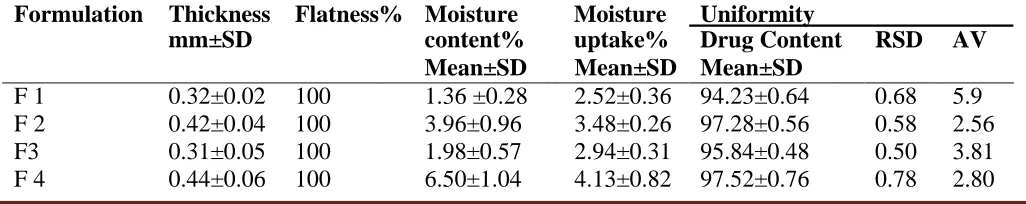
The physiochemical evaluation data of patches was presented in table 2. The prepared patches were flexible, flat, uniform in thickness, mass and drug content. Folding endurance result showed no visible cracks. The thickness of the transdermal patches ranged between 0.31±0.05 mm to 0.44±0.06 mm. The transdermal patches showed good drug content which varied between 94.23±0.64 and 97.52±0.76 %, with acceptance value (AV) ranged from 2.56-5.9, within the limit (For L1, AV≤15) as per JP 15. Moreover relative standard deviation (RSD) varied from 0.50-0.78. Thus the transdermal patches complies the USP 32 content uniformity specification. The flatness study showed no constriction in the transdermal patches.
The moisture content and moisture uptake (%) behaviour of transdermal patches is illustrated in figure 2 and table 2. Moisture content and moisture uptake of transdermal patches were found to be low and as the ratio of hydrophilic polymer (HPMC) increases, both parameter (moisture content & moisture uptake) increases. Low moisture content ranged from 1.36 ±0.28 – 6.50 ± 1.04 % helpful to maintain stability and prevent from being dried and brittle patch. The low moisture uptake (2.52±0.36 - 4.13±0.82 %) prevents the patches from microbial growth and bulkiness.
Table 2: Physicochemical evaluation of patches
Formulation Thickness Flatness% Moisture Moisture Uniformity
mm±SD content% uptake% Drug Content RSD AV Mean±SD Mean±SD Mean±SD
F 1 0.32±0.02 100 1.36 ±0.28 2.52±0.36 94.23±0.64 0.68 5.9
F 2 0.42±0.04 100 3.96±0.96 3.48±0.26 97.28±0.56 0.58 2.56
F3 0.31±0.05 100 1.98±0.57 2.94±0.31 95.84±0.48 0.50 3.81
12 39
Jayesh et. al., Res. 2014; 4(2) ISSN: 2249-3387
International Journal of Research
Available at https://edupediapublications.org/journals
e-ISSN: 2348-6848 p-ISSN: 2348-795X Volume 03 Issue 1
January 2016
Available online: https://edupediapublications.org/journals/index.php/IJR/ P a g e | 1239
F 5 0.39±0.08 100 4.03±0.82 3.95±0.92 96.84±0.48 0.50 5.62
8
Moisture content(%)
Moisture uptake (%)
6
4
2
0
Figure.2 Moisture content (%) and uptake of various formulations
The result of mechanical property study is presented in table 3.Result showed as PVP content increases TS and strain increases, EB decreases but unpredictable pattern showed by EM.
Table 3 Mechanical properties of film
100 80 60 40 20 0 F1 F2 F3 F4 F5
0 5 10 15
Time (hr)
Figure 3 In vitro drug release profile of various formulations
In vitro release of nifedipine from various formulations is shown in Figure. 3. All the tested
C u m u la ti v e drug r e le a s e
Formulation Tensile
Strength(kg/cm2)
Elastic
modulus(kg/cm2)
Elongation break
at Strain
F1 2.22±0.34 4.826±0.36 11.62±0.43 0.46±0.09
F2 1.90±0.32 4.52±0.32 12.36±1.12 0.42±0.02
F3 1.78±0.31 4.944±0.32 16.39±0.46 0.36±0.13
F4 1.76±0.41 4.512±0.26 14.53±1.30 0.39±0.03
12 41
Jayesh et. al., Res. 2014; 4(2) ISSN: 2249-3387
International Journal of Research
Available at https://edupediapublications.org/journals
e-ISSN: 2348-6848 p-ISSN: 2348-795X Volume 03 Issue 1
January 2016
Available online: https://edupediapublications.org/journals/index.php/IJR/ P a g e | 1241
release data of the tested patches were analyzed on the basis of best fit models. The correlation coefficient was calculated for different kinetic models and the model, where the correlation coefficient was close to unity, was selected as the best fit model. The correlation coefficients of different models are shown in table 4. Formulations ( F1,F2,F3 andF4) gave best fit to the Higuchi kinetic model and F5 gave best fit to first order model.
Table 4 Regression coefficient value of different kinetic models
Formulation Zero order Higuchi Model First order K-Peppas
F1 0.9362 0.9563 0.9484 0.9161
F2 0.9160 0.9866 0.9682 0.9175
F3 0.8410 0.9593 0.9073 0.9509
F4 0.7400 0.9336 0.9003 0.8399
F5 0.9550 0.9608 0.9836 0.9048
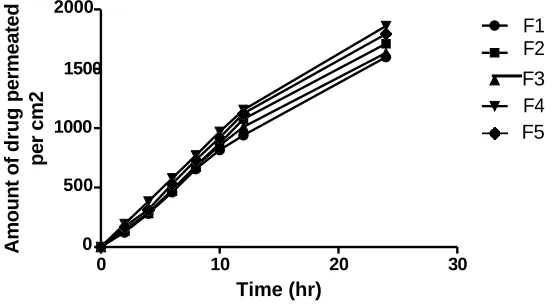
In vitro skin permeation profile of various transdermal patches is shown in figure 4. The drug permeation was good and showed the similar profile as that of the drug release. F4 showed a maximum drug permeation (1599.62 µg/cm2) over a period of 24 hr followed by F5 (1794.2 µg/cm2), F2 (1712.95 µg/cm2), F3 (1636.2 µg/cm2) and F1 (1599.62 µg/cm2). The flux (J) was found maximum with 78.44mcg/cm2.hr for F4.
2000 F1 F2 1500 F3 F4
1000 F5
500
0
0 10 20 30
Time (hr)
Figure 4 In vitro skin permeation of different formulation
D optimal mixture design was used for the optimization of formulation in the present work. Total 5 trial formulation of nifedipine were proposed by the D-optimal mixture design, for two mixture components: amount of HPMC (X1, %) and EC (X2,%). The effect of these variables on drug permeated per cm2 at 24 hr (P24), permeation flux (J) and cumulative amount of drug release at
12 hr (Q12) were investigated as optimization response parameters in the current study.
12 43
Jayesh et. al.,
International Journal of Research
Res. 2014; 4(2) ISSN: 2249-3387Available at https://edupediapublications.org/journals
e-ISSN: 2348-6848 p-ISSN: 2348-795X Volume 03 Issue 1
January 2016
Available online: https://edupediapublications.org/journals/index.php/IJR/ P a g e | 1243
The effect of mixture component on dependent variables were modelled using the following equation
�� = 0 + �1�1 + �2�2 + �12 �1�2 + �11 �2 + �22 �2
1 2
Where Y is predicated response, b0 is the arithmetic mean of all responses, b1 & b2 are the
estimated coefficient for factors A & B respectively. Positive sign of the term indicates additive effect, while negative sign indicates antagonistic effect. The mathematical design for the dependent responses are as follow:
�24 = +1858.04 � + 1584.15 � � = +78.83� + 67.83� �12 = +79.44� + 30.63�
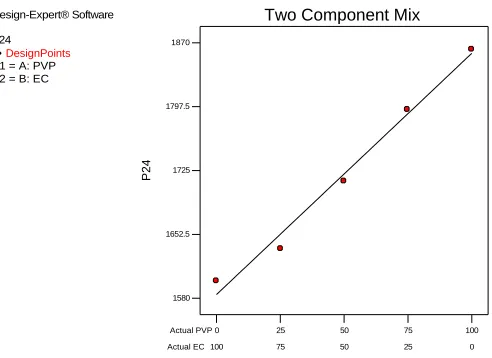
The effect of mixture component on the dependent responses are shown in figure 5-7.
Design-Expert® Software
P24
DesignPoints
X1 = A: PVP X2 = B: EC
1870
Two Component Mix
1797.5
1725
1652.5
1580
Actual PVP 0 25 50 75 100 Actual EC 100 75 50 25 0
Figure 5 Two component mix plot for response amount permeated per cm2 at 24 hr (P24)
Design-Expert® Software
J 79
DesignPoints
X1 = A: PVP X2 = B: EC
Two Component Mix
76
73
70
67
Actual PVP 0 25 50 75 100
J
12 45
Jayesh et. al., Res. 2014; 4(2) ISSN: 2249-3387
International Journal of Research
Available at https://edupediapublications.org/journals
e-ISSN: 2348-6848 p-ISSN: 2348-795X Volume 03 Issue 1
January 2016
Available online: https://edupediapublications.org/journals/index.php/IJR/ P a g e | 1245
Actual EC 100 75 50 25 0
Design-Expert® Software
Q12 80
DesignPoints
X1 = A: PVP X2 = B: EC
Two Component Mix
66
52
38
24
Actual PVP 0 25 50 75 100
Actual EC 100 75 50 25 0
Figure 7 Two component mix plot for response cumulative drug release at 12 hr (Q12)
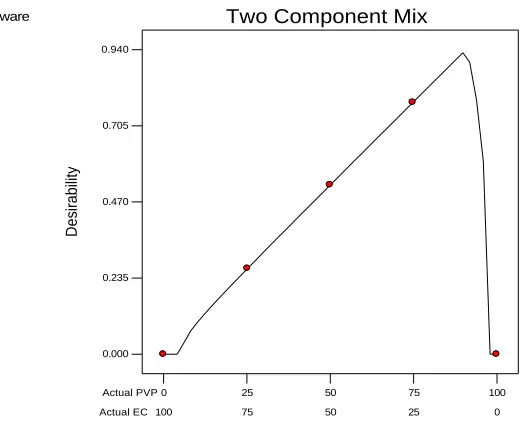
A numerical optimization technique based on the desirability approaches was used to select optimized formulation with desired responses, which was also used as a check point.
Design-Expert® Software
Desirability
DesignPoints
X1 = A: PVP X2 = B: EC
0.940
Two Component Mix
0.705
0.470
0.235
0.000
Actual PVP 0 25 50 75 100
Actual EC 100 75 50 25 0
Figure 8 Numerical optimization of transdermal patch on the basis of desirability
The variables setting used for the preparation of optimized transdermal patch were amount of PVP (A) and EC (B) was 90.91 % and 9.09 % respectively (Figure 8). The optimized formulations were formulated with the optimized amount of independent variable by solvent
12 47
Jayesh et. al., Res. 2014; 4(2) ISSN: 2249-3387
International Journal of Research
Available at https://edupediapublications.org/journals
e-ISSN: 2348-6848 p-ISSN: 2348-795X Volume 03 Issue 1
January 2016
Available online: https://edupediapublications.org/journals/index.php/IJR/ P a g e | 1247
CONCLUSION
In conclusion, the preparation of nifedipine transdermal patches using solvent casting method is feasible. Moreover we may prepare nifedipine transdermal patches with highest permeation rate by employing design of experiment based on D optimal mixture design. The optimized transdermal patch was prepared with 90.91 % PVP and 9.09 % EC. This developed optimized transdermal patch showed prolonged sustained release of nifedipine with high permeation rate, thus the transdermal patch of nifedipine as one of the promising tool for delivery of Nifedipine in order to achieve improved patient compliance and bioavailability.
REFERENCES
1. Shailesh T. Prajapati, Charmi G. Patel, Patel CN. Formulation and Evaluation of Transdermal Patch of Repaglinide. ISRN Pharmaceutics. 2011:1-9.
2. Mishra AN. Transdermal Drug Delivery In: N.K.Jain, editor. Controlled and Novel Drug Delivery. New Delhi, India: CBS Publisher and Distributor 1997.
3. Tiwary AK, Sapra B, Jain S. Innovations in Transdermal Drug Delivery: Formulations and Techniques. Recent Patents on Drug Delivery & Formulation. 2007;1:23-36.
4. Ahmed MG, Kumar K, Kumar S. Formulation and Evaluation of Nifedipine Transdermal Patches. J Pharm Res 2010;3(8):1785-7.
5. Y. Lalitha, Lakshmi PK. Enhancement of dissolution of nifedipine by surface solid dispersion technique. Int J Pharm Pharma Sci 2011;3(3):41-6.
6. Benson HAE. Transdermal Drug Delivery: Penetration Enhancement Techniques. Current Drug Delivery. 2005;2:23-33.
7. Mamatha T., Venkateswara Rao J., Mukkanti K., G. R. Development of matrix type transdermal patches of lercanidipine hydrochloride: physicochemical and in-vitro characterization. DARU 2010;18(1):9-16.
8. USP. Uniformity of dosage unit. 2007.
9. Chatterjee A, Bhowmik BB, Awasthi D. Prolong Release Bioadhesive Vaginal Film of Anti-Hiv Drug (Zidovudine): Formulation and In- Vitro Evaluation. Int J Pharma Sci Res. 2010;1(3).
12 49
Jayesh et. al.,
International Journal of Research
Res. 2014; 4(2) ISSN: 2249-3387Available at https://edupediapublications.org/journals
e-ISSN: 2348-6848 p-ISSN: 2348-795X Volume 03 Issue 1
January 2016
Available online: https://edupediapublications.org/journals/index.php/IJR/ P a g e | 1249
12. Awasthi R, Kulkarni GT. Development of Novel Gastroretentive Floating Particulate Drug Delivery System of Gliclazide. Current Drug Delivery. 2012;9:437-51.
13. Dash S, Murthy PN, Nath L, Chowdhury P. Kinetic modeling on drug release from controlled drug delivery systems. Acta Poloniae Pharmaceutica - Drug Research. 2010;67(3):217-23.
14. Barbero AM, Frasch HF. Pig and guinea pig skin as surrogates for human in vitro penetration studies: A quantitative review. Toxicology in Vitro. 2009;23(1):1-13.