Exploring Mathematical Functions through
Dynamic Microworlds
Veronica Gitirana Gomes Ferreira
PhD
Abstract
The aim of this research was to investigate students' perceptions of function as they interacted with the different dynamic representations of function made available through computer environments. Microworlds were designed comprising sequences of activities around the software, Function Probe, and two adaptations of DynaGraph, DG Parallel (with parallel axes) and DG Cartesian (using Cartesian axes). A series of case studies of four pairs of students was undertaken in Brazil in order to trace the evolution in students' perceptions of a selection of function properties; namely turning point, variation, range, symmetry and periodicity. This diversity of properties was chosen to examine different ways students analyse functions: pointwise, variational, global and pictorial.
Starting with an examination of the curriculum followed by the case study students as a means to describe the origins of their perceptions, a longitudinal investigation was undertaken in order to identify the main features of each of the microworlds that appeared to contribute to students' progress. The students' perceptions were analysed by drawing attention to their origins, their usefulness and their potential limitations (from a mathematical point of view). A methodology for this longitudinal study was devised which incorporated visual presentations to capture the main characteristics of students' perceptions.
Table of Contents
Acknowledgements
1- The study Aims
2 The underlying rationale 3 Research questions 4 The concept of function 5 Description of the thesis
11- The Software Programs Description of Function Probe 2 Description of DynaGraph
III - Review of the Literature on Function Representations
2 Methodological approach to investigating students' perceptions 3 Students' perceptions of the function properties
4 Software for functions
5 Research exploring DynaGraph and Function Probe
6 The research questions in the context of the software programs
IV - Methodology
Outline of the empirical study 2 The case study students
3 The students' previous knowledge 4 The research environment 5 The final interview
6 Data collection
7 Overview of strategies of analysis
V - The Pilot Study
VI - An Analysis of the Curriculum The Brazilian mathematics curricula 2 Previous work
3 The introduction of the topic of function
4 The properties and families of functions 5 The role of each representation 6 Over-generalisations and obstacles 7 Summary
VII - Longitudinal Analysis of the Work of the Pairs of Students Description of the pairs of students
2 Bernard & Charles' perceptions of the function properties 3 John & Tanya's perceptions of the function properties 4 Diana & Gisele's perceptions of the function properties 5 Anne & Jane's perceptions of the function properties
VIII - Cross-sectional Analysis
The evolution of students' perceptions of each function property 2 Synthesis
3 Associations 4 Obstacles
5 The role of the microworlds
IX - Discussion of Results
The properties as represented in the different microworlds 2 Qualitatively different representations
3 Synthesis 4 Associations
5 Overcoming the limitations of associations and obstacles 6 Interacting with transformations of graphs
X - Conclusions
Summary of research
2 Contributions to mathematics education 3 Limitations observed in the research 4 Implications for practice in Brazil 5 Future research
References
Appendix I - Material of Empirical Study Questionnaire undertaken with the students
2 The interview undertaken with the mathematics teacher 3 The Pre-test
4 Journey through FP - Pizza
5 Worksheets and cards of FP microworld 6 Worksheets and cards of DG microworlds 7 The final interview - an example
8 Sheets for helping the observations
Appendix 11-Details of the Activities Starting activities with DG Parallel
2 Activities around DG Parallel and DG Cartesian 3 Starting activities with FP
4 Activities around FP software
Appendix 111-An Example of the Reports of the Data The pre-test
2 DG Parallel 3 DG Cartesian 4 FP
5 Analysis of the blob diagram 6 The final interview
Appendix IV - Tables and Diagrams of Students' Perceptions of the Function Properties
Turning point 2 Constant function 3 Monotonicity 4 Derivative 5 Second derivative 6 Range
7 Symmetry 8 Periodicity
Appendix V - Tables Summarising the Students' Findings in Different Properties Findings while exploring transformations of graphs
2 Synthesis
3 Associations and obstacles 4 Exploration of DG microworlds
Diagrams
CIV-1.1 Flowchart of the activities of the empirical study 66
CIV-1.2 Composition of the research environment 66
CIV-7.1 Disposition of the microworlds in the blob diagrams 89
CIV-7.2 Pentagon of the pre-test 89
CIV-7.3 Construction of the pentagon of DG Parallel 90
CIV-7.4 Construction of the pentagon of DG Cartesian 91
CIV-7.5 Construction of the pentagon of FP 92
CIV-7.6 Addition of the findings of the final interview 93 CVII-2.1 Charles & Bernard's perceptions of turning point 124 CVII-2.2 Charles & Bernard's perceptions of constant function 126 CVII-2.3 Charles & Bernard's perceptions of monotonicity 128 CVII-2.4 Charles & Bernard's perceptions of derivative 130 CVII-2.5 Charles & Bernard's perceptions of second derivative 133 CVII-2.6 Charles & Bernard's perceptions of range 136 CVII-2.7 Charles & Bernard's perceptions of symmetry 139 CVII-2.8 Charles & Bernard's perceptions of periodicity 141 CVII-3.1 John & Tanya's perceptions of turning point 143 CVII-3.2 John & Tanya's perceptions of constant function 146 CVII-3 .. 3 John & Tanya's perceptions of monotonicity 148
CVII-3.4 John & Tanya's perceptions of derivative 151
CVII-3.5 John & Tanya's perceptions of second derivative 155
CVII-3.6 John & Tanya's perceptions of range 158
CVII-3.7 John & Tanya's perceptions of symmetry 160
CVII-3.8 John & Tanya's perceptions of periodicity 162
CVII-4.1 Diana & Gisele's perceptions of turning point 164 CVII-4.2 Diana & Gisele's perceptions of constant function 167 CVII-4.3 Diana & Gisele's perceptions of monotonicity 169 CVII-4.4 Diana & Gisele's perceptions of derivative 173 CVII-4.5 Diana & Gisele's perceptions of second derivative 176
CVII-4.6 Diana & Gisele's perceptions of range 179
CVII-4.7 Diana & Gisele's perceptions of symmetry 182
CVII-4.8 Diana & Gisele's perceptions of periodicity 184 CVII-5.1 Anne & Jane's perceptions of turning point 187 CVII-5.2 Anne & Jane's perceptions of constant function 188 CVII-5.3 Anne & Jane's perceptions of monotonicity 191
CVII-S.S CVII-S.6 CVII-S.7 CVII-S.8 AIV-1.1 AIV-2.1 AIV-3.1 AIV-4.1 AIV-S.1 AIV-6.1 AIV-7.1 AIV-8.1
Tables
CIV-4.1 CIV-4.2 CIV-4.3 CIV-S.1 CVI-3.1 CVII-1.1 AII-1.1 AII-2.1 AII-2.2 AII-3.1 AII-4.1 AII-4.2 AII-4.3 AIII-2.1 AIII-3.1 AIII-3.2 AIII-4.1 AIII-4.2Anne & Jane's perceptions of second derivative Anne & Jane's perceptions of range
Anne & Jane's perceptions of symmetry Anne & Jane's perceptions of periodicity
Comparison of the students' perceptions of turning point Comparison of the students' perceptions of constant function Comparison of the students' perceptions of monotonicity Comparison of the students' perceptions of derivative Comparison of the students' perceptions of second derivative Comparison of the students' perceptions of range
Comparison of the students' perceptions of symmetry Comparison of the students' perceptions of periodicity
Similarities and contrasts of the properties within and between the function families
Activities of DG microworlds Activities of FP microworld
Detail of activities developed during the final interview Properties explored in each family of functions
Distribution of students in sequence of microworlds per attainment levels
Description and aims of the starting activities with DG Parallel Details of activities of description in DG Parallel and DG Cartesian Details of activities of classification in DG Parallel and DG Cartesian Details of the starting activities with FP
Details of activities of description in FP (continues in table 4.2) Continuation of table 4.1 (Details of activities of description in FP) Details of activities of classification in FP
Summary of Bernard & Charles' findings in DG Parallel Summary of Bernard & Charles' findings in DG Cartesian
Continuation of the summary of Bernard & Charles' findings in DG Cartesian
Summary of Bernard & Charles' findings in FP
Continuation of the summary of Bernard & Charles' findings in FP
AIV-1.1 Summary of the perceptions of turning point in each microworld of the
pairs of students who began by working with DG 312 AIV-1.2 Summary of the perceptions of turning point in each microworld of the
pairs of students who began by working with FP 313 AIV-1.3 Changes in students' perceptions of turning point in relation to
FP commands 315
AIV-2.1 Summary of the perceptions of constant function in each microworld of
the pairs of students who began by working with DG 316 AIV-2.2 Summary of the perceptions of constant function in each microworld of
the pairs of students who began by working with FP 317 AIV-2.3 Changes in students' perceptions of constant function in relation to FP
commands 319
AIV-3.1 Summary of the perceptions of monotonicity in each microworld of the
pairs of students who began by working with DG 320 AIV-3.2 Summary of the perceptions of monotonicity in each microworld of the
pairs of students who began by working with FP 321 AIV-3.3 Changes in students' perceptions of monotonicity in relation to FP
commands 323
AIV-4.1 Summary of the perceptions of derivative in each microworld of the
pairs of students who began by working with DG 324
AIV-4.2 Summary of the perceptions of derivative in each microworld of the
pairs of students who began by working with FP 325 AIV-4.3 Changes in students' perceptions of derivative in relation to FP
commands 327
AIV-5.1 Summary of the perceptions of second derivative in each microworld
of the pairs of students who began by working with DG 328 AIV-5.2 Summary of the perceptions of second derivative in each microworld
of the pairs of students who began by working with FP 329 AIV-5.3 Changes in students' perceptions of second derivative in relation to FP
commands 331
AIV-6.1 Summary of the perceptions of range in each microworld of the pairs
of students who began by working with DG 332
AIV-6.2 Summary of the perceptions of range in each microworld of the pairs
of students who began by working with FP 333
AIV-6.3 Changes in students' perceptions of range in relation to FP commands 335 AIV-7.1 Summary of the perceptions of symmetry in each microworld of the
AIV-7.2 AIV-7.3 AIV-8.1 AIV-8.2 AIV-8.3 AV-1.1 AV-1.2 AV-1.3 AV-1.4 AV-1.5 AV-1.6 AV-1.7 AV-2.1 AV-2.2 AV-2.3 AV-2.4 AV-3.1 AV-3.2 AV-4.1 AV-4.2
Figures
CII-1.1 CII-1.2 CII-1.3 CII-1.4Summary of the perceptions of symmetry in each microworld of the pairs of students who began by working with FP
Changes in students' perceptions of symmetry in relation to FP commands
Summary of the perceptions of periodicity in each microworld of the pairs of students who began by working with DG
Summary of the perceptions of periodicity in each microworld of the pairs of students who began by working with FP
Changes in students' perceptions of periodicity in relation to FP commands
The students' findings while exploring the horizontal translation The students' findings while exploring the vertical translation The students' findings while exploring the horizontal stretch The students' findings while exploring the vertical stretch The students' findings while exploring the horizontal reflection The students' findings while exploring the vertical reflection The main ways the pairs used the transformations
Connections built while working in DG Parallel in each property Connections built while working in DG Cartesian in each property Connections built while working in FP in each property
Connections between properties in strikers and graphs built in the final interview
Association between different perceptions
Summary of moments when obstacles were clearly observed Main aspects of the students' perceptions of each property in DG Parallel
Main aspects of the students' perceptions of each property in DG Cartesian
Graph window of Function Probe with menu Point indicator being used
Horizontal translation of the graph of y=x2, in three phases: before, during and after it
Vertical stretch of the graph of y=5sin(x), in three phases: after marking the anchor line; during stretch; and the result
CII-1.5 Three phases in horizontal stretch in the graph of y=5sin(x): after
marking the anchor line; during a dynamic stretch; and the final screen 24 CII-1.6 Vertical reflection of the graph of y=abs(x) in two phases: during the
choice of reflection line; and its results 25
CII-2.1 Screen of DynaGraph showing: R -> R and equation 26 CII-2.2 Screen of DynaGraph with the Cartesian version displayed 27 CIII-1.1 Projection of an angle a on the y-axis by the trigonometric circle 34
CIII-1.2
I,
9, hand j represented by diagrams 35CIII-1.3 Tabular representation of the functions
I,
9, hand j. 36 CIII-1.4 Cartesian representation of the functionsI,
9, hand j 36CIII-3.1 Graph of l(x)=0.5x 51
CIV-4.1 Screen of DG Parallel with the striker of y=-x displayed 73 CIV-4.2 Screen of DG Cartesian with the striker of y=-x displayed 74 CIV-4.3 Graphs and equations of two of the chosen functions 75 CIV-4.4 Graphs and equations of six of the chosen functions 76 CIV-4.5 Graphs and equations of other four functions chosen 77 CVI-3.1 Introduction of the mathematical notion of function in the textbook 103 CVI-4.1 Exploration of monotonicity and points in the classes (student's
notebook) 106
CVI-4.2 Graphic introduction of the idea of monotonicity 107 CVI-4.3 Graphic and tabular introduction of the idea of decreasing 10B CVI-4.4 A summary of the connections of monotonicity in all representations 10B CVI-4.5 Scheme of sign of the values of
I
for linear functions 109 CVI-4.6 Graphic presentation of rate of average change in the textbook 109 CVI-4.7 Diagrammatic presentation of domain and range in the textbook 110 CVI-4.B Graphic definition of range and domain in the general introduction 111 CVI-4.9 Exploration of range in graphical and tabular representations 112 CVI-4.10 Graphic and tabular explorations of range in the textbook 112 CVI-4.11 Table relating coefficients, domain, period and range of sine functions 113CVI-4.12 Graphic presentation of a limited range 113
CVI-4.13 Graphic presentation of line of symmetry different from the y-axis 114
CVI-4.14 The graph of sin(x) 115
CVI-5.1 Graphic division of the Cartesian system in quadrants 116 CVI-6.1 Student's notebook treating a sine as a quadratic function 11B CVII-3.1 Scheme of the imaginary angle in DG Parallel 153
Acknowledgements
I would like to express my gratitude to my supervisor, Prof. Celia Hoyles, for her central role in the whole process of elaboration of this study. All her insightful comments on my work contributed enormously to my formation as a researcher. I also thank Prof. Alison Wolf and Prof. Richard Noss for their valuable suggestions as members of my annual Review Board. My friend, Elizabeth Moren, helped me considerably by reading and discussing the earlier drafts of many chapters of this thesis.
This degree was made possible by funding from CAPES - a Brazilian institution for supporting academic development. CAPES' members also did all they could to help me at all times. In fact, I am grateful to the people of Brazil, who ultimately fund CAPES. The Federal University of Pernambuco in Brazil also invested in my academic career by giving me leave of absence from work.
The friendly teacher and students who participated in the empirical study were so generous and important to the development of this study. The school where I did the empirical study also allowed me to access the necessary information
Paulo Figueiredo, Licia Maia, Paulo Gileno, Sandra Magina and Maria Antonia MacDowell were some of my academic colleagues and professors in Brazil who, by trusting in my potential, encouraged me to start, continue and finish this research.
All thanks to the staff of Mathematical Science Group, especially Wendy Robins, Alison Shapton and Dorothy Pattman in the office, who during these four years gave me friendly help. In particular, Dorothy Pattman patiently corrected the English of this thesis.
12
I-The Study
1 Aims
This research investigates students' perceptions of function as they interact with different dynamic representations of function available through computer environments.
A selection of properties of function are distinguished and the study seeks to analyse how students come to discriminate, generalise, and synthesise these properties while working with chosen software programs in activities designed to encourage exploration of the dynamic features of the programs. The software used will be: DynaGraph (Goldenberg et ai, 1992) and Function Probe (FP) (Confrey et ai, 1991 a). Two adaptations of DynaGraph will be implemented: one parallel version (DG Parallel) and one Cartesian version (DG Cartesian). The set of activities around each software will be described as a microworld.
The research focuses on the following set of aims:
• an analysis of students' perceptions of the following properties of mathematical function: range, periodicity, variation, turning point and symmetry,
• the identification of differences and similarities in students' perceptions of these properties during interaction in the different microworlds;
• the identification of any sources of difficulty; • the tracing of trajectories of learning;
• the identification, where possible, of the antecedents of any difficulty particularly in so far as this might originate in the Brazilian curricula;
• the identification of how links come to be forged between the different perceptions of a property of function as evidenced in the different microworlds and between these perceptions and students' previous knowledge.
2 The underlying rationale
is that dynamic visual tools available in FP and in DynaGraph will lead students to differentially emphasise the properties of function as well as to perceive them in a different light.
Additionally, this study assumes that by describing and comparing functions as represented in different microworlds, students will be provoked to revise and generalise their perceptions of the chosen properties of function.
3 Research questions
The study attempts to address the research question:
How does interaction with the dynamic tools offered by DynaGraph and Function Probe structure students' perceptions of the following properties of function: range, turning point, symmetry, variation and periodicity?
The following questions adress the interaction in detail:
Q1:
How do students discriminate and generalise these properties in each microworld?Q2:
How does their knowledge of school mathematics affect their perceptions of these properties?Q3:
What role do the dynamic software tools play in helping students to overcome obstacles and any limitations in their perceptions?Q4: Are these different perceptions synthesised by the students? If so, how? If not, why not?
Q5: How do explorations of the dynamic tools of Function Probe and DynaGraph change students' previous knowledge?
4 The concept of function
The history of mathematics shows that the study of functions has been emphasised differently over time. Early studies on functionality together with the evolution of its definition reflect these changes in emphasis showing how functions were perceived. The concept of function has evolved from a geometric approach in the seventeenth century, through an algebraic approach in the eighteenth century to a set-theoretical approach in modern times.
between the phases of the moon and the days of a month. In medieval mathematics, without any abstractions or definitions of the concept, functionality was studied as
the science of dynamics. Rates of change such as speed and acceleration were the focus of these discussions. Even later, when the term was first used, the study of functions reflected the preoccupation with describing how variation in one quantity can affect
variation in another - a variational view. According to Malik (1980), in the 17th century "The investigation of a relation between two
varying quantities
[my emphasis] had been fundamental in arriving at the concept of function" (p.490).The first appearance of the term 'function' was in 1692 with Leibniz and Bernoulli, who adopted it "to designate certain variable geometrical quantities - such as ordinate, tangents, and radii of curvature - connected with given curves" (Boyer, 1946: 12). On being linked with curves, the term received a geometrical approach which involved also a variational view.
In the 18th century, mathematicians developed another definition which treated the concept of function essentially as an equation. For them a function was: "an analytic expression representing the relation between two variables with its graph having no corners" (Malik, 1980: 490). As pointed out by Boyer (1946), "The word function, as introduced by Leibnitz and as used during the eighteenth century, was essentially equivalent to the word formula" (p.12).
Despite this new definition, the geometric approach of function was not lost. "Euler saw that any curve drawn free hand in a plane determines a functional relationship which may not be representable, either implicitly or explicitly, in ordinary analytical form" (Boyer, 1946: 12). This observation was used by Lacroix to give a
broader scope for the term function. For him, "Any quantity the value of which depends on one or more other quantities is said to be a function of the latter, whether or not one knows by what operations one can pass from the latter to the first quantity" (op.cit.: 12-13). Nonetheless, by his illustrations, Lacroix showed that he was still considering functions given by formulae or equation. In 1837, Dirichlet revised the definition of function to: "y is a function of x, for a given domain of values of x, whenever a precise law of correspondence between x and y can be stated clearly" (op. cit.: 1 3) where he meant by 'precise law' a rule which gives to x one and only one value of y. He intended to include badly-behaved functions such as the well-known Dirichlet's totally discontinuous curves, which is given by y=f(x) is 1 if x is rational or 0 otherwise. The unicity of a function was highlighted.
Malik (1980) points out that with the introduction of topology and metric spaces,
(domain and range). "In 1917, Caratheodory defined a function as a rule of correspondence between a set A to real numbers and in 1939 Bourbaki defined function as a rule corresponding to two sets and in later chapters observed that it is a subset of the Cartesian product of sets" (p.491). The Dirichlet-Bourbaki definition appeared as:
'A function j from A to B is defined as any subset of the Cartesian product of A and B, such that, for every aEA there is exactly one bE B such that (a,b}Ef'. This definition is a set-theoretical approach to functions which emphasises the concept as a mathematical entity.
As Burn (1993) explains, in English education, there is a contrast between the way function is explored at university level and at high school level. He argues that at university, functions are treated as they were by mathematicians at the beginning of the 19th century while at school level functions are treated as in the 17th and 18th centuries, where notions such as limits and real numbers are not explored.
School mathematics following a traditional approach has introduced students to the concept of function using the Dirichlet-Bourbaki definition. In line with traditional school mathematics, the majority of Brazilian secondary schools present this definition in the following way:
'Given A and B two sets, a relationship j is said to be a function if and only if for every element aE A exists only one element bE B such that j(a)=b'.
Although these schools introduce functions in a set-theoretical approach, the examples explored in general consist of functions specified by their equations. As shown by Vinner & Dreyfus (1989) and argued by Malik (1980), students do not use the definition to build their perceptions. "A student retains a concept only if it is used in the course; if only its particular form is used, the student unconsciously accepts the particular form ... " (Malik, 1980: 490-491). The majority of students rarely perceive function as a mathematical entity. Analysing students' and teachers' perceptions and definition, Vinner & Dreyfus (1989) classified them in the following ways: as a correspondence, as a rule, as a dependence relation, as an operation, as a formula, or as appearance of function in a determined representation.
is analysed according to 'how x is associated to y'. A definition which takes the function as being almost defined by an equation seems to be closely related to this view. Also, as Malik (1980) argues, the Dirichlet-Bourbaki definition which is algebraic in its sense, "appeals to the discrete faculty of thinking and lacks a feel for the variable" (p.492).
Vinner & Dreyfus (1989) showed that students' perception of a function also depends on the form in which it is expressed. When presented as a graph, function is usually perceived as a well-behaved curve. Research on students' understanding of graphs has pointed out that students usually interpret properties of function in a graph by its shape as a static picture (Goldenberg, 1988), which has been called a pictorial view. When presented by an equation, a function is essentially perceived as a process of taking one input [x] and obtaining one output [y], which has been called a procedural view. In circumstance when the students do not see x as a variable, this emphasis can lead them to analyse functions as the correspondence of points - a pointwise perception.
The present research will not take one of these views as the best way of dealing with the concept of function but rather the intention is to try to analyse the perceptions of the students while exploring the properties of function and to examine how students' ideas of the properties develop while interacting in each microworld. However, I have to consider that for each microworld, the designers intend to lead students to at least one of the views as distinguished above. For example, Goldenberg et al (1992) with DynaGraph intended to give students an opportunity to change their views of function from pointwise to variational. As regards Function Probe, while using multiple representations in contextual problems Confrey (1992a) intended to lead students to a variational view. These intentions will be analysed in section 5 of chapter III of after the description of the software in chapter II.
5
Description of the thesis
empirical study comprising four case studies with pairs of students. Appendix I will present worksheets used in the empirical study and appendix II will present the activities designed for the study around each software environment. Appendix III will present the steps used in the analysis of the data.
Chapters V, VI, VII and VIII will discuss the results of the empirical study. Chapter V will describe the pilot study and its findings. An analysis of how Brazilian schools approach the topic of function will be presented in chapter VI. Chapter VII will analyse the evolution of each pair of students' perceptions of the chosen function properties. Appendix IV will present tables and diagrams of students' perceptions of each of the chosen function properties. Chapter VIII will summarise and synthesise the work of all the pairs of students by comparing the findings from chapters VI and VII. Appendix V will present tables with evidence of the findings discussed in chapter VIII.
Chapters IX and X will conclude the research. Chapter IX will discuss the research findings in relation to other studies on function. Finally, chapter X will discuss issues arising from this study in relation to the research questions affecting the teaching and learning of mathematical function and the place of function in the school curriculum.
II -
The Software Programs
Before the review of the literature on functions, brief descriptions of Function Probe and DynaGraph will be presented. The descriptions will focus on the features of the software programs which will be explored in the present study. The reader who already knows both software programs will not find it necessary to read this chapter.
1 Description of Function Probe
Function Probe (Confrey et ai, 1991 a) is a multiple representational software tool to enable students to explore the idea of functions. It combines three representations (equations, graphs and tables) in three windows (Graph, Table and Calculator). The integrity of each representation is preserved. Students can explore functions with actions either within one representation or with links made between different representations. This study will focus on the Graph window of FP particularly in the transformations students do in graphs while looking for properties of functions. Therefore, this section will present a description of the Graph window only. For a complete description of FP see Confrey et al (1991 a). Also, section AI-4 presents a 'Journey through the software'.
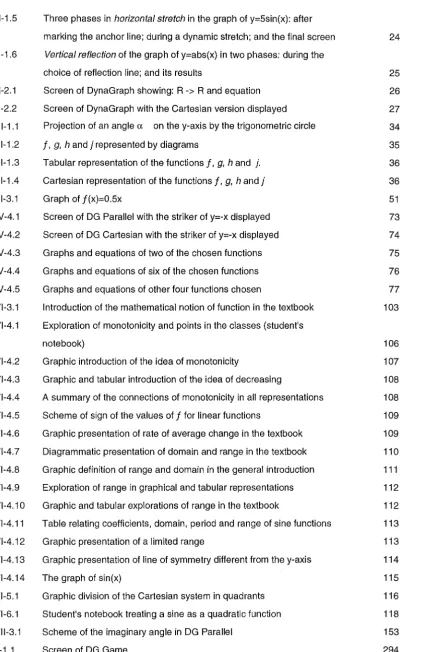
The Graph window presents both Cartesian and algebraic representations. This software allows dynamic transformations in graphs: stretching, translating and reflecting. Figure 1.1 presents the Graph window with FP menu.
Figure 1.1
Graph window of Function Probe with menu
File Edit Windows
Send Graph
Graph
equationview
se leCltion icon
10-, feedback new equation
icon
. of commands:
sketching icon
tnmslation icon
. ,
-10.
reflection kon --3tJ,i1='«~
stretching kon
s--s s
. , . . . . + . . . . I
-s-
-10-10
.
,
: graph ·view
~
~
- New equation icon can be used to graph a function by its algebraic representation as input. Clicking the mouse on its icon, y= appears in the equation space in the equation and history view. Then, the user needs to write down the equation and press the [Return]-key. Function Probe traces its graph as feedback. Multiple graphs are allowed in the graph view.fFl
L.:tJ -
Selection icon is used to select one of the graphs presented on the graphview. When selected, the graph is highlighted in the graph view and its algebraic representation appears in the equation space, whenever possible. Selecting a graph is a necessary procedure to use the transformations: stretch, reflection and translation.
(1(:-: .... )
, t"J
Figure 1.2
Point indicator being used
Graph
( H ,
Y )
=
(-1.3, -1.2 )
While exploring FP, this research will focus on the effects of the transformations of graphs on students' perceptions of function and of its properties. Therefore, I will give some examples of the execution of these transformations in graphs as a textual description of dynamic procedures is difficult. However, I really believe that the reader must try Function Probe at least once to grasp the real dimension of these transformations. Each of the transformations has at least two versions: vertical and horizontal. As the examples below only show the effects of these transformations, to learn how to operate them see the 'Journey through Function Probe software' in section AI-4.
ffi -
When clicking the mouse on the translation icon, the user will be asked to select horizontal or vertical translation.Vertical translation is similar to horizontal translation, but translates the graph in the direction of the y-axis, that is, vertically.
Figure 1.3
Horizontal translation of the graph of y=x2., in three phases: before, during and after it
~D
Graph
Graph
-~ ~
• I • • I
-5
• I
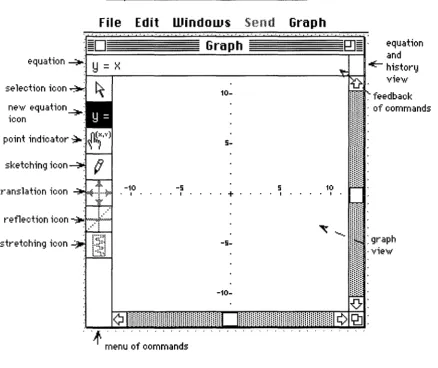
Vertical stretch with anchor line on the x-axis, for example, promotes a dynamic stretch of the value of y through the graph. In equation, the variable y is multiplied by the stretching coefficient which appears in the space of feedback of commands. Figure 1.4 presents vertical stretch of the graph of y=5sin(x) using the x-axis as anchor line by 1.515 in three phases.
Figure 1.4
Vertical stretch of the graph of y-5sin(x). in three phases: after marking the anchor line: during stretch: and the result
~"1.[]DD ~
Y
=
D.DW*1.515
-1
g
= (].OFigure 1.5
Three phases in horizontal stretch in the graph of y=5sin(x): after marking the anchor line: during a dynamic stretch: and the final screen
= 5sin(l·d
1,)1/1 -
On clicking the mouse on reflection icon, the student is asked to chooseamong: inversion, vertical and horizontal. Inversion (which will be not used in this research) reflects the graph through the line given by y=x causing an inversion of the function. For example, f(x) is reflected into /"1 (x).
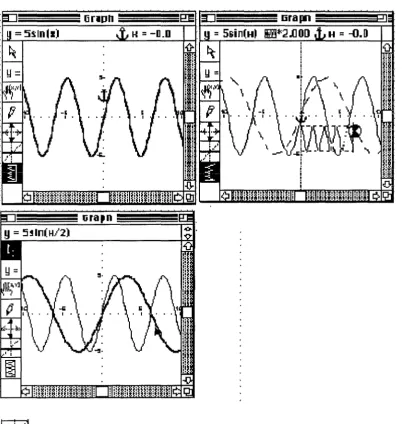
Figure 1.6
Vertical reflection of the graph of y-abs(x) in two phases: during the choice of reflection line: and its results
Horizontal reflection is similar to the vertical one. They differ by the variable reflected. For example, imagine a horizontal reflection in the graph of y=abs(x) with reflection line on the y-axis. It will not alter the graph.
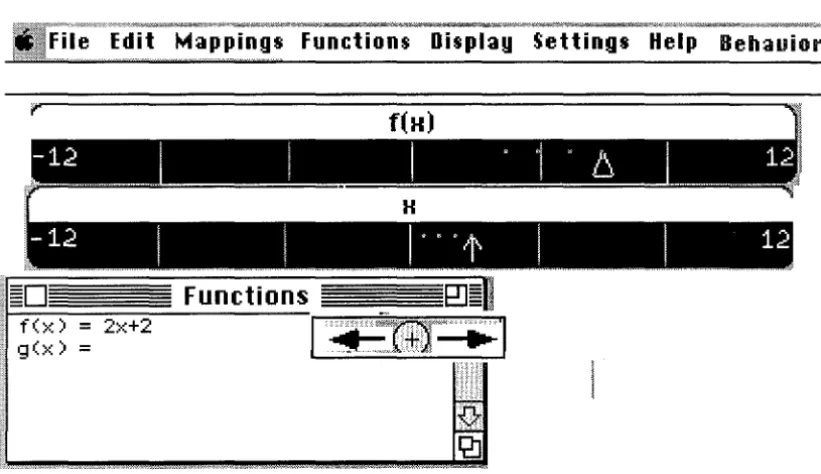
2 Description of DynaGraph
Figure 2.1
Screen of DynaGraph showing: R -> R and equation
-Ie Edit Mappings Functions Display Settings Help Behauiors
-12
I
I
.
1 .
6
12
. !
D
f(x) - 2x+2
g(x)
=
Functions
BJ '
The first stage in exploring DynaGraph is the definition of the function. Users are expected to enter the function by its algebraic representation. This step is done by selecting functions at the menu and writing down the equation. Then, DynaGraph enables the students to move the arrow, which represents x, and gives as feedback the change in the position of the triangle, which represents y. Thus, DynaGraph leads students to see function as the relation between 'transformation between X1 and x2'and 'transformation between Y1 and Y2' - a variational view.
Among the features of DynaGraph, I will emphasise here the following:
• 'the scales of x and f(x)' and 'the step x will vary' can be defined by the user. In figure 4.7, 'the step x will vary' is set to 0.5 units;
• the sprites of x, y and (x,Y) have two modes: they can leave dots in the screen or not. In figure 4.7, DynaGraph is set to leave the dots;
o up to two functions can be explored in the same screen. When set to use two
functions, DynaGraph presents another line (in the case of parallel version) to place the second function which is denoted in the screen by g(x);
• the window called Functions can be set to be on or off, making the equation available to the users or not;
functions by selecting one of the numbered behaviours. In this case, the Functions window will not present the equation of the current function. There, the equation stays as the last defined equation;
• all the features are available to users' choice by the menu.
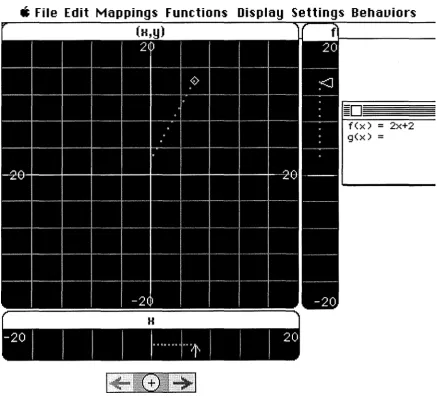
Figure 2.2 shows the Cartesian version of DynaGraph with the features in the following states: 'the step x will vary' is 0.5 units; the Functions window is on; the sprites are leaving the dots.
Figure 2.2
Screen of DynaGraph with the Cartesian version displayed
" File Edit Mappings Functions Display Settings Behauiors
f(x)
= 2x+2
111- Review of the Literature on Function
This chapter starts by introducing in sections 1 and 2 terms and approaches I will use for representations and concepts. Then, section 3 reviews the literature on students' perceptions of a concept particularly the perceptions of the function properties. Sections 4 and 5 discusses the use of software in the topic of function particularly the use of Function Probe and OynaGraph and the final section presents the research questions in the context of the software programs.
1 Representations
This section will introduce the approach taken in this research to the meaning of representation and its relation with concept. The different representations of function used in school mathematics will also be discussed.
1 .1 Representations and Concepts
Representation has been considered in mathematics education as a key to the construction of mathematical knowledge. I will base the definition of my use of the term on the survey published by Goldin (1992) in the proceedings of PME, which summarises the use of the term 'representation' in mathematics education research. Goldin classifies the meanings used for representation in mathematics education into three different types. The first one is internal, the second and third are external.
A first point to consider is the importance in mathematics of representation. Mathematics has a dual nature: it is a body of knowledge and a language. Therefore, as a language it has to be represented to communicate both to yourself and to others and to "provide an organizational framework" (Kaput, 1992: 522). Thus, representations are tools to facilitate both the understanding and the retrieval of mathematical knowledge. They are also used as a tool to universalise mathematics. These two characteristics of mathematics are regarded by many as inseparable. Dufour-Janvier et al (1987) suggest that mathematical concepts and representations are so closely associated that: "it is hard to see how the concept can be conceived without" (p.110) the representations. Thus, "the idea of representation is continuous with mathematics itself" (Kaput, 1987: 25).
Looking at the dual nature of mathematics, Kaput (1992) defined two worlds: "(i) a world of mental operations which is always hypothetical, and (ii) a world of physical operations, which is observable" (p.522). These two worlds can interact in both directions. Representations are part of the world of physical operations while concepts belong to that of mental operations. He defines a representation in two ways: in a functional way and in a technical way. In a functional way, the representations can be seen as a "system of rules (i) for identifying or creating characters, (ii) for operating on them, and (iii) for determining relations among them" (p.523). In a technical sense, a representation is "a set of rules that define the objects of the notation system and allowable actions on them" (p.523). In order to define the actions allowed in one representation, the material world where it is defined is essential. The material world can be paper-and-pencil, computer displays, physical objects, and so on. The actions are: transformations of objects within one representation and translations between objects from different representations. Translation between different representations is directional. For example, one can translate an equation into a graph by plotting points or translate information from a graph to find out an equation.
representations. I will therefore adopt an alternative notion of concept offered by Confrey et al (1991 b) who take the position that "representations and ideas are inseparably intertwined. Ideas are always represented, and it is through the interweaving of our actions and representations that we construct mathematical meaning" (p.1?). Thus, this research takes as a starting point the assumption that the connections between perceptions of a concept in different representations are essential for the construction of this concept.
Even if concepts and representations are inseparable, the successful use of any representation is not straightforward. Mathematics educators (Dufour-Janvier et ai, 198?; Boulton-Lewis & Halford, 1990; Greeno, 1983; and Goldenberg, 1988) have focused on students' difficulties when using representations, and have argued that each representation has its own structure and ambiguities (Goldenberg, 1988). This means that students' perceptions of a concept must be investigated with due consideration of the nature of the representation. Boulton-Lewis & Halford (1990), for example, considered that "The choice, and successful or unsuccessful use, of a representation depended on the child's knowledge of the representation itself, of content and of appropriate procedures" (p.203). In my view their consideration draws attention to the fact that while examining the students' perceptions of a concept, one has to consider any difficulties inherent in the representation. Goldenberg (1988), for example, focused on students' difficulties while analysing Cartesian representation. Subsection 1.2 will present a review of students' difficulties in the use of representations of function particularly the algebraic and the Cartesian representations.
Cartesian system. A second point to be considered is that each concept is perceived in different ways in each representation. Thus, developing a concept in different representations means that different aspects of the same concept can be perceived and leading students to generalise the concept to a wider range of applicability may result in overcoming limitations in each individual perception.
Students have to cope not only with different representations but also with making connections between different representations. Researchers (Confrey, 1992a; Borba, 1994; Goldenberg, 1988; Artigue & Dagher, 1993) discuss the use multiple representations. A common viewpoint is that inside each conventional representation a concept is seen in a different way. Artigue & Dagher (1993) argue that "A mathematical concept is not a monolithic object. A single concept may be understood from several points of view and may have several different representations; in mathematics one needs to be able to move freely between these points of view and representations, adapting them to the setting in which a concept is used" (p.1).
Confrey (1992a) summarising research on multiple representations makes several points in its defence. I intend in this study to investigate some of these points. She argues that multiple representations have the potential to:
• "highlight different aspects of the concept";
• "Lead to a convergence across representations that may improve or strengthen our depth of understanding";
• "promote examination of the potential conflict among forms of representations"; • allow assessing how changes in one representation affect another;
• "illustrate how alternate forms of actions in a representation can cause students to develop diverse schemes";
• "provide situations for students to conduct their own investigations of ideas"; • "provide opportunities for feedback, revision, and reflection that are created by
the student" (p.149-150).
connections: match corresponding objects in different representations, and predict the effects of a transformation of one object in one representation to its corresponding object in another representation.
Moschkovich (1993) showed that the development of students' perceptions is a process which involves limitations which are not confined to students' perceptions. Teachers also can carry limitations in their perceptions. The case study reported by Speiser & Walter (1994) is a good example of how a teacher can identify limitations in the bridges they build for the students by listening to them. Starting with a contextual representation of a function as the frames of a cat walking, the teacher tried to make the students reach the concept of derivative as the limit of secants in a Cartesian representation. In a first step, the students constructed the concept of rate of change. Then, they pointed out that the bridge proposed by the teacher to connect rate of change in this example with the limit of secants did not make sense. The students argued that the initial representation presented only discrete points which could not be modelled by a function without considering a margin of error. With this example, I argue that allowing the students to freely navigate on different representations, can:
• help them to recognise any limitations in their perceptions of a concept in one representation,
• allow them to construct perceptions within a representation, • encourage them to generalise these perceptions, and
• lead them to overcome any limitations of their previous perceptions.
representation; one must make calculations in order to find out the roots using equations.
Asymmetry amongst the status of the properties constitutes a qualitative difference between representations. The use of qualitatively different representations is put forward by Lesh et al (1987) and Arcavi & Nachmias (1989) as a way to help students improve their perceptions of mathematical concepts. Arcavi & Nachmias (1989) analysed pupils and adults who were considered to be mathematically expert exploring a non-conventional representation. They observed that these individuals started to re-examine their previous perceptions in graphical and algebraic representations. The researchers raised the following question: 'The role of a representation of a mathematical idea seems to go beyond the mere goal of having a tool to handle that idea. Could it not be that by introducing a new representation, we are not only establishing a way to express an idea or a concept, but also re-examining and consequently learning "more" about those ideas and concepts" (p.84)? This research involves the use of qualitatively different representations, that is different representations which attribute different status to the same concept. The requirement of incorporating qualitatively different representation can be justified by the argument that using different representations which give the concepts the same status will lose the opportunity of provoking students to re-examine their perceptions.
In order to promote the forging of connections, two points suggested by previous researchers will be investigated in the present study. Firstly, Moschkovich (1992) puts forward one important requirement for enabling students to connect information from different representations - students must recognise that the same property can have a different status in different representations. She found out that the students used properties perceived with same status in different representations as being correspondent. Secondly, by analysing the students' perceptions of concepts (such as derivative, continuity, limits, integration) in a clinical interview, Ferrini-Mundy & Graham (1994) suggest that the ability to co-ordinate algebraic and graphical representations may differ substantially across concepts.
question arises: does the use of qualitatively different representations lead students towards the integration of information? If so how?
1.2 Representations of functions
When referring to 'school mathematics' in this work I mean 'traditional school mathematics' as taught in the majority of Brazilian secondary schools. A similar approach is taken by most North American high schools and Israeli secondary schools. In this section, I will survey the different potentialities and limitations of each representation of function used. The analysis of problems and advantages of each representation will have two foci: the first is the analysis of specific properties; and the second is the way students analyse the properties in each representation: pointwise, pictorial, variational or global. A discussion of the first type will be postponed to section 3 while the second focus will consider the ways students analyse functions represented by graphs and by equations.
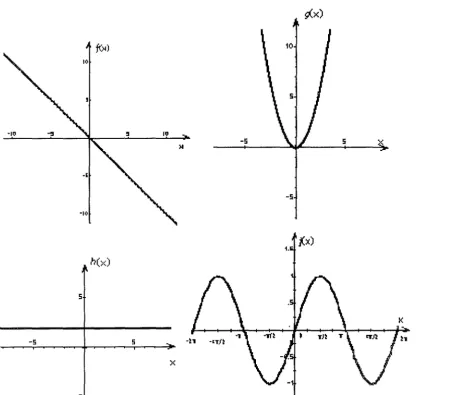
The concept of function has been expressed in several different representations, for example, as equations and graphs. School mathematics has maintained the same multiple representational approach to exploring function, using representations such as: equations, graphs, diagrams and tables. In order to start discussing the advantages and problems in using these representations, four examples of real functions will be shown using these four representations: (f) the function which associates a number with its opposite; (g) the function which associates a number with its square; (h) the function which associates a number with the fixed value 2; and (j) the function which associates the value of an angle with its projection on the y-axis in the trigonometric circle as shown in figure 1.1.
Figure 1.1
Projection of an angle a on the y-axis by the trigonometric circle
-1
A diagrammatic representation frequently used is illustrated in figure 1.2. x 4 3 2 0 -1 -2 -3
-4
3 2 0 -1 -2 -3Figure 1.2
t, g, hand
i
represented by diagrams4 3 2 0 -1 -2 -3 -4
hex)
9 8-
" 6 5 4 3 2---0 -1 -2 -3 -4 4 3
x
2
In tables the functions can be represented in the following way:
Figure 1.3
Tabular representation of the functions
t.
g. hand ;.x f(x) x
g(x)
x h(x)x
j(x)-4 4 -4
16
-4 2-n
0-3 3 -3 9 -3 2
-3n14
---.J212-2 2 -2 4 -2 2
-n/2
-1-1
1
-1
1
-1 2-n14
---.J2/20 0 0 0 0 2 0 0
1
-1
1
1
1 2nl4
--.J2/22 -2 2 4 2 2
n/2
13 -3 3 9 3 2
3nl4
--.J2124 -4 4
16
4 2n
0The Cartesian representations of the four functions are shown:
Figure 1.4
Cartesian representation of the functions
t,
g, handi
six)
-5 5
-5
i.
f.x)
5
K
-5 5
x
Finally, in the algebraic representation the functions take the following forms:
• f
(x)=-x for each x E R• g(x)=x2 for each x E R
• h(x)= 2 for each x E R
• j(x)=sin(x) for x E [-1t,1t); its domain can be extended to R by looking at any
number z as being z=x+2K1t where x E [-1t,1t) , and applying the function to x.
A comparison between the above examples shows that the algebraic representation brings precision. Students can know exactly the output value corresponding to any input. This precision is not easily obtained from graphs and diagrams, which only allow approximations. As for tables, the precision is obtained only for the inputs that appear in them, otherwise students will have to use interpolation. The Cartesian and the algebraic representations maintain the continuous character of the domain, while tables and diagrams can only represent discrete points. Summarising of the differences, Goldenberg (1987) reports that it is widely accepted that "Algebraic expressions specify the exact relationship, but give neither single examples nor a visual gestalt. Graphs provide a gestalt within the limits of the graph but leave precise details unclear. Tables provide examples of the mapping but do not specify its nature .... taken together, multiple representations should improve the fidelity of the whole message" (p.197). The claim is that the more representations a student has, the better s/he can perceive a concept. I will investigate the truth of this as the key to the advantages offered by multiple representations lies in connections between them and also in different perspectives each of them can provide.
In order to examine how useful each representation is, this research investigates how problems and advantages of one representation might be both dependent on the particular content analysed and related to the ways students analyse functions. The first dependence will be addressed in section 3 while reviewing the research on students' perceptions of the function properties. Nevertheless, an illustration can be provided by the argument of Goldenberg (1991) about the use of graphs and equations while analysing linear functions. He shows that it is harder to understand linear function in the graphic representation than in the algebraic one. Goldenberg (op.cit.) suggests that "when approaching functions through their graphs, it may make most sense to begin with graphs that have no convenient algebraic representation and with notions that we typically ignore until the calculus, including the nature of the domain, local maximum or minimum, rate of change, and continuous or abrupt change" (p.81).
representations. The algebraic representation is in general taken in school to be the essence of a function (Confrey & Smith, 1992). This representation is explored by its potential to calculate the exact value for any element of the domain. Therefore, the procedural view of function tends to be the starting point. This approach can lead students to adopt a pointwise view when analysing a function through its equation and a variational one can be adopted following an analysis of the role of the coefficients of each equation (Janvier, 1983). For example, the linear coefficient of the equation 'y=ax+b' plays the role of the derivative and its sign indicates whether a function is increasing or decreasing.
If on the one hand, the equations lead students to a pointwise view of function, on the other, visual representations particularly the Cartesian one are claimed by experts in mathematics and in science to facilitate the interpretation of information, even of information related to variation. In contrast to this claim, Clement (1985), Preece (1983), Monk (1992) and Goldenberg (1988) show that the use of Cartesian representation has the potential to obscure as well as to clarify the concepts. The research on graphical understanding has pointed out that students usually interpret function properties from a graph by reference to its shape as a static picture (Goldenberg, 1988) - pictorially. Another way students interpret a graph is pointwisely. They come to see a graph as a tool to localise points (Monk, 1992). Considering both viewpoints, two aspects will be discussed:
• the ways the students analyse graphs;
• the possibility of analysing graphs in a different way.
In both analyses pointwise, variational and pictorial views will all be discussed.
Clement (1985) points out that one of the problems students have in interpreting graphs is that they see a graph as a picture. In this case, the shape becomes one of the features with special status in a graph. In a review of the literature on functions and graphs, Leinhardt et al (1990) report two ways students interpret graphs: considering the lines as a legitimate part of a graph, or considering only discrete points in a graph. Nonetheless, they point out that for both ways in general "the students often maintain a strict focus on individual points whether or not they are connected with a line. In other words, although lines are accepted as a legitimate part of graphs, they seem to serve a connecting function rather than possessing a meaning in their own right" (p.34).
regions to interpret graphs, such as turning point and y-intercept. On looking only at special points and comparing different linear functions with the same coefficient 'b' at the equation 'y=ax+b', students can be led to connect the coefficient 'a' with the y-intercept as pointed out by Moschkovich (1992). Goldenberg (1991) points out that the gestalt way of interpreting graphs is a consequence of the way students learn about graphs.
Working with students' interpretation of graphs, Preece (1983) analysed students' perceptions of functions which require more than a simple reading of discrete points such as extreme values and derivative. She showed that 14-15 years-old students "have poor graph interpretation skills because they either do not understand the relevant concepts or have inadequate graph reading skills" (p.44-45). One of the errors she detected concerned the difficulties which students have in analysing function properties pointwisely. Preece (1983) detected that some students "were not able to answer questions about concepts which arose from the variables but which were not actually mentioned in the display, e.g. speed in distance-time graphs" (p.45). In my view, this can be interpreted as: the students who only interpret graphs pointwisely were not able to perceive function properties which do not have a 'special status' in the Cartesian graphs.
2 Methodological approach to investigating students' perceptions
This research will use the ways students describe functions as evidence of their understanding of the functions properties. 'Understanding' is at the cognitive level which is not observable, thus, this evidence cannot establish whether or not a concept is understood. To make clear that I am dealing with the observable world, these ways of describing the function properties will be called perceptions.
2.1 Two contrasting methodological approaches
The research on students' perceptions of function (Clement, 1985; Preece, 1983; Goldenberg, 1988; Mevarech & Kramarsky, 1993) has tended to concentrate on 'identifying' students' difficulties in developing the concept. The researchers try to detect common difficulties calling them misconceptions. Nesher (1987) defined misconception as "a line of thinking that causes a series of errors all resulting from an incorrect underlying premise rather than sporadic unconnected and non systematic errors" (p.35). Although in its origins the term has been considered to refer to "intelligent constructions based on what is more often incomplete than incorrect knowledge" (Resnick et ai, 1989: 26), researchers into misconception have tended to concentrate on the negative aspects of the conceptions. Moschkovich (1992) discusses the analyses "of students' conceptions describing errors and misconceptions have focused largely on the "mis-" aspect of student ideas and have not considered conceptions that may be useful, applicable in some context, or productive for advancement" (p.129). Agreeing with her viewpoint, I argue that conceptions should most probably be analysed from a consideration of their potential for improvement, their origins, limitations and usefulness.
Moschkovich (1993) used the approach of 'alternative interpretations' which considers the positive and negative aspects of students' perceptions. According to her, the term "alternative interpretations" shows a certain respect for students' ideas by considering that there are alternative ways to conceive of a domain, although "there is a mathematically accepted way to think about the subject matter" (p.i). She points out that "misconception is no longer an adequate concept for referring to some of the conceptions that students generate" (p.1). In her research on students' use of X-intercept 1, she shows how the 'alternative interpretations' approach highlights the shortcomings of the 'misconceptions' approach.
As an example of this alternative perspective in her study of students' perceptions while connecting algebraic and Cartesian representations of slope, Moschkovich (1992) points out that the introduction of algebraic and Cartesian representations of linear functions with slope equal to 1 may obscure the difference between x-intercept and the independent coefficient2. She also claims that this introduction can be the origin of this connection. Nonetheless, Moschkovich (1992, 1993) showed that two of the students used x-intercept for slope, which was considered a "misconception", as a bridge to improve their perceptions of derivative. Moschkovich (1993) showed that the students refined the use of x-intercept in the following ways: (a) "The use of the x-intercept for b when" a=1 "was refined from using the x-coordinate of the x-intercept ... as the b in the equation, to using the opposite of the x-coordinate of the x-intercept ... as the b in the equation"; (b) "the context in which the use of the intercept is applicable was specified"; (c) "the x-intercept was explored as a reflection of the slope" (p.15). This shows that alternative interpretations can be useful in the process of developing a concept. It is important to understand this process in the construction of the concept as a transitional conception which has its usefulness, limitations, origin, and potential to bridge to more competent concepts. Therefore, in the 'alternative interpretation' approach listening to students is fundamental.
Following a similar approach, I will use 'associations' to describe what Moschkovich calls 'alternative interpretations'. The term association also includes students' perceptions of properties which merge with a different property. For instance, students can identify extreme values in parabolas and sines (graphs with turning points) but not in graphs of exponential functions (graphs without turning points). Thus, I will say that students' perceptions of extreme values are associated with turning points. Nonetheless, I do not mean that the students perceive extreme values and turning points as being the same property.
2.2 Obstacles
In developing an association students can follow two paths: either they recognise its limitations and improve their perceptions by revising it; or these associations become resistant to change and serve to limit the students' perceptions. Thus, associations can be transformed into knowledge-obstacles. As Artigue (1992) argues, "As far as some piece of knowledge has turned out to be successful in a wide range of situations, it becomes resistant to change, even if it must be at least strongly modified in order to cope effectively with new problems. This theory