ABSTRACT
ZHONG, QIXIN. Cooling Effects on the Functionality and Microstructure of Processed Cheese (under the direction of Christopher R. Daubert and Orlin D. Velev)
Cooling is the final stage of process cheese manufacturing, and a slower cooling process generates a stronger structure requiring a larger force to shear cheese loaves while yielding a poor melt quality. To interpret cooling mechanisms, a model rennet casein system was formulated to include emulsifying salts and rennet casein powder, as used in processed cheese analogs. At pH 5.8 and 6.5, protein networks were
discontinuous, and no cooling trends on rheological data were observed when cooled from 80 to 5 °C at 0.025, 0.05, 0.1, and 0.5 °C/min. At pH 7.2 and 12, networks were formed, and slower cooling delivered a firmer gel.
The rennet casein network was described as cross-linked flocs, and the
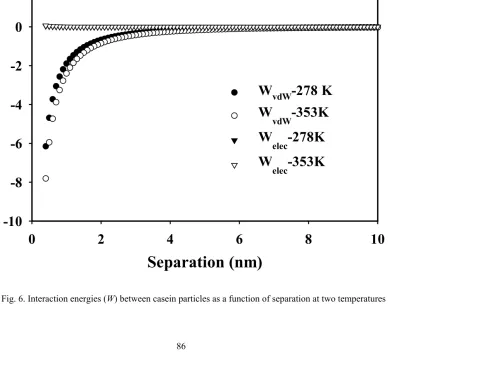
aggregation of two particles into a doublet was the first stage of floc formation. At lower pHs, the overall force between protein particles was more attractive, the doublet
formation time was short, and therefore the number of doublets formed was not affected by cooling rates. Accordingly, floc numbers and rheology did not show a trend with cooling effects at the lower pHs. At pH 7.2 and above, the doublet formation time was comparable to the time for temperature changes during cooling because of stronger repulsive forces. As a result, doublet formation was influenced by cooling rate,
of smaller flocs were created, delivering a stronger gel at slower cooling rates. More flocs at higher protein concentrations and slower cooling rates simplified the network
formation.
COOLING EFFECTS ON THE FUNCTIONALITY AND
MICROSTRUCTURE OF PROCESSED CHEESE
by
QIXIN ZHONG
A dissertation submitted to the Graduate Faculty of North Carolina State University
in partial fulfillment of the requirements for the Degree of
Doctor of Philosophy
DEPARTMENT OF FOOD SCIENCE and
DEPARTMENT OF CHEMICAL ENGINEERING
Raleigh 2003
APPROVED BY:
Dr. Christopher R. Daubert Dr. Orlin D. Velev
Chair of Advisory Committee Co-chair of Advisory Committee
DEDICATION
BIOGRAPHY
Qixin Zhong was born on April 6, 1972 in Xiangdong – a small town west of the Fujian Province of China, where his parents - Binghua Zhong and Xiudi Ye – and siblings – Yuantang, Qirui, Qihong, and Ximei – still reside. He was blessed to have his education supported by his family at a time when the Chinese economy was in its infancy. Being a top student throughout his elementary, middle, and high school, Qixin sailed into college, an achievement he never considered during his childhood. He then adapted himself into the world he could only watch on movies and read from books. He was awarded the honor of Excellent Undergraduate when he received his Bachelor of Engineering degree in Animal Nutrition and Feed Processing in July 1993 from Wuhan Food Industry College.
Qixin started his professional career as an Engineer at a national research institute in China, the Feed Research Institute of Chinese Academy of Agricultural Science. He was a productive researcher doing projects on process and plant design, scale-up, process line installation and start-up, process optimization, machine design, and feasibility studies. He was awarded the excellent employee of the Feed Research Institute, accredited to his contributions, including authoring a proposal awarded with a government grant of $250,000 in 1999.
and Kenneth R. Swartzel. In December 1999, Qixin married Xin Meng. Together, they gave birth to a baby girl, Michelle, on June 21, 2003. After completing his Master’s program, Qixin joined the Food Rheology Laboratory at North Carolina State University to pursue a Ph.D. degree in Food Science and was later admitted to a co-major in
ACKNOWLEDGEMENTS
My wife, Xin Meng, deserves to be on the top of my thank-you list. Her support and sacrifice has always been my greenhouse for growing and achieving my goals. Without her love, I would not have been able to complete this research project and finish so many challenging courses. Your consolation is critical for releasing my stresses, and your “joking” about my insomnia before exams will be an unforgettable memory from this experience. She has been an essential part of my life, and we were blessed to have Michelle and share the incredible experience of parenthood.
Thanks are then dedicated to my advisor, Dr. Christopher R. Daubert, for introducing me to the field of rheology and giving me the opportunity to work on an excellent
research project. His patience on my research progress and encouragement of my pursuit of a chemical engineering degree was critical to my Ph.D. education. As a mentor, he gave me the freedom to execute this project and was always available for my questions and needs. As a friend, he always reminded me of the importance of a good family life. His support during my job search was also critical to my career.
Without the help from Dr. Saad A. Khan, my Ph.D. education would have been less productive. His encouragement of my participation in the research proposition course and assistance on the paperwork cleared the obstacles for my degree in Chemical
I was fortunate to have Dr. Orlin D. Velev serve as my co-advisor. His research ideas and expertise in colloids was an excellent source for my academic career, and his
scientific insight contributed significantly to this project.
The participation of Dr. Brian E. Farkas was also important for this project. He was always ready to help me and has always been a nice friend during my education at NC State University. The Thanksgiving dinners at his home were always wonderful.
Support from my family has always been with me through my life. My in-laws have been supportive for my goals. My sister-in-law, Jun Meng, and her husband, Yong Li, have been a tremendous system for our needs, especially those for Michelle.
Last, but not least, my appreciation goes to the Southeast Dairy Food Research Center for funding this project. Special thanks are given to Dr. Van Den Truong, Penny Amato-Harwell, Paige Luck, and Heather Stewart for technical support. Rheologists Heather Hudson, Jeff Resch, Noel Pollen, Tom Glenn, Jon Firebaugh, and Junhua Zhang were always helpful, and my friends in the Food Engineering group, Stephen Sylvia, Koray Palazoglu, Andriana Vais, Pablo Coronel, Dorin Boldor, Brian Lloyd, Cristina Sabliov, Jon Bell, and Ediz Batmaz gave me a good time during my stay in Schaub Hall.
TABLE OF CONTENTS
List of Figures ………xiii
List of Tables ………xvii
Chapter I. Introduction ………1
Casein and casein micelle structure ………3
Stability of casein micelles ………4
Cheese making processes and characteristics of cheese matrix …………5
Processed cheese products and manufacture ………7
Variables in processed cheese functionality and microstructure………9
Rheological methods in cheese science ………12
Scope of work ………16
References ………20
Chapter II. Cooling Effects on Processed cheese Functionality ………24
Abstract ………25
Introduction ………26
Heat transfer model and cooling rate expression ………28
Materials and methods ………34
Materials ………34
Small amplitude rheology ………34
Slice-ability and melt-ability ………36
Results and discussion ………38
Rheological data ………38
Heat transfer model verification ………39
Cooling rate estimation ………40
Slice-ability ………41
Melt-ability ………42
Implications to cheese manufacturers ………43
Conclusions ………44
References ………56
Chapter III. Cooling Effects on a Model Rennet Casein System: Part I. Rheological Characterization ………60
Abstract ………61
Introduction ………62
Fractal theory and fractal dimension determination ………64
Materials and methods ………68
Materials ………68
Gel sample preparation ………68
Rheological measurements ………68
Results and discussion ………69
Fractal dimension of casein flocs ………70
Fractal dimensions as determined by colloidal interactions………70
Gelation temperature as affected by cooling rates ………74
Cooling rate effects versus aging effects ………75
Conclusions ………76
References ………89
Chapter IV. Cooling Effects on a Model Rennet Casein System: Part II. Permeability and Microscopy ………97
Abstract ………98
Introduction ………99
Materials and methods ………101
Materials and sample preparation ………101
Microstructure observation ………102
Image analysis ………102
Permeability tests ………102
Results and discussion ………106
Casein floc size ………106
Permeability coefficients ………107
Physical origin of cooling effects ………108
Cooling effects versus aging effects ………110
References ………123
Chapter V. Kinetics of Rennet Casein Gelation during Cooling at Different Rates ………127
Abstract ………128
Introduction ………129
Theory and model development ………130
Materials and methods ………135
Materials ………135
Sample preparation ………135
Rheological data acquisition ………135
Results and discussion ………136
Rheological data ………136
Data range for analysis ………136
Determination of kinetic parameters ………137
Correlation of kinetic parameters with structure development………138
Kinetics during aging ………140
Conclusions ………142
References ………152
Abstract ………157
Introduction ………158
Materials and methods ………162
Materials ………162
Gel sample preparation ………162
Rheological measurements ………162
Microstructure observation ………163
Image analysis ………164
Water-holding capacity ………164
Results and discussion ………164
Rheological data ………164
Microscopy images ………165
Water-holding capacity ………165
Protein charges as affected by pH ………166
Colloidal interactions at various pH values ………166
Physical explanation of pH effects ………168
Analogy between salt and pH effects ………170
Conclusions ………172
References ………189
Abstract ………197
Introduction ………198
Materials and methods ………200
Materials ………200
Gel sample preparation ………200
Rheological measurements ………201
Confocal laser scanning microscopy ………202
Image analysis ………203
Results and discussion ………203
Rheological data at pH 5.8 and 6.5 ………203
Rheological data at pH 7.2 and 12 ………204
Microscopy data ………204
Colloidal interactions and fractal dimensions affected by pH ………205
Fractal dimension determined from scaling theory ………206
Fuchs stability ratio and the significance of cooling rate and pH …………207
Cooling mechanisms on processed cheese ………211
Conclusions ………212
References ………228
Appendix ………232
LIST OF FIGURES
Chapter I. Introduction
Fig. 1. Submicelle casein model ………18
Fig. 2. A schematic illustration of the cheese matrix ………19
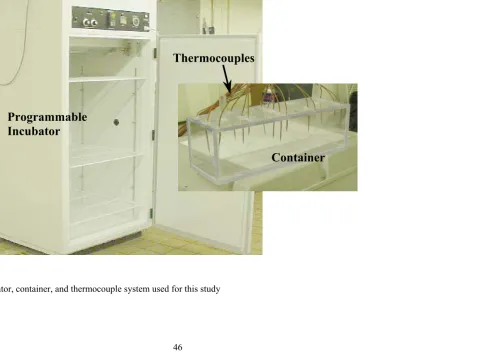
Chapter II. Cooling Effects on Processed cheese Functionality Fig. 1. The incubator, container, and thermocouple system ………46
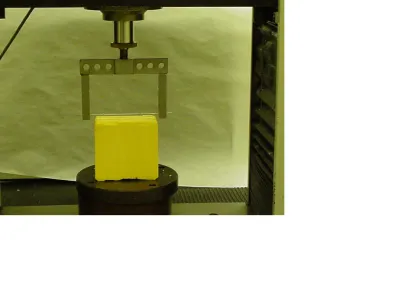
Fig. 2. The wire-cutting setup ………47
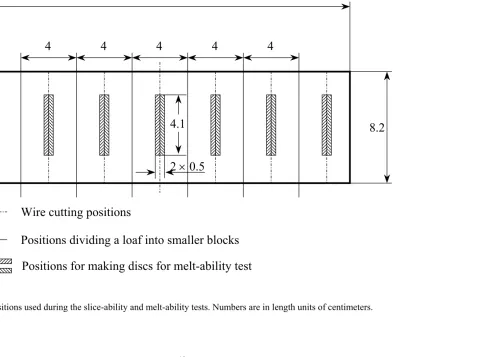
Fig. 3. Loaf positions for slice-ability and melt-ability tests ………48
Fig. 4. Storage moduli of processed cheese during cooling ………49
Fig. 5. Specific heat of processed cheese ………50
Fig. 6a. Model verification for free-convection ………51
Fig. 6b. Model verification for forced-convection ………52
Fig. 7. Wire-cutting data for free convection treatment ………53
Fig. 8. Wire-cutting data for forced convection treatment ………54
Fig. 9. Schreiber scores at different loaf positions ………55
Chapter III. Cooling Effects on a Model Rennet Casein System: Part I. Rheological Characterization Fig. 1. Formation of rennet casein gels ………79
Fig. 3a. Storage moduli of 18% rennet casein gels ………81
Fig. 3b. Storage moduli of 25% rennet casein gels ………82
Fig. 4a. Strain sweep of 18% rennet casein gels ………83
Fig. 4b. Strain sweep of 25% rennet casein gels ………84
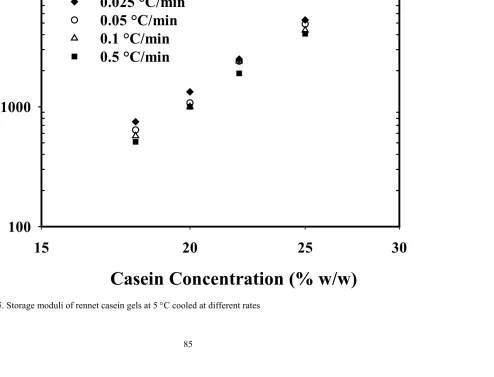
Fig. 5. Summary of storage moduli of rennet casein gels ………85
Fig. 6. Interaction energies between casein particles ………86
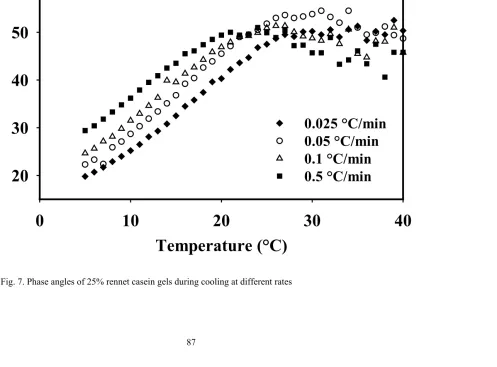
Fig. 7. Phase angles of 25% rennet casein gels during cooling………87
Fig. 8. Cooling effects versus aging effects ………88
Chapter IV. Cooling Effects on a Model Rennet Casein System: Part II. Permeability and Microscopy Fig. 1. Conventional permeability test setup ………115
Fig. 2. Modified permeability test setup ………116
Fig. 3a. Microstructure of 18% rennet casein gels cooled at 0.5 °C/min ………117
Fig. 3b. Microstructure of 18% rennet casein gels cooled at 0.025 °C/min ………118
Fig. 4a. Microstructure of 18% rennet casein gels cooled at 0.5 °C/min followed by incubation, high magnification ………119
Fig. 4b. Microstructure of 18% rennet casein gels cooled at 0.5 °C/min followed by incubation, low magnification ………120
at 0.5 °C/min, low magnification ………121
Fig. 5b. Microstructure of 18% rennet casein gels cooled at 0.025 °C/min, low magnification ………122
Chapter V. Kinetics of Rennet Casein Gelation during Cooling at Different Rates Fig. 1. Complex moduli of 18% rennet casein gels ………145
Fig. 2. Complex moduli of 25% rennet casein gels ………146
Fig. 3. Phase angles of 25% rennet casein gels ………147
Fig. 4. An example of data range selection ………148
Fig. 5. Reaction order determination ………149
Fig. 6. Network forming energy during rennet casein gelation ………150
Fig. 7. Aging kinetics ………151
Chapter VI. Characterization of Rennet Casein Gelation as a Function of pH Fig. 1. Storage moduli as a function of pH ………176
Fig. 2. Mechanical spectra of gels at pH 5.8 and 7.2 ………177
Fig. 3. Mechanical spectra of gels at pH 6.5 and 12 ………178
Fig. 4a. Microstructure of gels at pH 5.8 ………179
Fig. 4b. Microstructure of gels at pH 6.5 ………180
Fig. 4c. Microstructure of gels at pH 7.2 ………181
Fig. 4d. Microstructure of gels at pH 12 ………182
Fig. 6. Casein charge as a function of pH ………184
Fig. 7. Casein interactions at pH 5.8 and 12 ………185
Fig. 8. An illustration of a rennet casein network ………186
Fig. 9. The pH effects on protein particles and flocs ………187
Fig. 10. Phase angles of rennet casein gels at different pHs ………188
Chapter VII. Thermal Rate Effects on Rennet Casein Gels at Different pH Conditions Fig. 1. Storage moduli of processed cheese ………216
Fig. 2. Storage moduli of 18% casein at pH 5.8 ………217
Fig. 3. Storage moduli of 15% casein at pH 6.5 ………218
Fig. 4. Mechanical spectra of 18% casein at pH 5.8 and 6.5 ………219
Fig. 5. Mechanical spectra of casein gels at pH 7.2 and 12 ………220
Fig. 6. Storage moduli of 15% casein at pH 12 ………221
Fig. 7a. Microstructure of 18% casein gels at pH 5.8 ………222
Fig. 7b. Microstructure of 18% casein gels at pH 6.5 ………223
Fig. 7c. Microstructure of 15% casein gels at pH 7.2 ………224
Fig. 7d. Microstructure of 15% casein gels at pH 12 ………225
Fig. 8. Microstructure of gels at pH 5.8, high magnification ………226
LIST OF TABLES
Chapter II. Cooling Effects on Processed cheese Functionality
Table 1. Average cooling rates within cheese loaves ………45
Chapter III. Cooling Effects on a Model Rennet Casein System: Part I. Rheological Characterization
Table 1. Formulations for rennet casein gels ………77 Table 2. Fractal dimension of rennet casein flocs ………78
Chapter IV. Cooling Effects on a Model Rennet Casein System: Part II. Permeability and Microscopy
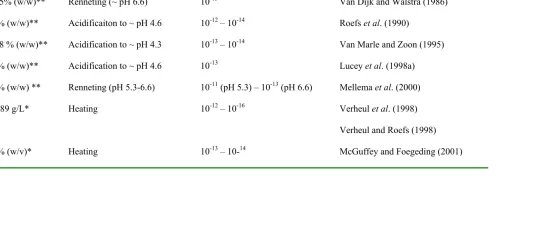
Table 1. Floc size and permeability coefficient ………113 Table 2. A survey of literature permeability coefficients ………114
Chapter V. Kinetics of Rennet Casein Gelation during Cooling at Different Rates
Table 1. Formulae for rennet casein gels ………143
Table 2. Kinetic parameters for rennet casein gelation ………144
Chapter VI. Characterization of Rennet Casein Gelation as a Function of pH Table 1. Summary of casein primary structure ………174
Chapter VII. Thermal Rate Effects on Rennet Casein Gels at Different pH Conditions
Table 1. Formulae for rennet casein gels ………213
Table 2A. Floc size at pH 5.8 and 6.5 ………214
Chapter I
Milk is the starting material in cheese-making, and its chemical and physical changes during processing determine the rheological properties and microstructural characteristics of cheese products. By chemical composition, milk has 86.6% water, 4.1% fat, 3.6% proteins, 5.0% lactose, and 0.7% ash. Caseins, including αs1-, αs2-, β-, and
κ-caseins, consist of 80% of the total protein content and are the primary components of the protein matrix in cheese. Whey proteins, including β-lactoglobulins and α-lactalbumins,
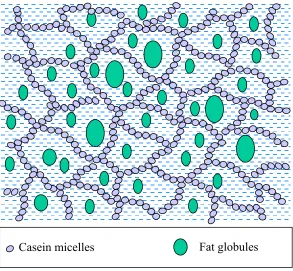
are the remaining 20% of the protein fraction and are removed during the dehydration process of cheese-making (Swaisgood, 1996). In fluid milk, milk fat is in the globular form, and therefore milk is technically considered an oil-in-water emulsion. However, milk is not a simple dispersion system, because caseins do not exist as single
macromolecules but rather exist in the form of micelles (Dickinson, 1992). During
cheese-making, the casein micelles aggregate upon acidification or enzymatic hydrolysis, forming a continuous network in which milk fat globules are included (Fox et al., 2000).
The following introductory sections describe the structure of casein micelles, followed by discussion of the mechanisms regulating micelle stability. Principles of natural and processed cheese manufacture will be reviewed, as well as the variables affecting processed cheese functionality. Rheological methods relevant to cheese science will also be briefly recapped. These sections serve as the fundamentals for this research project.
Caseins and casein micelle structure
The primary and tertiary structures of caseins enable unique interactions with calcium ions. Calcium-sensitive caseins, αs1-, αs2-, and β-caseins, have extremely low
solubility when Ca2+ is bound to casein clusters. The κ-caseins are calcium-insensitive and are essential to the formation of casein micelle structure. The hydrophobic end of
κ-casein interacts with calcium-sensitive κ-caseins to form micelles, and the hydrophilic end protrudes into the milk serum. Because of the polar portion of κ-caseins, casein micelles
have a “hairy” layer on the outer surface maintaining the stability in milk. The unique amino acid residues distinguishing two portions of κ-caseins can be recognized by
chymosin, an enzyme existing in calf rennet, allowing the hydrolysis and thus casein micelle coagulation during cheese making. The portion of κ-casein cleaved is called the
glycomacropeptide, and the micelle without the “hairy” layer is called paracasein (Swaisgood, 1996).
The details of the micellar casein internal structure still remain unclear (Creamer and MacGibbon, 1996; Horne, 1998; Walstra, 1999). Different casein micelle models have been proposed to explain physiochemical properties, and the subunit model is widely accepted (Swaisgood, 1996). In this model, a casein micelle is composed of a group of submicelles (Fig. 1), linked by hydrophobic interactions and colloidal calcium phosphate bridges. Casein submicelles are approximately spherical with a diameter of 15-20 nm and are composed of individual molecules of αs1-, αs2-, β-, and κ-caseins.
domain of κ-casein, which cannot interact with calcium phosphate, occupies a sufficient
amount of micelle surface area, the micelle growth stops. Therefore, a large number of submicelles rich in κ-casein yield a smaller casein micelle (Swaisgood, 1996).
Stability of casein micelles
The “hairy” κ-casein layer exists on the surface of casein micelles (Fig. 1). When
two casein micelles approach each other, a dramatic increase of osmotic pressure is generated in the region where the “hairy” layers overlap (steric interaction). Casein micelles are thus repelled from each other, and the aggregation of casein micelles is prevented (Tuinier and de Kruif, 2002).
Under normal conditions, casein micelles are negatively charged (Dalgleish, 1987; Dickinson, 1992). When milk pH is lowered to the isoelectric point of casein micelles (pI = 4.6), the net charge of the casein micelle is neutralized, and the κ-casein
layer collapses. The steric interaction is no longer effective, and casein micelles
coagulate, as in the acidification process during yogurt production. The other approach to eliminate the steric interaction is to cleave the “hairy” layer via enzymatic hydrolysis. The renneting process in cheese production utilizes chymosin from calf rennet to cleave the connection between hydrophobic and hydrophilic portions of κ-casein (de Kruif,
1999; Tuinier and de Kruif, 2002).
than an idealized model because of the polydispersity and heterogeneity of the
aggregating particles (Dickinson, 1992). In addition, micellar rearrangements within the network continue to occur after gelation, further complicating the system (Mellema et al., 2000, 2002).
Cheese making processes and characteristics of cheese matrix
Cheese making is basically a dehydration process whereby the fat and casein are concentrated, depending on the cheese variety. Basic steps during cheese manufacturing include: acidification, coagulation, dehydration (cutting, cooking, stirring, pressing, salting), shaping (molding, pressing), and ripening. Besides milk composition, the amount of water retained in a cheese product is regulated by the extent and combination of the aforementioned steps. Moisture content, as well as salt content and microflora, also regulates biochemical changes, e.g. proteolysis, during the ripening period (Holsinger et al., 1995; Fox et al., 2000).
Acidification. The acidification process is defined as the progressive development of acidity throughout the manufacturing stage. Milk pH is lowered by a starter culture (lactic acid bacteria) through the hydrolysis of lactose into lactic acid. Acid production is key to the production of good quality cheeses because it affects coagulant activity, curd strength and syneresis, pH, and the growth of non-starter microorganisms (Holsinger et al., 1995; Fox et al., 2000).
heat. Curds coagulated by rennet have better syneresis properties, making a low moisture curd without hardening. The coagulant activity and the amount of coagulant retained in the curd influence proteolysis, essential for cheese ripening (Holsinger et al., 1995; Fox et al., 2000).
Dehydration (post-coagulation changes). Post-coagulation changes determine the quality of a finished cheese. Rennet-coagulated curd is very stable when quiescent but quickly synereses when cut, expelling the whey. The rate and extent of syneresis is controlled by milk composition, especially calcium ion concentration, pH of the whey, cooking temperature, rate at which the curd is stirred with the whey, and time. At this point, differentiation among cheese varieties begins, although the amount and type of starter culture, coagulant, and cheese milk composition are also significant for a desired cheese type (Holsinger et al., 1995; Fox et al., 2000).
Salting. Although salt affects syneresis, it does not control the moisture content of a cheese product, because the cheese type essentially determines the amount of water retained. Salt plays a critical role during ripening, where it controls water activity, microbial growth and activity, enzyme activity, and physicochemical changes in the cheese proteins, thereby influencing the texture of a cheese product (Holsinger et al., 1995; Fox et al., 2000).
Ripening. Many biochemical changes occur in cheese during ripening, including proteolysis, lipolysis, and glycolysis. Proteolysis, biochemical changes caused by
storage (ripening) usually results in a softer cheese (Ak and Gunasekaran, 1996; Rosenberg et al., 1995). Ripening is thus important for obtaining desired flavor and texture.
Cheese matrix. Natural cheese from renneting is essentially a calcium phosphate-paracasein matrix (Fig. 2). The integrity of the matrix is maintained by various
interactions between paracaseins. Fat globules, moisture and dissolved substances, and enzymes (e.g. residual rennet and proteinases from starter and nonstarter
microorganisms) exist in the pores of the matrix. A dynamic equilibrium exists for the concentration of calcium and phosphate between the paracasein matrix and cheese serum. This equilibrium is influenced by pH and other factors, such as the concentration of sodium ions in the serum (Holsinger et al., 1995; Fox et al., 2000). Controlling these physicochemical conditions during cheese manufacturing is essential for a good quality product.
Processed cheese products and manufacture
(1) greater variety of products to meet different functional properties (e.g. slice-ability, melt-ability, and flow-ability), resulting from adjustable formulae, processing conditions, and packaging formats;
(2) lower cost because of the addition of cheaper ingredients; and
(3) elongated shelf-life due to minor changes during storage (Fox et al., 2000; Carić and Kaláb, 1993).
The production of processed cheese products starts from the selection of natural cheeses, and a mix of various natural cheeses are usually blended to achieve desired flavor and texture. As mentioned previously, natural cheeses vary in flavor and texture when subjected to different ripening time, and the quality of processed cheese can thus be manipulated by selecting different proportions of young and mature cheeses. Young cheeses have bland tastes and are used at higher amounts for products requiring a firm texture and good slice-ability. On the other hand, mature cheeses have sharp flavors, good flow and melt behavior. Selected natural cheeses are shredded prior to addition to the cheese blend to promote contact with other ingredients during processing (Carić and Kaláb, 1993).
Among the added ingredients in a cheese blend, emulsifying salts, such as sodium citrates and various types of sodium phosphates, are of critical importance for processed cheese products. Emulsifying salts sequester calcium ions in the paracasein,
concentrations and types of emulsifying salts, pH, buffering capacity, and processing conditions (Fox et al., 2000).
The blend is then processed at an elevated temperature by direct or indirect steam with constant agitation. Processed cheese types dictate the temperature and duration of processing. For example, blends for processed cheese blocks are agitated at 80 to 85 °C
for 4 to 8 minutes, while blends for making slices are processed at 78 to 85 °C for 4 to 6
minutes (Carić and Kaláb, 1993). A proper combination of processing time and degree of agitation is necessary for a good quality processed cheese (Carić and Kaláb, 1993; Glenn, 2002).
After processing, the molten blend is packaged according to product
specifications, blocks and slices are the two most common products. Packed products are then cooled at different schedules for different applications. For example, processed cheese spreads are cooled as fast as possible, while processed cheese blocks are cooled much slower to harden the product (Carić and Kaláb, 1993). During cooling, fat
crystallizes, and casein forms a continuous network. The new matrix formed during cooling is thus influenced by the solidification (crystallization) of fat, protein-protein interactions, and the interactions between protein and fat (Fox, et al., 2000).
Factors influencing the functionality and microstructure of processed cheese Functional properties of cheese may be defined as “those rheological,
consumption and that therefore contribute to the quality and organoleptic attributes of the food in which cheese is included (Fox et al., 2000).” Processed cheeses is manufactured by blending ingredients and controlling processing conditions to improve the functional properties of natural cheeses, including melt-ability, flow-ability, oiling-off during cooking, flow-resistance, slice-ability, chewiness, apparent viscosity, and stretch-ability (Fox et al., 2000).
Processed cheese functionality and microstructure are determined by factors derived from both formula and production conditions, including casein content, state of casein emulsification, fat, moisture, emulsifying salts, and physicochemical state of the components (Shimp, 1985; Fox et al., 2000).
Casein content. Even though the absolute amount of caseins in a natural cheese is determined by the volume of milk used, the concentration of aggregated caseins is
determined by the cheese-making process. For example, at a higher casein concentration, more linkages are created in a cheese matrix, strengthening the network.
on emulsification; and extensive heating tends to damage proteins, lowering emulsifying abilities (Shimp, 1985; Fox et al., 2000).
Fat. Size distribution of fat globules and the physical state of fat affects the processed cheese texture and functionality. When the surface area of fat globules is so large that proteins are insufficient to cover the oil/water interface, the protein/fat ratio is important for the cheese matrix strength and melt-ability (Shimp, 1985; Fox et al., 2000).
Moisture. The moisture content of a cheese product is mostly determined by the desired cheese type and achieved during the dehydration process. Generally, a product of lower moisture content is firmer due to a relatively higher solids concentration. On the other hand, moisture content influences the microbial activity during ripening of a product, thereby affecting the cheese functionality (Shimp, 1985; Fox et al., 2000).
Physicochemical state of the components. The physicochemical state of fat and paracasein also impacts the functionality of processed cheese. The degree of hydrolysis during renneting affects the paracasein matrix formation. The structure of the matrix also changes during ripening, including micelle rearrangement and proteolysis. Besides the state of casein matrix, the level of fat coalescence and solid fat parameters (proportions of fat crystals at different polymorphs) are important parameters in cheese texture and melting properties. Fat globule size influences the firmness of a final product and the amount of “free-oil” when cooked. Increasing the concentration of emulsifying salts and processing temperature decreases fat globule sizes and increases the firmness (Shimp, 1985; Fox et al., 2000). An elongated processing time for a given formula also creates a firmer, more elastic, and less flow-able product (Glenn, 2002).
Rheological methods in cheese science
Rheological measurements for cheese may be classified into three main types: empirical tests, small-amplitude oscillatory tests, and large-amplitude tests.
TPA is a series of compression tests, and the results are used to quantitatively describe sensory parameters such as hardness and chewiness (Steffe, 1996).
Large-amplitude tests. These tests allow the determination of a stress required to fracture a cheese at a given strain rate. The test conditions may be designed to simulate treatment conditions of a specific application, such as mastication or size-reduction processes (Fox et al., 2000). Torsion and compression tests are frequently used large strain tests to evaluate textures of cheese due to a correlation between instrumental and sensory measurements (Benedito et al., 2001; Hort and Grys, 2000).
Small-amplitude oscillatory tests. Cheese is a semi-solid product possessing both viscous and elastic properties. Small-amplitude oscillatory tests allow the quantitative determination of viscoelastic characteristics (Fox et al., 2000) and can give consistent results with other approaches such as TPA in predicting the sensory properties of cheese (Drake et al., 1999). By using a small deformation test, valuable information during a process can be acquired without disturbing sample structure, such as gel point
identification, protein denaturation, starch gelatinization, and structure development (Steffe, 1996).
behavior are called Newtonian fluids. When energy is applied to an elastic solid, the energy is completely stored. In other words, the material will completely recover after deformation. As for viscous liquids, the energy is completely dissipated as heat, and the material will not recover. Any material behaving between these extremes is called a viscoelastic material. When energy is applied, a portion of the energy is stored and can be recovered, while the remaining energy dissipates as heat and can no longer be recovered (Ferry, 1980).
When using a strain-controlled rheometer for a dynamic test, the material is subjected to a sinusoidally varying strain, and the resulting stress is measured (Ferry, 1980; Steffe, 1996). Assumptions involved in a dynamic test include a constant stress or strain throughout the sample, no-slip of sample, sample homogeneity, and measurements are performed in the linear viscoelastic regime.
When introducing a sinusoidal strain (Eq.1), the strain rate can be written as Eq.2,
( )
t γosin( )
ωtγ = (1)
( )
t coso ω
ωγ
γ&= (2)
where γ is the strain at a corresponding time (t), γo is the magnitude of the sinusoidal
strain, ω is the oscillatory frequency, and γ& is the strain rate. Within a linear viscoelastic
region, the stress (σ) can be correlated to the shear modulus (G = σ ⁄ γ) and shear rate by
(
t 't) ( )
't dt' G ) t ( t -∫
∞ − = γσ & (3)
where t' is the past time and t is the current time.
( )
[
(
)
]
( ) ( )
( )
( )
( )
( )
( )
[
G'sin t G"cos t]
t cos ds s s G t sin ds s s G ds s t cos s G ) t ( o o o o cos sin 0 0 0 ω ω γ ω ω ω γ ω ω ω γ ω γ ω σ + = + = − =
∫
∫
∫
∞ ∞ ∞ (4)where G′ is the storage (or elastic) modulus, and G″ is the loss (or viscous) modulus.
In a dynamic test, stress is out of phase with strain for a viscoelastic material. Defining a phase angle (δ) as the parameter related to the energy lost per cycle divided by
the energy stored per cycle, stress can also be written in the sinusoidal format as:
( )
σ(
ω δ)
σ t = osin t+ (5)
The expansion of the above equation gives
( )
t σocosδ sin( )
ωt σo sinδcos( )
ωtσ = + (6)
Comparing Eq. (6) and (4), the following equations are derived:
( ) ( )
ω(
σ γ)
δω
ω) G s sin s ds / cos
( '
G = ∞
∫
= o o0
(7)
( ) ( )
ω(
σ γ)
δω
ω) G s cos s ds / sin
( "
G =
∫
= o o∞
0
(8)
In the vector form, the G', G", and δ are intercorrelated, and the complex modulus (G*)
can be defined as in Eq. 10.
' G / " G
tanδ = (9)
" G i ' G *
G = + (10)
2 2 o
o
G' G" *
G = = +
γ σ
(11)
Scope of work
The functionality and microstructure of processed cheese are affected by formulation and processing conditions. Cooling is an important process during
production because the structure formed during cooling determines the quality of a final product. The implications of cooling effects on cheese functional properties and quality were evaluated.
Structure development during cooling at different fixed rates were monitored with smaller amplitude oscillatory tests. However, cooling rates within cheese loaves differ spatially, and a heat transfer model was needed to predict temperature histories at different loaf locations. The model estimated the average cooling rates in cheese discs during melt-ability tests and at sliced planes for slice-ability tests.
To accomplish this objective, a model rennet casein system was formulated based on the work of Dees (2002) and Bowland and Foegeding (1999, 2001). Emulsifying salts and rennet casein powder were ingredients selected to simulate a processed cheese. Because pH is a dominant factor in casein gel rheology and microstructure (Lucey et al., 1998), cooling effects were investigated on the model system within and beyond the processed cheese pH range for a comprehensive study. Small amplitude rheological tests studied the casein gelation at different cooling rates. Furthermore, confocal laser
scanning microscopy observed the microstructure of the casein network as a function of cooling rates. Also, permeability tests differentiated the protein gel compactness after cooling at different rates.
Fig. 1. Submicelle casein model. Filled smaller circles stand for calcium phosphate (Ca9(PO4)6) clusters (redrawn from http://www.foodsci.uoguelph.ca/deicon/casein.html).
Casein micelle
Casein submicelle
Hydrophobic core
GMP “hairy” layer
References
Ak, M.M. and Gunasekaran, S. 1996. Dynamic reological properties of Mozzarella cheese during refrigerated storage. Journal of Food Science. 61(3): 566-568, 584. Benedito, J., Gonzalez, R., Rossello, C., and Mulet, A. 2000. Instrumental and
expert assessment of Mahon cheese texture. Journal of Food Science. 65(7): 1170-1174.
Bowland, E.L. and Foegeding, E.A. 1999. Factors determining large-strain (fracture) rheological properties of model processed cheese. Journal of Dairy Science. 82: 1851-1859.
Bowland, E.L. and Foegeding, E.A. 2001. Small strain oscillatory shear and microstructural analyses of a model processed cheese. Journal of Dairy Science. 84: 2372-2380.
Carić, M. and Kaláb, M. 1993. Processed cheese products. In “Cheese: Chemistry, Physics and Microbiology. Vol. 2,” edited by P.F. Fox, Chapman and Hall, New York.
Creamer, L.K. and MacGibbon, A.K.H. 1996. Some recent advances in the basic chemistry of milk proteins and lipids. International Dairy Journal. 6: 539-568. Dalgleish, D.G. 1987. The enzymic coagulation of milk. In "Cheese: Chemistry,
Physics and Microbiology. Volume 1. General Aspects," edited by P.F. Fox. Elsevier Applied Science Publishers Ltd., New York.
Dees, A.L. 2002. Effect of Various Ingredients on a Model Process Cheese System. M.S. Thesis, North Carolina State University.
Dickinson, E. 1992. An Introduction to Food Colloids. Oxford University Press, New York.
Drake, M.A., Gerard, P.D., Truong, V.D., and Daubert, C.R. 1999. Relationship between instrumental and sensory measurements of cheese texture. Journal of Texture Studies. 30: 451-476.
Ferry, J.D. 1980. Viscoelastic Properties of Polymers, 3rd edition. John Wiley & Sons, Inc., New York.
Fox, P.F., Guinee, T.P., Cogan, T.M, and McSweeney, P.H. 2000. Fundamentals of Cheese Science. ASPEN Publishers, Inc., Gaithersburg, Maryland.
Glenn, T.A. 2002. A Rheological Analysis of Complex Geometries with Application to Food Process Engineering. M.S. Thesis, North Carolina State University. Holsinger, V.H., Smith, P.W., and Tunick, M.H. 1995. Overview: cheese chemistry
and rheology. In "Chemistry of Structure-Function Relationships in Cheese," edited by E.L. Malin and M.H. Tunick, Plenum Press, New York.
Horne, D.S. 1998. Casein interactions: casting light on the black boxes, the structure in dairy products. International Dairy Journal. 8: 171-177.
Lopez, C., Bourgaux, c., Lesieur, P., Bernadou, S., Keller, G., and Ollivon, M. 2002. Thermal and structural behavior of milk fat. 3. Influence of cooling rate and droplet size on cream crystallization. Journal of Colloid and Interface Science. 254: 66-78.
Lucey, J.A., Munro, P.A., and Singh, H. 1998. Rheological properties and microstructure of acid milk gels as affected by fat content and heat treatment.
Journal of Food Science. 63(4): 660-664.
Mellema, M., Heesakkers, J.W.M., van Opheusden, J.H.J., and van Vliet, T. 2000. Structure and scaling behavior of aging rennet-induced casein gels examined by confocal microscopy and permeametry. Langmuir. 16: 6847-6854.
Mellema, M., Walstra, P., van Opheusden, J.H.J., and van Vliet, T. 2002. Effects of structural rearrangements on the rheology of rennet-induced casein particle gels.
Advances in Colloid and Interface Science. 98(1): 25-50.
Rosenberg, M., Wang, Z., Chuang, S.L., and Shoemaker, C.F. 1995. Viscoelastic property changes in Cheddar cheese during ripening. Journal of Food Science. 60(3): 640-644.
Ross-Murphy, S.B. 1995. Rheological characteristics of gels. Journal of Texture Studies. 26: 391-400.
Shih, W., Shih, W.Y., Kim, S., Liu, J., and Aksay, I.A. 1990. Scaling behavior of the elastic properties of colloidal gels. Physical Review A. 42(8): 4772-4779.
Steffe, J.F. 1996. Rheological Methods in Food Process Engineering, 2nd edition. Freeman Press, East Lansing, MI.
Swaisgood, H.E. 1996. Characteristics of milk. In "Food Chemistry, 3rd edition," edited by O.R. Fennema. Marcel Dekker, Inc., New York.
Tunick, M.H., Nolan, E.J., Shieh, J.J., Basch, J.J., Thompson, M.P., Maleeff, B.E., and Holsinger, V.H. 1990. Cheddar and Cheshire cheese rheology. Journal of Dairy Science. 73: 1671-1675.
Tuinier, R. and de Kruif, C.G. 2002. Stability of casein micelles in milk. Journal of Chemical Physics. 117(3): 1290-1295.
Chapter II
Abstract
Texture and functional properties of processed cheese are affected by a final
production step – cooling. Cooling effects were quantified with rheological data during
cooling at four rates (0.5, 0.1, 0.05, and 0.025 °C/min), and the results were consistent
with industrial observations: slower cooling yields a firmer cheese. To simulate industrial
production, five-pound cheese loaves were cooled at an ambient temperature of 5 °C
under free and forced convection. Slice-ability was estimated by cutting loaves at
different locations using a wire-cutting device attached to a universal testing machine,
and melt-ability was determined by the Schreiber method. To describe the properties as a
function of cooling schedule, the average cooling rates were estimated from a heat
transfer model to account for the temperature variations with cheese loaf location.
Cooling rates did not show a large difference within the five-pound loaf, and no obvious
trends in slice-ability and melt-ability were observed. Cheese loaves cooled with forced
convection had a slightly faster cooling rate. Comparing the forced with free convection,
a smaller force was required to slice the cheese, and a higher melt score was observed at
the same loaf position for those cheeses cooled at the faster rate. Cheese manufacturers
can benefit from this research by understanding the impact of cooling schedules on the
Introduction
Cheese is a dairy product made by the steps of acidification, coagulation,
dehydration, shaping, and salting. Chemical and physical properties of young, or
unripened, cheeses are affected by the origin and type of milk, acidity, coagulation, and
degree of dehydration. Complex biochemical changes, including proteolysis, lipolysis,
and glycolysis, continue during cheese aging, or ripening, and the subsequent flavor and
texture developments are influenced by moisture content, salt concentration, and
microflora (Fox et al., 2000).
The quality of cheese products can be evaluated by many functional properties
that determine the behavior of cheese during preparation, processing, storage, cooling,
and consumption (Fox et al., 2000). Melt-ability, flow-ability, oiling-off during cooking,
and slice-ability are terms describing cheese functionality, and the criteria for each term
differ with cheese type. For example, melt-ability, stretch-ability, amount of free-oil, and
browning are important for Mozzarella cheese (Rowney et al., 1999).
Processed cheese improves the functional properties of natural cheeses by
blending ingredients and controlling processing conditions (Fox et al., 2000). The
production of processed cheese typically starts with comminuting natural cheeses,
followed by blending with other ingredients, e.g. emulsifying salts, processing the blend
with thermal treatment, hot filling, portioning, packaging, and finally cooling (Fox et al.,
2000). Processed cheese quality is therefore derived from both formulae and processing
conditions. The age and type of natural cheeses, protein/fat ratio, pH, moisture, amount
influencing cheese functional properties (Shimp, 1985). As far as processing conditions
are concerned, a proper combination of mechanical history (agitation time and rate),
thermal history (temperature and time), and cooling history is needed to produce a
product with desired functional properties (Glenn, 2002; Fox et al., 2000; Carić and Kaláb, 1993).
As cooling is a final stage during processed cheese production, the microstructure
of the product formed during cooling impacts the final product quality. Industry has
observed that a faster cooling yields a softer product (Carić and Kaláb, 1993). However, there is a need to evaluate the implications of cooling effects on cheese functional
properties and quality.
Many tests used to evaluate cheese functionality are empirical, and the test
conditions vary widely. Efforts have been made to objectively measure these properties
(Cavella et al., 1992; Wang et al., 1998). For processed cheese, texture profile analysis has been applied to describe springiness, cohesiveness, chewiness, gumminess,
adhesiveness, hardness (Awad et al., 2002), and firmness (Swenson et al., 2000). Empirical methods still dominate from a convenience perspective, and the results
typically coincide with consumer observations (Muthukumarappan et al., 1999).
The objectives of this research were first to quantify rheological properties of
processed cheese during cooling at different rates and then to study the cooling effects on
specific cheese functional properties. To fulfill the second objective, five-pound cheese
loaves were used to simulate industrial production, and slice-ability and melt-ability were
predict the temperature history during cooling and to express cooling rates at precise
locations inside the loaf. Cheese manufacturers will benefit from this study by tuning
cooling conditions to help manufacture a product with improved functional attributes.
Heat transfer model and cooling rate expression
Heat transfer analysis
Under the experimental conditions used in this research, a processed cheese loaf
in a rectangular container was incubated in air at a constant temperature. Convective heat
transfer first occurred between air and the container outer surface, followed by the
subsequent conduction through the container wall and into the cheese loaf. After applying
the following assumptions:
(1) constant and uniform convective heat transfer coefficient between air and container,
(2) constant thermal conductivity of container and cheese,
(3) negligible contact resistance between container and cheese
(4) constant specific heat of cheese during cooling,
(5) no heat generation inside cheese loaf, and
(6) strict symmetry of cheese loaf with respect to the center,
the governing transient conduction equation within a cheese loaf was written as (Bird et
al., 2002):
t T z T y T x T 1 2 2 2 2 2 2 ∂ ∂ = ∂ ∂ + ∂ ∂ + ∂ ∂
where T is the absolute temperature, x, y, z are three coordinates in a Cartesian coordinate
system, t is the time, and α is the thermal diffusivity of cheese defined as:
p c k ρ
α = (2)
where k, ρ, and cp are the thermal conductivity, density, and specific heat of cheese,
respectively.
For the cheese loaf of given length (2L), width (2W), and height (2H), the following boundary conditions were applied:
At x = 0,
0 = ∂ ∂ =o x x T (3)
At x = L
h k s T T x T k L x 1 '+ − = ∂ ∂ − ∞ = (4)
At y = 0,
0 = ∂ ∂ =o y y T (5)
At y = W
At z = 0, 0 = ∂ ∂ =o z z T (7)
At z = H
h ' k s T T z T k H
z + 1
− = ∂ ∂ − ∞ = (8)
where T∞ is the ambient air temperature, h is the convective heat transfer coefficient
between air and container, s is the thickness of container wall, and k′ is the thermal
conductivity of the container wall.
When cooling from a uniform initial temperature Ti, the initial condition was written as: H z H , W y W , L x L t T
T= i when =0,- ≤ ≤ - ≤ ≤ and- ≤ ≤ (9)
A dimensionless temperature was defined as,
∞ ∞ − − = T T T t z y x T t z y x i ) , , , ( ) , , , (
θ (10)
and Eq. (1) was re-written:
t z y x 1 2 2 2 2 2 2 ∂ ∂ = ∂ ∂ + ∂ ∂ + ∂ ∂ θ α θ θ θ (11)
Separation of variables followed (Incropera and DeWitt, 1996),
) t, z ( Z ) t, y ( Y ) t, x ( X ) t, z , y , x ( = ⋅ ⋅
θ (12)
where X, Y, and Z is the dimensionless temperature as a function of a specific coordinate
∞ ∞ − − = T T T t, x T t, x X i ) ( )
( (13)
∞ ∞ − − = T T T t, y T t, x Y i ) ( )
( (14)
∞ ∞ − − = T T T t, z T z,t Z i ) ( )
( (15)
The temperature in a three-dimensional object is the product of three
one-dimensional solutions for an infinite slab of thickness of 2L, 2W, and 2H obeying the one-dimensional transport equation as (Incropera and DeWitt, 1996):
t x
X 1 X
2 2 ∂ ∂ = ∂ ∂
α (16)
t Y y Y 1 2 2 ∂ ∂ = ∂ ∂
α (17)
t Z z Z 1 2 2 ∂ ∂ = ∂ ∂
α (18)
These partial differential equations are commonly solved by further separating
each temperature into one variable, depending on time and the other on coordinate only.
Therefore, the solutions are similar for each coordinate (Incropera and DeWitt, 1996).
Further transformations of independent variables or constants may be used:
L x
x*= (19)
2 L t *
tx = α (20)
W y
2 W t *
ty = α (22)
H z
z*= (23)
2
H t *
tz = α (24)
A h k
s
k =
+1
' (25)
After several steps, the solutions may be written in the form of series:
(
)
(
)
(
t *)
[
cos( x*)]
sin sin *) t *, x (
X m x m
m
x exp
-2 2
4 2
1 m m
m λ λ
λ λ
λ
∑
∞= +
= (26)
( )
(
)
(
t *)
[
cos( y*)]
sin sin *) t *, y (
Y n y n
n
y exp
-2 2
4 2
1 n n
n ς ς
ς ς
ς
∑
∞= +
= (27)
( )
( ) (
t *)
[
cos( z*)]
sin sin *) t *, z (Z j z j
j
z exp
-2 2
4 2
1 j j
j ξ ξ
ξ ξ
ξ
∑
∞= +
= (28)
where the eigenvalues, λm, ςn, and ξj, are the positive roots from Eq. (29), (30), and (31),
respectively. The first five roots used were adapted from literature (Myers, 1987).
λtan(λ) – L/A= 0 (29)
ςtan(ς) – W/A= 0 (30)
ξtan(ξ) – H/A= 0 (31)
Average cooling rate expressions for an inclusive space or a plane
Cooling rate may be defined as the differential of temperature with respect to
time. Accordingly, this definition yields a cooling rate dependent on both space and time
When expressing the functionality of processed cheese, the slice-ability may be
measured by quantifying the amount of energy expended while shearing a wire through a
loaf, and the melt-ability may be described as how well a cheese disc flows or spreads
when heated (Muthukumarappan et al., 1999). These properties are integrated parameters from an inclusive space or plane. An expression of average cooling rate is thus needed to
account for spatial variations during a cooling process. An average cooling rate (CR) in an inclusive space during a cooling process may be evaluated as:
(
)
∫∫∫∫
∫∫∫∫
∂ ∂ = dt dz dy dx dt dz dy dx t t, z , y , x TCR (32)
and specifically for a plane at a distance x from the loaf center, the expression may be
written as:
(
)
∫∫∫
∫∫∫
∂ ∂ = dt dz dy dt dz dy t t, z , y , x T CR (33)If the heat transfer model predicts satisfactory temperature histories within a
cheese loaf, the above equation can be used to estimate the average cooling rate for the
two-dimensional slice plane within the loaf. The slice-ability and melt-ability can thus be
Materials and methods
Materials
Processed cheese samples (American yellow) were donated by the Land-O-Lake,
Inc. (Minneapolis, MN). Cheeses, packed into five-pound loaves and produced from the
same batch, were directly acquired from manufacturing plants. To isolate cooling effects,
simplify the experiments, and improve the consistency, cheese loaves were used without
further processing.
Small amplitude rheology
During rheological tests with cheese, slip is a common problem due to a high fat
content. For parallel plate geometry, adhesives (Sutherrawattananonda and Bastian, 1998;
Nolan et al., 1989; Tunick et al., 1990), serrated plates (Sutherrawattananonda and Bastian, 1998; Rosenberg et al., 1995; Yun et al., 1994; Nolan et al., 1989), and sand paper (Subramanian and Gunasekaran, 1997a,b; Nolan et al., 1989) were possible
approaches to handle slip, and serrated plates were determined to give the most consistent
data. Therefore, a serrated couette assembly was used throughout this work. The bob had
an outer diameter of 2.5 cm, and the cup had an inner diameter of 2.7 cm.
The small amplitude oscillatory tests were performed with a Bohlin VOR
rheometer (Bonlin Reologi, Inc., Cranbury, NJ). Initially, 14.00 grams of cheese sample
was loaded into the cup, and the opening was covered with parafilm to minimize
moisture loss. Once the rheometer water bath was heated to 80 °C, the cup with sample
was loaded and incubated for 6 min at 80 °C to melt the cheese. The film was removed,
a mineral oil layer was applied to the sample surface, and a cap was placed on the cup to
further minimize moisture loss. The sample was equilibrated at 80 °C for 30 minutes,
then cooled to 5 °C at four rates (0.025, 0.05, 0.1, and 0.5 °C/min). A frequency of 0.05
Hz and a 1% strain was applied during oscillation. The 1% strain was well within the
limit of linear viscoelastic regime. All the items involved in the experiments were
weighed before and after testing to evaluate moisture losses, and there was no statistical
difference in moisture loss for different cooling schedules.
Heat transfer model verification
Thermal properties and convective heat transfer coefficient determination.
Thermal conductivity, density, and specific heat of processed cheese were determined by
a thermal conductivity probe, pycnometer (Model 1305, Micromeritics Instrument
Corporation, Norcross, GA), and differential scanning calorimeter (DSC7, the
Perkin-Elmer Corporation, Norwalk, CT), respectively. The convective heat transfer coefficient
at an incubator temperature of 5 °C was estimated by measuring the temperature history
inside an aluminum cube using the following equation (Singh and Heldman, 2001),
( )
tc V d h T T T T ln p i 6 2 ρ − = − − ∞ ∞ (34)
where T is the tempearture at a corresponding time (t), T∞is the ambient temperature (5
°C), Ti is the initial temperature, d, V, ρ, and cp are the width (16 mm), volume, density
(2707 kg/m3), and specific heat (896 J/kg-K) of the aluminum cube, respectively.
Model verification.A five-pound, commercial processed cheese loaf was fit into
and 18 thermocouples were used to record temperature histories at 10 minute time
intervals for different locations inside the block. Thermocouples were positioned at
combinations of different x, y, and z distances from the loaf center. The cheese loaf was
equilibrated at an ambient temperature of 50 °C, and the cooling started by instantly
subjecting the loaf to an ambient temperature of 5 °C. Cooling was stopped after 24
hours.
Slice-ability and melt-ability
The cheese block was cooled at conditions described in the model verification.
Cooling by forced convection was also studied by using a fan inside the incubator. All the
tests were performed for two loaves, and the averages of the results were reported.
Slice-ability of processed cheese was measured by the setup in Fig. 2. A steel wire
(diameter of 1.0 mm) was driven downwards into the cheese block at a pre-determined
position using a universal testing machine (Model 1122, Instron Engineering Corp.,
Canton, MA). To minimize temperature effects during slicing, the cheese block was
sectioned into smaller blocks at a 4 cm width, and the centers of these smaller blocks
were the pre-determined cutting positions (Fig. 3). Two loaves were used for each
treatment. For each loaf, one test was performed at the center and two tests at other
distances from center. The reported data was thus from the average of 2 tests at the center
and 4 tests at other locations. Samples were stored at 5 °C prior to analysis, and a
The Schreiber method was used to quantify sample melt (Kosikowski and Mistry,
1997). In the Schreiber method, melted samples are compared to six lines along a set of
11 concentric circles with 5mm incremental differences in diameter. The average of the
six readings is the Schreiber score. A score of 0 corresponds to a circle with a diameter of
4.1 cm, and an increase of 1 in score corresponds to an increased flow of 5 mm in
diameter. To improve the accuracy, a modified method counted pixels of digital images
taken from melted cheese samples (Muthukumarappan et al., 1999; Glenn, 2002). Cheese slices were taken from the positions illustrated in Fig. 3, and discs
(thickness of 0.5 cm and diameters of 4.1 cm) were cored from the slice center. The
average of two discs taken from each side of the slicing position was treated as the
melt-ability for that location in the block. A Thelco Model 28 convection oven (Precision
Scientific, Winchester, VA) was preheated to 232 °C, and cheese discs were placed in flat
aluminum pans and heated at this temperature for 5 minutes. After heating, the pans were
removed from the oven and cooled at room temperature for 30 minutes. An IBM PC
camera (IBM North America, White Plains, NY) was used to capture the shapes of
melted cheese discs. The pixels from a melted area and a reference (a penny area) were
measured using Scion Imaging software (Beta 4.0.2, Scion Corporation, Frederick, MA).
The melted area was calculated by the relative pixels to the reference and then converted
to the Schreiber scores by using the area standards corresponding to the traditional