PATTERN BASED ON DIMENSION REDUCTION METHODS
SHAZLYN MILLEANA SHAHARUDIN
A thesis submitted in fulfilment of the requirements for the award of the degree of
Doctor of Philosophy (Mathematics)
Faculty of Science Universiti Teknologi Malaysia
To my beloved mother and father My lovely husband and my children
ACKNOWLEDGEMENT
First and foremost, I am very grateful to Allah The Almighty for giving me the strength to finish this project. I wish to acknowledge the extraordinary help in variety of ways I received from my supervisor, Dr. Norhaiza Ahmad for her guidance, comments and encouragement. I am really appreciating for her direction and for demonstrating her utmost patience in handling me. I have learned tremendously from her brilliance, high standards and strive for excellence, including how to choose and pursue interesting research directions and how to present them both in paper and talks. To Assoc. Prof. Dr. Fadhilah Yusof, thank you for introducing me and got me excited about the field of hydrology especially in rainfall.
I would like to extend my most sincere gratitude to my family especially to my beloved mother and father, Norasmah and Shaharudin, my lovely husband and children, Wan Azizi, Qaleesya and Hakimi for their support, encouragement and precise advice. Not forgotten to my sister, Awin and my family that help me a lot in this journey.
Besides, I would like to thank Malaysian Ministry of Higher Education for the financial support through MyPhD Scholarship.
ABSTRACT
ABSTRAK
TABLE OF CONTENTS
CHAPTER TITLE PAGE
DECLARATION ii
DEDICATION iii
ACKNOWLEDGEMENTS iv
ABSTRACT v
ABSTRAK vi
TABLE OF CONTENTS vii
LIST OF TABLES xii
LIST OF FIGURES xiv
LIST OF SYMBOLS xix
LIST OF APPENDICES xxii
1 INTRODUCTION 1
1.1 Introduction 1
1.2 Background of Problem 1
1.3 Rainfall Data in Peninsular Malaysia
1.3.1 Database for Torrential Rainfall Data 1.3.2 Descriptive Statistics for Torrential Rainfall Data
5 8
10
1.4 Problem Statement 11
1.5 Objectives 13
1.6 Scope of the Study 14
1.7 Significance of the Study 15
1.9 Research Methodology 16
1.10 Thesis Organization 18
2 LITERATURE REVIEW 20
2.1 Introduction 20
2.2 Introduction to the Dimension Reduction
Methods 20
2.3 Identifying Rainfall Pattern using Dimension
Reduction Approach 23
2.4 Development of Robust Principal Component
Analysis in Dimension Reduction Approach 29 2.5 Development of Modification of Singular
Spectrum Analysis (SSA) in Dimension
Reduction Approach 32
2.6 Summary 35
3 GUIDED SPATIAL TORRENTIAL RAINFALL CLUSTER PATTERNS BASED ON ROBUST
PCA 37
3.1 Introduction 37
3.2 Principal Component Analysis (PCA) 3.2.1 Method to Extract the Number of Principal Components
40
42
3.3 Cluster Analysis
3.3.1 k-means algorithm
3.3.2 Calinski and Harabsz Index
44 46 47 3.4 Disadvantage of PCA based Pearson
Correlation 48
3.5 Robust Dimension Reduction Method for
Guided Spatial Torrential Rainfall Pattern 48 3.5.1 PCA based Tukey’s Biweight
Correlation 48
3.5.3 Tukey's Biweight Function 51
3.5.4 Breakdown Point 55
3.6 Validity Indices for Clustering Algorithm 55 3.7 Simulation on the Effectiveness of Robust
PCA 59
3.7.1 Probability Distribution 59 3.7.1.1 Generalized Pareto
Distribution 60 3.7.1.2 Log Normal Distribution 60 3.7.1.3 Gamma Distribution 62
3.7.2 Fitting Distribution 63
3.7.2.1 Distribution Graph 63 3.7.2.2 Goodness of Fit Test 65 3.7.3 Statistical Parameters for Simulation 67
3.7.4 Simulation 68
3.7.5 Evaluating Performance of Robust PCA 70
3.8 Summary 71
4 RESULTS AND DISCUSSION FOR SPATIAL TORRENTIAL RAINFALL PATTERNS USING
ROBUST PCA 72
4.1 Introduction 72
4.2 Fitting Distribution on Multivariate Torrential
Rainfall Data in Peninsular Malaysia 73 4.3 Evaluating Performance of Robust PCA based
on Simulation Results 75
4.4 Application to Torrential Rainfall Data in
Peninsular Malaysia 79
4.4.1 Description of Clustering Rainfall
Patterns 82
5 MODIFIED SINGULAR SPECTRUM ANALYSIS IN IDENTIFYING TEMPORAL TORRENTIAL RAINFALL PATTERNS OVER
PENINSULAR MALAYSIA 93
5.1 Introduction 93
5.2 Singular Spectrum Analysis (SSA) 95 5.2.1 Other Features of SSA Method 98 5.2.1.1 Choice of Window Length, L 99 5.2.1.2 Determining the Significance
Number of Components to
Extract from SVD 99 5.2.1.3 Identifying the Number of
Leading Components Based on
Eigenvector Plot 100
5.3 Modification of SSA 101
5.3.1 Iterative O-SSA 102
5.3.2 Robust Sparse K-Means (RSk-means) 105 5.3.3 Algorithm for Modified SSA 107 5.4 Simulation on the Effectiveness of Modified
SSA 109
5.4.1 Probability Distribution 109 5.4.1.1 Weibull Distribution 109 5.4.2 Statistical Parameters for Simulation 110 5.4.3 Simulation Procedure for Modified
SSA
111
5.4.4 Assessing Separability in Time Series
Data 113
6 RESULTS AND DISCUSSION USING MODIFIED SINGULAR SPECTRUM ANALYSIS IN IDENTIFYING TEMPORAL TORRENTIAL RAINFALL PATTERNS OVER
PENINSULAR MALAYSIA 116
6.1 Introduction 116
6.2 Fitting Distribution on Univariate Torrential
Rainfall Data in Peninsular Malaysia 116 6.3 Assessing Separability in Time Series based
on Simulation Results 119 6.4 Application to Time Series Torrential Rainfall
Data in Peninsular Malaysia 122
6.5 Summary 132
7 CONCLUSION 134
7.1 Introduction 134
7.2 Summary 134
7.3 Limitation of The Study 138
REFERENCES 140
LIST OF TABLES
TABLE NO. TITLE PAGE
1.1 List of the rainfall stations according the
monsoon occurred 9
1.2 Summary statistics of daily torrential rainfall
amount (mm) for each station divided by regions 12
3.1 Parameters, mean and variance of Normal and
Log-Normal distribution 61
3.2 Summary statistics of daily torrential rainfall
amount (mm) for each station divided by regions 68
4.1 Goodness of the fit test for identify the best fitting
distribution to the data set 75
4.2 The average number of components based on 70% cumulative percentage of variance in several
values of breakdown point 76
4.3 Average number of components and clusters obtained based on Pearson and Tukey’s Biweight
4.4 Indices to measure the quality of clustering
results for 20 simulated data 78
4.5 Summary of the ten rainfall pattern groups
obtained for daily torrential rainfall 90
4.6 Percentage frequency distribution of torrential rainfall days over 33 years according to monsoon
occurred for ten rainfall patterns 91
5.1 Summary statistics of daily torrential rainfall amount (mm) for each station based on ten
rainfall cluster patterns 111
6.1 Goodness of the fit test for identify the best fitting
distribution to the data set 119
6.2 Summary of the criteria of ten spatial and temporal rainfall pattern groups obtained for
LIST OF FIGURES
FIGURE NO. TITLE PAGE
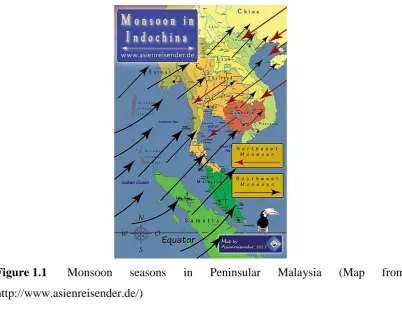
1.1 Monsoon seasons in Peninsular Malaysia 2
1.2 A tipping bucket rain gauge has a receiving funnel leading to two small metal collectors (buckets) and the maximum rainfall rate is 200
mm/hr for the funnel 6
1.3 The location of 75 rainfall stations in Peninsular
Malaysia 7
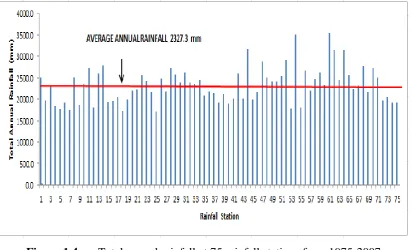
1.4 Total annual rainfall at 75 rainfall stations from
1975-2007 7
1.5 Rainfall stations that represent the main torrential
centers in Peninsular Malaysia 9
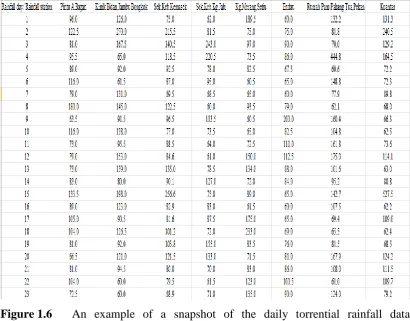
1.6 An example of a snapshot of the daily torrential rainfall data consisting of daily amount of rainfall
data recorded at several locations 10
2.1 A diagram showing a typical operational framework in handling high dimensional data based on dimension reduction
21
2.2 The shaded areas in this map shows the rainfall classification pattern based on the first principal component scores of S-mode PCA (image taken
from Stathis and Myronidis, 2009) 25
2.3 The shaded areas in this map shows the rainfall classification pattern based on the second principal component scores of S-mode PCA (image taken from Stathis and Myronidis, 2009)
25
2.4 Spatial distributions of the daily abundant rainfall patterns obtained from classification. (image
taken from Fragoso et al.(2008) 27
2.5 Chronology of the literature review in identifying rainfall pattern using dimension reduction
approach 35
2.6 Development of robust PCA and modified SSA in
dimension reduction approach 36
3.1 k-means iteration procedures 47
3.2 The derivative function, -function for the
biweight M-estimator 52
4.1 QQ plot displays the diagonal line along which the graph points should fall for three different
distributions function 73
4.2 Plot of the difference between the empirical cumulative distribution function (CDF) and the
fitted CDF for three different distributions 74
4.3 Bar chart shows the number of components obtained using PCA based Pearson correlation and PCA based Tukey’s biweight correlation on
original torrential rainfall data 81
4.4 Bar chart shows the number of clusters obtained using PCA based Pearson correlation and PCA based Tukey’s biweight correlation on original
torrential rainfall data 81
4.5 Daily rainfall composites for the RP 1 and RP 2 obtained in the classification of torrential events
in the northern region in Peninsular Malaysia 83
4.6 Daily rainfall composites for the RP 3 and RP 4 obtained in the classification of torrential events
in the Eastern region in Peninsular Malaysia 85 4.7 Daily rainfall composites for the RP 5 and RP 6
obtained in the classification of torrential events
in the Eastern region in Peninsular Malaysia 86
4.8 Daily rainfall composites for the RP 7 and RP 8 obtained in the classification of torrential events
4.9 Daily rainfall composites for the RP 9 and RP 10 obtained in the classification of torrential events
in the Eastern region in Peninsular Malaysia 88
4.10 Monsoons distribution for the ten rainfall patterns
of torrential daily rainfall 91
6.1 QQ plot displays the diagonal line along which the graph points should fall for three different
distributions function 117
6.2 Plot of the difference between the empirical cumulative distribution function and the fitted
CDF for three different distributions 122
6.3 Effect of w-correlation based on SSA, and modified SSA, using 20 simulated data at
different window lengths 120
6.4 Simulated data (dash line), modified SSA (red line) and SSA (blue line) for trends of
reconstruction series data with different L 121
6.5 Eigenvectors plot obtained by SSA 123
6.6 Eigenvectors plot obtained by modified SSA 124
6.7 Average periodogram for original series torrential
rainfall data in Sek.Keb.Kg.Jabi (Terengganu) 130
6.8 The w-correlation using SSA and modified SSA
6.9 Plot of reconstructed components from extracted trends using SSA and modified SSA for the RP 1 and RP 2 where located in Northern region. refer to range of local time scale and RP
refer to rainfall pattern 127
6.10 Plot of reconstructed components from extracted trends using SSA and modified SSA for the RP 3 and RP 4 where located in Eastern region. refer to range of local time scale and RP refer to
rainfall pattern 128
6.11 Plot of reconstructed components from extracted trends using SSA and modified SSA for the RP 5 and RP 6 where located in Eastern region. refer to range of local time scale and RP refer to
rainfall pattern 129
6.12 Plot of reconstructed components from extracted trends using SSA and modified SSA for the RP 7 and RP 8 where located in Eastern region. refer to range of local time scale and RP refer to
rainfall pattern 130
6.13 Plot of reconstructed components from extracted trends using SSA and modified SSA for the RP 9 and RP 10 where located in Eastern region. refer to range of local time scale and RP refer to
LIST OF SYMBOLS
𝐗 - Data matrix
𝑥𝑖𝑗 - Elements in the input matrix, 𝐗i.e.rainfall amount
𝐗∗ - Data matrix is standardized with median and mean
absolute deviation
𝑥𝑖𝑗∗ - Elements in the input matrix, 𝐗∗after standardized
𝐶𝑡𝑡 - Correlation matrix 𝑛, 𝐼 - Rainfall days 𝑝, 𝐽 - Rainfall stations
𝐄𝑡 - Matrix with the columns holding the eigenvectors 𝑒𝑡
⃗⃗⃗ - Elements of eigenvector matrix
𝑍 - Rank of 𝐗′
𝜆 - Eigenvalue
𝑡𝑚 - The cumulative percentage of variation in PCA
𝑚 - Number of components
𝑙𝑘 - The variance of the 𝑘th principal component 𝐶𝑖 - The 𝑖𝑡ℎ cluster
𝑐𝑖 - The centroid of cluster 𝐶𝑖
K - Number of clusters
𝐶𝐻 - Calinski and Harabasz index
𝐵 - The sum of squares among the clusters 𝑊 - The sum of squares within the clusters ℎ - The number of principal component loadings
𝜌 - Objective function
𝑇𝑛 - M-estimator of location
𝑆𝑛 - Scale the observation
𝑐∗ - Tuning constant
𝑤(𝑢) - Weight function
𝑆̃ - Biweight estimate of shape
𝑠̃𝑖𝑗 - Element of 𝑆̃
𝑟̃𝑖𝑗 - The biweight correlation of 𝐗∗
𝑃 - Partition of the data
SS - Both data points belong to the same cluster of the clustering structure 𝐶 and to the same group of partition 𝑃
SD - Data points belong to the same cluster of 𝐶 and to different groups of 𝑃
DS - Data points belong to different clusters of 𝐶 and to the same group of 𝑃
DD - Both points belong to different clusters of 𝐶and to different groups of 𝑃
𝑀 - The maximum number of all pairs in the data set 𝑁 - The total number of points in the data set
𝑅 - Rand index
𝑆(𝑖) - Silhouette index
𝑎𝑖 - The average distance between data points, 𝑖 and all
other data points in the same cluster
𝑏𝑖 - The average distance between 𝑖 and the data points in
the nearest neighbouring cluster 𝐷𝐵𝑛𝑐 - Davies-Bouldin index
𝑑𝑖𝑗 - Dissimilarity measure between two clusters
𝑅𝑖𝑗 - Similarity measure of clusters
𝑠𝑖 - Dispersion measure of a cluster
𝛼 - Significance level
PCA - Principal component analysis GPD - Generalized Pareto distribution
𝑟 - Breakdown point
SW - Southwest
NE - Northeast
SSA - Singular Spectrum Analysis SVD - Singular Value Decomposition
L - Window length
𝕐𝑇 - A one dimensional time series 𝕏𝑖 - A multi-dimensional time series
Σ - Diagonal matrix
𝜎𝑖 - Singular values
𝑢𝑖 - Left singular vectors 𝑣𝑖 - Right singular vectors
𝐗𝐼 - Resultant matrix
𝜌𝑤 - w-correlation
RSVD - Restricted SVD
† - Pseudo-inverse
LIST OF APPENDICES
APPENDIX TITLE PAGE
INTRODUCTION
1.1 Introduction
Patterns of change in extreme rainfall events vary with region and time. This is parallel with many scientific studies relating to the physics of a warming climate. In extreme rainfall events, these changes are termed as spatial and temporal variations which exist in the observed torrential rainfall data. These variations can be used to display similar characteristics and behavior of structured spatial rainfall patterns. From the identified cluster, variations in the time series observations can be decomposed and reconstructed to locate the time period in which the extreme rainfall events occur. Thus, the identification of spatial and temporal cluster rainfall patterns is useful for hydrologist in analyzing environmental models and improves assessment on climate change.
1.2 Background of Problem
Figure 1.1 illustrates the prevailing wind flows of monsoon seasons in Malaysia. Monsoons bring high volumes moisture to various parts of Malaysia due to her location in the equatorial zone with a tropical climate. As a result, the total amount of rainfall in Malaysia is rather high, between 2000 mm to 4000 mm, with 150 to 200 rainy days annually (Suhaila and Jemain, 2007).
Figure 1.1 Monsoon seasons in Peninsular Malaysia (Map from
http://www.asienreisender.de/)
climatologist or hydrologists to recommend actions in mitigating the flood damages and taking necessary precautions when they happen.
In general, the study of spatial and temporal rainfall patterns in hydrology use two approaches which are regression based modelling and clustering based approach. Studies related to regression based modelling include Xu et al.(2014), Kaliraj et al.(2012), Koumare (2014), Lee (2015), Szyniszewska and Waylen (2012) and Mohd Deni et al.(2008) which generally aims to characterize the rainfall distribution patterns. Identifying spatial and temporal rainfall patterns using this approach is more focused on detecting trend compared to describe the regional characteristics of each pattern for rainfall data. It is because the results from this approach will be used to accomplish the goal of forecasting. However, studies related to clustering based approach in identifying spatial and temporal rainfall patterns is to quantify the characteristics of a set of observations that place data into same groups which imply that rainfall patterns are similarly highly structured (Romero et al., 1999). Furthermore, this approach tends to recognized as efficient statistical tool to deal with tasks for grouping regions and determine time periods based on grouping results that reflect the occurrence of rainfall events.
However, standard clustering methods to find spatial and temporal rainfall patterns might not be suitable for tropical climate due to several characteristics of the rainfall data in the tropics. One, regions in the tropics generally experience rainfall throughout the year. Thus, a long time series of observed rainfall data tend to produce a highly dimensional data set. This leads to the data becoming complex to extract significant information as it may contain high degree of irrelevant and redundant information that could degrade the results of the analysis. Two, even if tropical regions have two dry and wet seasons, the amount of rainfall does not significantly vary much as compared to that in the four season regions. Thus, this makes it difficult to discern a particular cluster pattern for this type of rainfall data. Three, such large data set of recorded rainfall data are bound to contain noise in the rainfall measurements. This noise could be an intrinsic error structure due to either technical or human recording error.
In essence, identifying rainfall patterns under the circumstances outlined above can be daunting task. Therefore, it is essential that any analysis should take into account as many of these factors as possible in order to identify the spatial and temporal cluster of rainfall patterns.
In this thesis, we present two statistical strategies based on a reduction dimension approach in identifying the spatial and temporal torrential rainfall patterns in Peninsular Malaysia by considering the issues mentioned above. The general strategies are namely (i) providing guided cluster rainfall pattern associated with torrential rainfall events based on region (ii) effectively guide the identification of local time scale indicated at the peak occurrence of temporal torrential rainfall.
by the significance of the study and notations are included in this chapter. Finally, the synopsis of the thesis ends this chapter.
1.3 Rainfall Data in Peninsular Malaysia
Malaysia consists of two noncontiguous areas, Peninsular Malaysia (West Malaysia) and the states of Sabah and Sarawak, known together as East Malaysia, with a total area of 329,750 sq km. This study of rainfall focuses on the long narrow Peninsula Malaysia that covers from latitude 1∘20′ north to latitude 6∘40′ north, and from longitude 99∘35′ east to longitude 104∘20∘ east. The region is chosen based on the length, reliability and quality of daily rainfall data covering more than 30 years.
The initial daily rainfall data from 75 stations over Peninsular Malaysia were obtained from Jabatan Pengairan dan Saliran (JPS) which measure rainfall using bucket rain gauge as shown in Figure 1.2. The rainfall data is complete without missing values from year 1975 to 2007 with a total of 903,375 daily measurements. Within those years, the data have 8 leap days, the data of which are excluded for this study. The rainfall data set considered for the purpose of this study is taken from 75 stations and 12,045 days which constitute enough data to allow for the identification of the main rainfall patterns. Rainfall stations are located at different geographical coordinates all over Peninsular Malaysia on four regions, East, Southwest, West and Northwest. Figure 1.3 shows the locations of all 75 stations indicated by the letters N,S,W,E reflecting the four region followed by a number. Detail information regarding these rainfall stations can be referred to in Appendix A.
listed in Table A.1 in Appendix A. The red lined show the average annual rainfall of 2300 mm. It is observed that 37 stations from 75 stations receive more than the average rainfall yearly. These stations are found to be located in the eastern region of Peninsular Malaysia.
Figure 1.3 The location of 75 rainfall stations in Peninsular Malaysia
1.3.1 Database for Torrential Rainfall Data
In this study, we focus on the occurrence of extreme rainfall event described as torrential rainfall. It was therefore necessary to choose some criteria that would lead to the establishment of a threshold, in order to allow for a clear distinction between what constitutes a day of torrential rainfall in the Peninsular Malaysia region and what does not. The range of threshold for torrential rainfall data in Peninsular Malaysia is 60 mm/day. This threshold is chosen based on the categorization of rainfall intensity by Jabatan Pengairan dan Saliran (JPS). By filtering days with rainfall more than 60 mm for at least 2% of overall stations, we managed to obtain 250 days and 15 rainfall stations which in turn are suffice enough to represent the main torrential centers.
Figure 1.5 Rainfall stations that represent the main torrential centers in Peninsular Malaysia
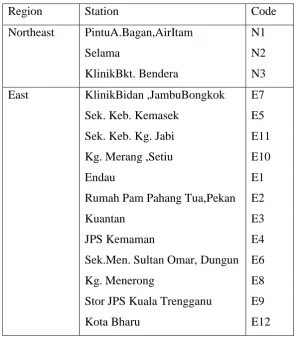
Table 1.1: List of the rainfall stations according the monsoon occurred
Region Station Code
Northeast PintuA.Bagan,AirItam N1
Selama N2
KlinikBkt. Bendera N3
East KlinikBidan ,JambuBongkok E7
Sek. Keb. Kemasek E5
Sek. Keb. Kg. Jabi E11
Kg. Merang ,Setiu E10
Endau E1
Rumah Pam Pahang Tua,Pekan E2
Kuantan E3
JPS Kemaman E4
Sek.Men. Sultan Omar, Dungun E6
Kg. Menerong E8
Stor JPS Kuala Trengganu E9
Figure 1.6 An example of a snapshot of the daily torrential rainfall data consisting of daily amount of rainfall data recorded at several locations
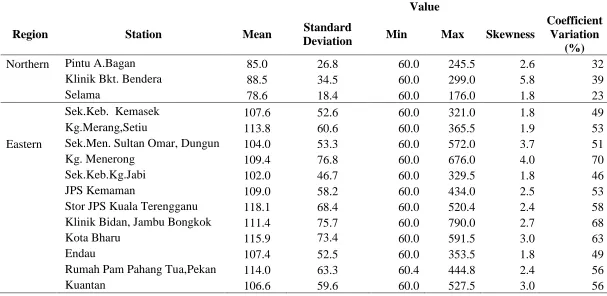
1.3.2 Descriptive Statistics for Torrential Rainfall Data
Data preparation is one of the important step before proceed to further analysis where this step is involving data screening, data evaluation, selection of records, operations to bring the number of variables to manageable range. Descriptive statistics of torrential rainfall data such as mean, standard deviation and skewness as shown in Table 1.2 are calculated to provide a brief overview of the torrential rainfall data on the study area.
variation between regions. The stations at the East region show the largest variability of torrential rainfall amounts, which range from 46% to 70%. The lowest coefficient variation is found in the Northeast station with variation less than 39%. Northeast and East region give positive skewness with starting value from 1.8 mm to 5.8 mm. The results illustrate that the shape of rainfall distribution for the stations in this two regions is skewed due to the values of the skewness are far enough from zero. We can conclude that the daily torrential rainfall data probably did not come from a normal population.
1.4 Problem Statement
Identify daily spatial and temporal of torrential rainfall patterns is not an easy task due to several issues.
The daily torrential rainfall data are of high dimensions and are difficult to visualize and interpret.
12
Table 1.2 : Summary statistics of daily torrential rainfall amount (mm) for each station divided by regions
Value
Region Station Mean Standard
Deviation Min Max Skewness
Coefficient Variation
(%)
Northern Pintu A.Bagan 85.0 26.8 60.0 245.5 2.6 32
Klinik Bkt. Bendera 88.5 34.5 60.0 299.0 5.8 39
Selama 78.6 18.4 60.0 176.0 1.8 23
Sek.Keb. Kemasek 107.6 52.6 60.0 321.0 1.8 49
Kg.Merang,Setiu 113.8 60.6 60.0 365.5 1.9 53
Eastern Sek.Men. Sultan Omar, Dungun 104.0 53.3 60.0 572.0 3.7 51
Kg. Menerong 109.4 76.8 60.0 676.0 4.0 70
Sek.Keb.Kg.Jabi 102.0 46.7 60.0 329.5 1.8 46
JPS Kemaman 109.0 58.2 60.0 434.0 2.5 53
Stor JPS Kuala Terengganu 118.1 68.4 60.0 520.4 2.4 58
Klinik Bidan, Jambu Bongkok 111.4 75.7 60.0 790.0 2.7 68
Kota Bharu 115.9 73.4 60.0 591.5 3.0 63
Endau 107.4 52.5 60.0 353.5 1.8 49
Rumah Pam Pahang Tua,Pekan 114.0 63.3 60.4 444.8 2.4 56
Besides that, the amount of rainfall does not significantly vary much as
compared to that in the four season regions of subtropical climate. This leads to difficulty to discern a particular cluster pattern for this type of rainfall data. In study of identifying daily spatial and temporal torrential rainfall patterns, we need more clusters which could explain the various types of rainfall patterns in region where each pattern exhibits specific characteristics. Thus, a much robust procedure is essential to improve the cluster patterns.
Another limiting factor of identifying daily spatial and temporal torrential
rainfall data is that the data contain noise. Noise in rainfall data is defined as the observations are never completely accurate due to either technical or human recording error. When there are noises in the data, statistical approach that used to analyze the data set would yield poor accuracies of the results. Thus, we need a statistical approach to separate noise from rainfall data to make them more readily observable.
1.5 Objectives
This thesis aims to deal with torrential rainfall data in Peninsular Malaysia: (i) providing guided rainfall clusters based on a robust dimension reduction method (ii) decomposing and reconstructing the time series components in the data to locate the time period of occurrence in rainfall events.
Specifically, we want to be able to:
b) provide a robust procedure to improve the cluster partitions of a PCA guided clustering in identifying rainfall patterns.
c) propose modification of SSA to locate the range of time period from the extracted trend components that is free from noise, at a particular location of torrential rainfall events.
1.6 Scope of the Study
1.7 Significance of the Study
This study proposes to:
a) establish the pattern of daily torrential rainfall patterns in Peninsular Malaysia using clustering method, where each cluster is identified to be linked to certain topographic characteristics.
b) identify local time scale to determine when torrential rainfall events occurred at a particular location.
c) establish a novel approach in multivariate technique for certain hydrologic applications especially in tropical climate.
d) help in further analysis and development of appropriate models for prediction of torrential rainfall events over Peninsular Malaysia.
1.8 Notations
To ease computation process, the database is set up to take into form of a large rectangular 𝑛 rows by 𝑝 columns matrix 𝐗, with 𝑛 > 𝑝. We denote 𝑥𝑖𝑗 ∈ 𝐗 to
be the rainfall amount for each 𝑖𝑡ℎ at each 𝑗th rainfall station where 𝑖 = 1, … , 𝑛, 𝑗 = 1, … , 𝑝.
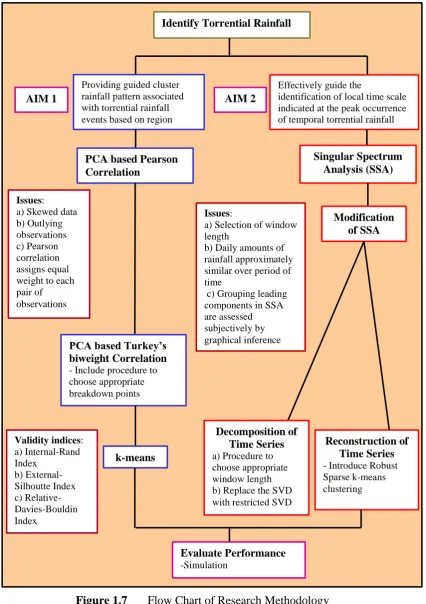
1.9 Research Methodology
Briefly, this thesis focuses on two statistical strategies in identifying spatial and torrential rainfall patterns in Peninsular Malaysia, namely
(i) providing guided cluster rainfall pattern associated with torrential rainfall events based on region
(ii) effectively guide the identification of local time scale indicated at the peak occurrence of temporal torrential rainfall
Figure 1.7 Flow Chart of Research Methodology Identify Torrential Rainfall
Providing guided cluster rainfall pattern associated with torrential rainfall events based on region
PCA based Pearson Correlation
PCA based Turkey’s biweight Correlation - Include procedure to choose appropriate breakdown points Issues:
a) Skewed data b) Outlying observations c) Pearson correlation assigns equal weight to each pair of observations
k-means
Effectively guide the
identification of local time scale indicated at the peak occurrence of temporal torrential rainfall
Singular Spectrum Analysis (SSA) Modification of SSA Decomposition of Time Series a) Procedure to choose appropriate window length b) Replace the SVD with restricted SVD
Reconstruction of Time Series - Introduce Robust Sparse k-means clustering Issues:
a) Selection of window length
b) Daily amounts of rainfall approximately similar over period of time
c) Grouping leading components in SSA are assessed subjectively by graphical inference Evaluate Performance -Simulation Validity indices: a) Internal-Rand Index b) External-Silhoutte Index c) Relative-Davies-Bouldin Index
1.10 Thesis Organization
Chapter 1 introduces the background of the problem and the related issues to identify the spatial and temporal daily torrential rainfall patterns in Peninsular Malaysia. It also presents the description of the study area and describes the specific dataset that were used in this study. In addition, descriptive of daily torrential rainfall statistics, determination of threshold for rainfall data, scope of the study, significance of the study, notations and research methodology also presented in this chapter. In essence, this chapter provides a general overview of the thesis. Furthermore in Chapter 2, the existing works related to the area of research and the methods related to this study are reviewed. The chapter begins with identification of rainfall pattern using multivariate analysis where we focus on past literature that have similar objectives and which employ the same method to the data analysis. Then, we proceed to the next section which focuses on robust methods to determine the robust procedure suitable for use in our data set.
In Chapter 3, a novel approach to identify the spatial daily torrential rainfall patterns in Peninsular Malaysia is discussed. We clarify the issues related to the high dimensional data which explain the typical methods used in hydrology area and from there, we propose a robust method that is more appropriate to our data set. Simulation procedure is also included in this chapter to assess the performance of the robust PCA. Afterwards, Chapter 4 present and discuss the results for original torrential rainfall data in identifying the spatial torrential rainfall patterns using robust PCA. In this chapter, we also compare the results from PCA and robust PCA. We also present and discuss the results of simulated data for assessing the performance robust PCA. The results of simulated data could be used as guide to analyze the original torrential rainfall data.
Simulation procedure is also included in this chapter to assess the performance of the modification of SSA. Further, Chapter 6 is present and discusses the results for original torrential rainfall data in identifying the temporal torrential rainfall patterns using modified SSA. This chapter also compared the results from SSA and modified SSA. We also present and discuss the results of simulated data for assessing the performance of modified SSA. The results of simulated data could be used as guide to analyze the original time series of the torrential rainfall data.
From this research, some results have been published/accepted/submitted in journals and presented in the international conferences as listed in the following:
B1 Journal
Shaharudin, S.M., Ahmad, N., and Yusof, F. (2013). The Comparison of T-Mode and Pearson Correlation Matrices in Classification of Daily Rainfall Patterns in Peninsular Malaysia. Matematika. 29(1c), 187-194.
Shaharudin, S.M., Ahmad, N., and Yusof, F. (2013). Improved Cluster Partition in Principal Component Analysis Guided Clustering. International Journal of Computer Applications. 75(11), 22-25.
B2 Conference Proceedings (Scopus)
Shaharudin, S.M., Ahmad, N., and Yusof, F. (2015). Effect of Window Length with Singular Spectrum Analysis in Extracting the Trend Signal on Rainfall Data. Proceedings of the International Statistical Conference (ISM,2014). 12-14 August. Kuantan, Pahang, 321-326.
B3 Conference Proceedings
Shaharudin, S.M., Ahmad, N., and Yusof, F. (2015). Patterns of Daily Torrential Monsoon Rainfall in Peninsular Malaysia based on a Robust Correlation Measure. Proceedings of the International Conference on Applied Analysis and Mathematical Modeling. 8-12 June. Istanbul, Turki.
Shaharudin, S.M., Ahmad, N., and Yusof, F. (2016). Classification of Daily Torrential Rainfall Patterns in Peninsular Malaysia based on a Robust Correlation Measure. Proceedings of the International Conference on Computational Physics, Mathematics and It’s Application. 7-8 November.
Khaleghi, M., Zeinivand, H., and Moradipour, S. (2014). Rainfall and River Discharge Trend Analysis: A Case Study of Jajrood Watershed, Iran. International Bulletin of Water Resources and Development. 2(3).
Khan, M.A.R, and Poskitt, D.S. (2013). Moment tests for Window Length Selection in Singular Spectrum Analysis of Short- and Long-Memory Processes. Journal of Time Series Analysis, 34(2), 141-155.
Khan, M.A.R., and Poskitt, D.S(2013). A Note on Window Length Selection In Singular Spectrum Analysis. Aust. New Zeal. J. Stat. 55(2), 87-108.
Khan, M.A.R., and Poskitt, D.S. (2011). Window Length Selection and Signal-Noise Separation and Reconstruction in Singular Spectrum Analysis .Working Paper, Monash University.
Kondo, Y. (2009). Robustification of the Sparse K-Means Clustering Algorithm. Master. The University of British Columbia.
Kondo, Y., Salibian-Barrera, M., and Zamar, R. (2012). A Robust and Sparse K-means Clustering Algortihm. arXiv:1201.6082v1.
Koumare, I. (2014). Temporal/Spatial Distribution of Rainfall and the Associated Circulation Anomalies over West Africa. Pakistan Journal of Meteorology. 10(20), 1-11.
Kovacs, F., Legany, C., and Babos, A. (2005). Cluster Validity Measurement Techniques. 6th International Symposium of Hungarian Researchers on Computational Intelligence.
Lee, H.S. (2015). General Rainfall Patterns in Indonesia and the Potential Impacts of Local Seas on Rainfall Intensity Water. 7, 1751-1768.
Li, G., and Chen, Z. (1985). Projection-Pursuit Approach to Robust Dispersion Matricesand Principal Components: Primary theory and Monte Carlo. Journal of the American Statistical Association. 80 (391), 759-766.
Liew, A.W.-C., and Yan, H. (2009). Reliable Detection of Short Periodic Gene Expression Time Series Profiles in DNA Microarray Data. Proceedings of the 2009 IEEE International Conference on Systems, Man, and Cybernetics. October. San Antonio, USA, 4274-4279.
Marques, C.A.F, Ferreira, J.A., Rocha, A., Castanheira, J.A., Melo-Goncalves, P., Vaz, N., and Dias, J.M. (2006). Singular Spectrum Ananlysis and Forecasting of Hydrological Time Series, Physics and Chemistry of the Earth. 31(18), 1172-1179.
Maslennikova, Y.S., and Bochkarev, V.V. (2012). Training Algorithm for Neuro-Fuzzy Based on Singular Spectrum Analysis. World Conference on Information Technology. 14-16 November. Barcelona, Spain, 606-610.
Meng, J., and Yang, Y. (2012). Symmetrical Two-Dimensional PCA with Image Measures in Face Recognition. Int J Adv Robotic Sy. 9.
Mierlus-Mazilu (2010).On Generalized Pareto Distributions. Romanian Journal of Economic Forecasting. 8, 107-117.
Mika, J., Kim, B.-J., and Park, J.-K.(2006). Classification of Daily Precipitation Patterns in South Korea using Multivariate Statistical Methods. Journal of the Environmental Sciences. 1125-1139.
Mills, G.F. (1995). Principal Component Analysis of Precipitation and Rainfall Regionalization in Spain.Theoretical and Applied Climatology. 50, 169-183. Mimmack, G.M., Mason S.J., and Galpin, J.S. (2002). Choice of Distance Matrices
in Cluster Analysis : Defining Regions. Journal of Climate. 14, 2790-2797. Moller, S.F., Frese, J.V., and Bro, R. (2005). Robust Methods for Multivariate Data
Analysis. Journal of Chemometrics. 19, 549-563.
Mondal, A., Kundu, S., and Mukhopadhyay, A. (2012). Rainfall Trend Analysis by Mann-Kendall Test: A Case Study of North-Eastern Part of Cuttack District, Orissa. International Journal of Geology, Earth and Environmental Sciences. 2(1), 70-78.
Montfort, M.A.J.V., and Witter, J.V. (1986). The Generalized Pareto Distribution Applied to Rainfall Dephts. Hydrological Sciences Journal. 31(2), 151-162. Moron, V., Robertson, A. W., Qian, J.-H., and Ghil, M. (2015). Weather Types
Across the Maritime Continent: from the Diurnal Cycle to Interannual Variations. Frontiers in Environmental Science. 3(44).
Munoz-Diaz, D., and Rodrigo, F.S. (2004). Spatio-Temporal Patterns of Seasonal Rainfall in Spain (1912-2000) using Cluster and Principal Component Analysis: Comparison. Annales Geophysicae. 22, 1435-1448.
Neal, R.A., and Phillips, I.D. (2009). Summer Daily Precipitation Variability over the East Anglian Region of Great Britain. International Journal of Climatology. 29, 1661-1679.
Nojumuddin, N.S., Yusof, F., and Yusof, F., and Yusop, Z. (2015). Identification of Rainfall Patterns in Johor. Applied Mathematical Sciences. 9(38), 1869-1888. Norman, C. (1987). Analyzing Multivariate Data. SanDiego:Harcourt Brace Jovanovich.
Owen, M. (2010).Tukey'sBiweight Correlation and the Breakdown. Thesis.Pomona College.
Pelczer, I.J., and Cisneros-Iturbe, H.L. (2008). Identification of Rainfall Patterns over the Valley of Mexico.International Conference on Urban Drainage. Edinburgh, Scotland, 1-9.
Penarrocha, D., Estrela, M.J., and Millan, M. (2002). Classification of Daily Rainfall Patterns in a Mediterranean Area with Extreme Intensity Levels: The Valencia Region. Internation Journal of Climatology.22,677-695.
Priya, R.L., and Manimannan, G. (2014). Rainfall Fluctuation and Region Wise Classification in Tamilnadu: Using Geographical Information System. IOSR Journal of Mathematics. 10(5), 5-12.
Ramos, M.C. (2001). Divisive and Hierarchical Clustering Techniques to Analyse Variability of Rainfall Distribution Patterns in A Mediterranean Region. Atmospheric Research. 57(2), 123-138.
Rexstad, E.A., Miller, D.D., Flather, C.H., Anderson, E.M., Hupp, J.W., and Anderson, D.R.(1988).Questionable Multivariate Statistical Inference in Wildlife Habitat and Community Studies Journal of Wildlife Management. 52, 794-798.
Richman, M.B.(1986). Rotation of Principal Components. J.Climatol. 6, 293-335. Rizwan, M., and Kim, T.-W. (2013). Application of a Mixed Gumbel Distribution to
Construct Rainfall Depth-Duration-Frequency (DDF) Curves Considering Outlier Effect in Hydrologic Data. IOSR Journal of Environmental Science. 6 (2), 54-60.
Romero, R., Ramis, C., and Guijarro, J.A. (1999). Daily Rainfall Patterns in the Spanish Mediterranean Area: An Objective Classification. International Journal of Climatology.19, 95-112.
Romero, R., Summer, G., Ramis, C., and Genoves, A. (1999). A Classification of the Atmospheric Circulation Patterns Producing Significant Daily Rainfall in the Spanish Mediterranean Area. Int. J. Climatol. 19, 765-785.
Rousseeuw, P., and Leroy, A. (1987). Robust Regression and Outlier Detection. New York, USA: John Wiley and Sons, Inc.
Rousseeuw, P., and Van Driessen, K. (1999). A Fast Algorithm for the Minimum Covariance Determinant Estimator. Technometrics.41, 212–223.
Rousseeuw, P.J. (1985). Multivariate Estimation with High Breakdown Point. Mathematical Statistics and Applications.
SaeedSoltani*, and Modarres, R.(2006). Classification of Spatio -Temporal Pattern of Rainfall in Iran using A Hierarchical and Divisive Cluster Analysis. Journal of Spatial Hydrology. (2), 1-12.
Siva, G.S., Rao, V.S., and Babu, D.R. (2014). Cluster Analysis Approach to Study the Rainfall Pattern in Visakhapatnam District. Weekly Science Research Journal. 1(31).
Stathis, D., and Myronidis, D. (2009). Principal Component Analysis of Precipitation in Thessaly Region (Central Greece). Global NEST Journal. 11(4), 467-476. Suhaila, J., and Jemain, A. A. (2007). Fitting Daily Rainfall Amount in Malaysia
using the Normal Transform Distribution. Journal of Applied Sciences. 7(14), 1880-1886.
Sumner, G. (1996). Daily precipitation patterns over Wales: Towards a Detailed Precipitation Climatology. Transactions of the Institute of British Geographer. 21(1), 157–176.
Sumner, G., Guijarro. J.A., and Ramis, C. (1995). The Impact of Surface Circulations on the Daily Rainfall over Mallorca. International Journal of Climatology. 15, 673–696.
Teodoro, P.E., O.-Junior, J.F.D., Cunha, E.R.D., Correa, C.C.G.C, Torres, F.E., Bacani, V.M., Gois, G., and Ribeiro, L.P. (2015). MeteorolAtmos Phys. DOI 10.1007/s00703-015-0408-y.
Turkes, M., Koc, T., and Saris, F.(2009). Spatiotemporal Variability of Precipitation Total Series over Turkey. International Journal of Climatology. 29(8), 1056-1074.
Vautard, R., and Ghil, M. (1989). Singular Spectrum Analysisin Nonlinear Dynamics, with Applications to Paleoclimatic time series. Physica D. 35, 395– 424.
Wasowicz, P., Pasierbinski, A., Przedpelska-Wasowicz, E.M., and Kristinsson, H. (2014). Distribution Patterns in the Native Vascular Flora of Iceland. Plos One. 9(7), e102916. doi:10.1371/journal.pone.0102916.
Weare, B. C., and Nasstrom, J. S. (1982). Examples of Extended Empirical Orthogonal Functions. Monthly Weather Review.110, 481–485.
White, D., Richman, M., and Yarnal, B. (1991). Climate Regionalization and Rotation of Principal Components. Int.J. Climatol. 11, 1–25.
Wickramagamage, P. (2010). Seasonality and spatial pattern of rainfall of Sri Lanka: Exploratory factor analysis. International Journal of Climatology. 30, 1235-1245.
Widmann, M., and Schar, C. (1997). A Principal Component and Long-Term Trend Analysis of Daily Precipitation in Switzerland. International Journal of Climatology. 17, 1333-1356.
Xu, T., Croke, B., Hutchinson, M. (2014). Identification of Spatial and Temporal Patterns of Australian Daily Rainfall under a Changing Climate. 7th Int. Congress on Env.Modelling and Software.15-19 June. San Diego, California, USA, 1-8.
Zhigljavsky, A., Hassani, H., and Heravi, S. (2009). Forecasting European Industrial Production with Singular Spectrum Analysis. International Journal of Forecasting. 25(1), 103-118.
Zotov, L.V.(2012). Application of Multichannel Singular Spectrum Analysis to Geophysical Fields and Astronomical Images. Advances in Astronomy and Space Physics. 2, 82-84.