Software Improvement Model Based on
Complexity Optimization for IT Industry
T.B.Patil
1, S.D.Joshi
21
M.Tech Student , Dept. of Computer Science, Bharati Vidyapeeth Deemed University, College of Engineering, Pune,
Maharashtra, India
2
Professor, Dept. of Computer Science, Bharati Vidyapeeth Deemed University, College of Engineering, Pune,
Maharashtra, India
ABSTRACT: Over the last few decades technology has changed the face of the entire universe. It is needed in almost all
the sectors that exist be it banking, research, medical, engineering. Everything is getting automated in order to minimize the human errors and dependencies on few bright minded persons. Technology can be the biggest supporter in this era, but we cannot deny with the fact that technology can even mess up everything if not taken care of. There are many examples which show the failure of technology and the results were very horrible. So it is the duty of those developers to pay extra attention while coding and fix even the smallest bugs present in the code and for that purpose we are proposing a very simple but efficient tool which will check for the basic quality level of the product and suggest the areas on which they can improve the quality level of the product.
KEYWORDS: Design Phase, Implementation Phase, KPA, Planning Phase, Security Phase, Six Sigma, Software Metric
I. INTRODUCTION
Developing a software involves many essential processes to carry out simultaneously. One software development lifecycle id divided into many smaller phases (Requirement, Planning, Designing, Implementation etc.). For a software each and every phase is equally important and thus the process is required to be checked at all the stages to improve the overall quality of the product.
II. RELATED WORK
SIX SIGMA[1]
Six sigma is already existing statistical approach which on the basis of some mathematic calculation tries to make an error free product. It contains six stages and reduces shortcoming stage by stage.
Limitations of Six Sigma: The limitation of Six Sigma can be given as following.
Six Sigma is a statistically-based process improvement methodology.
Often it is very difficult for small companies to take employees away from their regular duties in order to be
trained in Six Sigma. If employees are not available to give their services, the company loses money due to a reduction in productivity.
Six Sigma focuses on prioritizing and solving specific problem which are selected based on the strategies
priorities of
the company and the problems which are causing the most defects.
III. PRAPOSED ALGORITHM
which can be easily used by the developers without any formal training. This will reduce the extra burden of giving training to the employee.
We have mainly focused on four important phases of software development life cycle as listed below:-
i. Planning
ii. Design
iii. Security
iv. Implementation
Apart from the four phases given above, this tool also focus on some of the crucial code testing (i.e Code Complexity and Coded UI testing).For each of the above written phases we have designed a simple GUI for testing. Based on the quality questions, answered by the tester KPA (Answering Criteria Percentage) is calculated using an algorithm
KPA[3]
KPA stands for Answering Criteria Percentage which calculates the average success percentage of each phase.
KPA = (No. of answering per criteria) (No. of questions – No. of N/A answer)
*NOTE
Number of answer of “NO” or “PARTIALLY” will be treated as areas for improvement.
On the basis of the KPA actual suggestions and scope of improvement will be calculated. Those suggestions are shown to the users along with the graphical representation of actual success percentage and expected success percentage.
Fig.1
(Suggestion shown after the completion of Requirement Phase along with Actual Success Percentage & Success Percentage After Improvement )
IV. PLANNING PHASE
the inputs given by users an area of improvement is given along with the actual success percent of the phase if no improvisation is done in the phase.
Fig.2
(Shows the questions related to planning phase)
V. SECURITY AUDIT
The main purpose of including this section in the project is to actually take care of the mistakes normally developers done while writing a code. Actual code is tested in this section for the encryption functions used, for encryption keys used, for the correct handling of connection with the database.
Fig.3
(Images shows on which parameters security audit is evaluated)
After getting the actual values these are the few summaries shown to the user.
Fig.4
(Shows the suggestions given to the user after security audit)
Above shown the summary of the Security Audit which can be referred by the developers to improve the overall product in terms of security.
VI. CODE COMPLEXITY
Code complexity is included in this section just to enhance the overall performance of the product in terms of the response time for any process to perform and total space consumed by the product. If any product creates unnecessary memory problem or takes unnecessary extra time to perform operations than simply that product is of no use.
So to calculate the overall code complexity we introduced this section on which we actually calculate the total space and time complexity of the code.
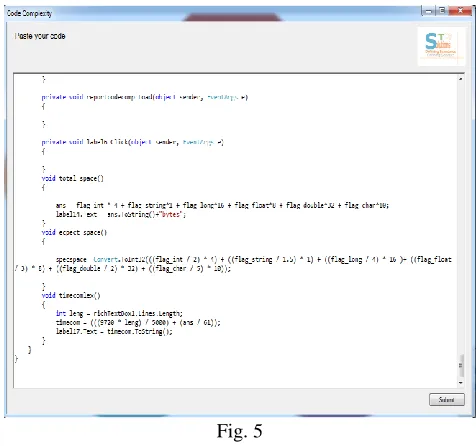
Below is the screenshot of the GUI of code complexity section.
Fig. 5
(Shows the code fragments to be pasted to find the code complexity)
In the above image it can be seen that it asks for the entire code fragment of the project. Once the code is submitted, it then gets evaluated on different parameters, like :-
1. Total number of If conditions used
2. Total number of while loops used
6. Total number of integers used 7. Total number of string used 8. Total number of float used
9. Total number of double used
10. Total number of char used
11. Total number of long used
12. Total number of functions used
13. Total dynamic allocations used
Estimated space is calculated on the basis of total variables declared in the program.
Fig.6
(Shows how summary after the evaluation of code)
VII. SECURITY PHASE
Fig.7
(Shows the security suggestion form contains summary graph and list of areas of improvement)
As the image shown above you can clearly distinguish between the actual success percentage and success percentage after improvement. Below the graph there is a section called area of improvement which shows the areas in which the project is lacking behind.
VIII. IMPLEMENTATION
Implementation phase is probably the last phase of the entire life cycle of a software development model. In this phase the project is finally deployed to the client side. All documentation and tools the client uses to make well-versed decisions regarding how to deploy you software firmly. The KT (Knowledge Transfer) to the customer is done in this phase. Customers reviews are taken in order to improve the overall product of improve the software development process.
At this stage, the Implementation phase is when you begin development finest practices to notice and eliminate security and privacy issues near the beginning in the development cycle. The principle of the Implementation Phase should is to deploy and allow operations of the newest information system in the production environment.
IX. CONCLUSION
Fig.8
(Shows the overall summary of the entire project)
X. FUTURE WORK
Requirement phase will be tested with SRS diagrams.
Questions bank will be created so that more relevant questions can be framed.
REFERENCES
1. Mamta Shelpar, Sona Malhotra,“Software Process Improvement Model”, Iternational Journal of Advanced Research in Computer Science and Software Engineering, June 2013.
2. D.F.Rico, “ROI of Software Process Improvement”. J.Ross Publication 2004.
3. Ministry of Communications and Information Technology, “Software Process Improvement Standards& Specification” NIC/SD/SPISS V1.0:2009. 4. Ministry of Communications and Information Technology, “Software Process Improvement Standards& Specification” NIC/SD/SPISS V1.0:2009. 5. Ruth Klendauer, Axl Hoffiman, Jan Macro Leimeister and Marina Berkovich, Helmut Krcmar, “Using the IDEAL Software Process Improvement
Model for Implementation of Automotive SPICE,” 2012 IEEE CHASE 2012, Zuric. 6. www.ijarcsse.com