HIGHLIGHTED ARTICLE
GENETICS | INVESTIGATION
Associating Multivariate Quantitative Phenotypes
with Genetic Variants in Family Samples with a
Novel Kernel Machine Regression Method
Qi Yan,* Daniel E. Weeks,†Juan C. Celedón,*,†Hemant K. Tiwari,‡Bingshan Li,§Xiaojing Wang,** Wan-Yu Lin,††Xiang-Yang Lou,‡‡Guimin Gao,§§Wei Chen,*,†,1and Nianjun Liu‡,1
*Division of Pulmonary Medicine, Allergy and Immunology, Department of Pediatrics, Children’s Hospital of Pittsburgh, University of Pittsburgh Medical Center, Pittsburgh, Pennsylvania 15224,†Departments of Human Genetics and Biostatistics, Graduate School of Public Health, University of Pittsburgh, Pennsylvania 15261,‡Department of Biostatistics, University of Alabama at Birmingham, Alabama 35294,§Departments of Molecular Physiology and Biophysics and Neurology, Vanderbilt University Medical Center, Nashville, Tennessee 37232, **Analytics of Metrics Central, Global QARAC Headquarters, ConvaTec, Inc., Greensboro, North Carolina 27409,††Institute of Epidemiology and Preventive Medicine, College of Public Health, National Taiwan University, Taipei, Taiwan,‡‡Department of Biostatistics and Bioinformatics, Tulane University, New Orleans, Louisiana 70112, and§§Department of Public Health Sciences, University of Chicago, Illinois 60637
ABSTRACT The recent development of sequencing technology allows identification of association between the whole spectrum of genetic variants and complex diseases. Over the past few years, a number of association tests for rare variants have been developed. Jointly testing for association between genetic variants and multiple correlated phenotypes may increase the power to detect causal genes in family-based studies, but familial correlation needs to be appropriately handled to avoid an inflated type I error rate. Here we propose a novel approach for multivariate family data using kernel machine regression (denoted as MF-KM) that is based on a linear mixed-model framework and can be applied to a large range of studies with different types of traits. In our simulation studies, the usual kernel machine test has inflated type I error rates when applied directly to familial data, while our proposed MF-KM method preserves the expected type I error rates. Moreover, the MF-KM method has increased power compared to methods that either analyze each phenotype separately while considering family structure or use only unrelated founders from the families. Finally, we illustrate our proposed methodology by analyzing whole-genome genotyping data from a lung function study.
KEYWORDSmultivariate traits; family samples; rare variants; kernel function; linear mixed model
G
ENOME-WIDE association studies (GWASs) have been widely used to identify common single-nucleotide poly-morphisms (SNPs) associated with complex human diseases (Hunteret al.2007; Wellcome Trust Case Control Consortium 2007; Yeageret al.2007; Manolioet al.2008; Hindorffet al.2009). In a typical GWAS, large numbers SNPs are geno-typed on hundreds or thousands of subjects, and each SNP is subsequently tested, one by one, for association with the phe-notype of interest. However, this traditional single-marker
association test is not powerful enough to detect rare variants that confer susceptibility to complex diseases (Li and Leal 2008; Schorket al.2009). With the recent development of sequencing technology, identification of rare susceptibility variants for com-plex diseases has become feasible, provided that novel statisti-cal methods are developed to obtain optimal results.
To increase the power to detect association using rare susceptibility variants, many set-based statistics have been developed that evaluate the joint effect of a group of rare genetic variants in a predefined genomic region on the phe-notype of interest (Morgenthaler and Thilly 2007; Li and Leal 2008, 2009; Madsen and Browning 2009; Han and Pan 2010; Morris and Zeggini 2010; Price et al.2010; Linet al.2011, 2012, 2013, 2014). One commonly used method is the se-quence kernel machine–based association test (SKAT) (Wu
et al.2010, 2011; Yanet al.2014, 2015). SKAT is a powerful,
Copyright © 2015 by the Genetics Society of America doi: 10.1534/genetics.115.178590
Manuscript received May 27, 2015; accepted for publication October 4, 2015; published Early Online October 14, 2015.
Supporting information is available online at www.genetics.org/lookup/suppl/ doi:10.1534/genetics.115.178590/-/DC1
1Corresponding authors: Ryals Public Health Bldg., 420A, Birmingham, AL 35294.
flexible, and computationally efficient approach for set-based association testing. To increase power, this kernel machine (KM) method assigns weights to each marker and uses the weighted summation to construct test statistics. In addition, SKAT can easily include nongenetic covariates. Both linear and nonlinear kernels may be used to test the genotype-phenotype relation-ship. Furthermore, SKAT’s test statistic follows a known mixture of chi-square distributions. Thus,P-values can be quickly com-puted analytically without performing resampling.
In genetic studies of complex diseases, multiple correlated phenotypes are often collected. Jointly testing the association between these correlated phenotypes and genetic variants may increase the statistical power to detect causal genes un-derlying complex diseases. Several multivariate approaches developed for this purpose (Verzilliet al.2005; Zapala and Schork 2006; Liuet al.2009; Zhanget al.2010a; Maityet al.
2012) have demonstrated improved statistical power to de-tect susceptibility variants, especially for pleiotropic variants that influence multiple phenotypes (Zhu and Zhang 2009; Sivakumaranet al.2011).
Family-based designs have been used widely in association studies of complex traits (Falk and Rubinstein 1987; Ott 1989; Terwilliger and Ott 1992; Spielman et al. 1993). Although GWASs with unrelated samples often employ general linear models for quantitative phenotypes, this approach can lead to inflated type I error rates in family-based studies if familial correlation is ignored. In family-based studies, a linear mixed model including a random covariate with polygenic effects can account for familial correlations and thus is preferable to a general linear model. In family-based studies, the covariance of random polygenic effects among all subjects is proportional to their kinship coefficients. Linear mixed models with a kinship matrix have been applied commonly in family-based GWASs (Almasy and Blangero 1998; Rabinowitz and Laird 2000; Yu
et al.2006; Kang et al.2010; Zhanget al.2010b). More re-cently, SKAT has been extended to test for quantitative pheno-types in family-based samples by including a kinship matrix (Schifanoet al.2012; Chenet al.2013; Oualkachaet al.2013). Here we develop a new test for gene-based association between rare variants and multiple correlated phenotypes for family-based samples. The recently published MFQLS statistic (Wonet al.2015) is for family-based multivariate association analysis with multiple variants, but it is specifically for com-mon variants. Our proposed method, which uses KM regres-sion and is denoted as MF-KM (for multivariate family data using kernel machine regression), is based on a linear mixed-model framework and can be applied to a large range of studies with different types of traits, such as longitudinal studies. In our simulation studies, we show that a usual KM test (Maityet al.2012) (M-KM, considering the correlation among multiple phenotypes) has inflated type I error rates when applied directly to familial data. In contrast, our MF-KM method preserves the expected type I error rates when employed in family-based samples. Moreover, the MF-KM method has increased power compared to methods that either analyze each phenotype separately (F-KM, which considers
family structure) or use only unrelated founders (M-KM-ind). Finally, we illustrate our proposed methodology by analyzing whole-genome genotyping data from a lung function study.
Materials and Methods
KM regression in a linear mixed-model framework
For KM regression in a linear mixed-model framework on a data set containingnpeople, we assume that then31 vector of the quantitative traityfollows a linear mixed model:
y¼XbþGgþuþe
whereXis ann3pcovariate matrix,bis ap31 parameter vector forfixed effects (an intercept andp–1 covariates),Gis ann3qgenotype matrix forqgenetic markers in the region of interest,gis aq31 vector for the random effects of genetic markers,uis ann31 vector for the random effects of any correlation (e.g., multiple phenotypes or familial structure), andeis ann31 vector for the random error. The random effectgis assumed to follow a normal distribution with mean zero and variance tW, so the null hypothesis we are inter-ested in testing isH0:g= 0, which is equivalent to testingH0:
t= 0. A variance component score test known as the locally most powerful test can be used to test this H0(Wu et al.
2011). The erroreand the random effectsuare also assumed to follow normal distributions and are uncorrelated with each other and withg. To be specific, we assume that
g Nð0;tWÞ
u Nð0; KÞ
e N0;s2EI
whereWis aq3qdiagonal matrix with predefined weights for each variant [such as pffiffiffiffiffiwi¼bðMAFi;1;25Þ (Wu et al.
2011)],Kis ann3ncovariance matrix, ands2
Eis the error
variance component.
Under these assumptions, the variance of the quantitative phenotypeycan be described as
VarðyÞ ¼tGWG9þKþs2EI¼S
Under the null hypothesis, the estimates are
b
S¼Kbþsb2 EI
b
b¼X9Sb1X21X9Sb1y
Following the same rationale as in previous derivations of the score statistic (Zhang and Lin 2003; Liuet al. 2007; Kwee
et al.2008), we have the test statistic
Q¼y2Xbb9Sb21GWG9Sb21y2Xbb (1)
ofyunderH0. The statisticQis a quadratic form ofðy2XbbÞ and follows a mixture of chi-square distributions, although some of the parameters are estimated (Yuan and Bentler 2010; Schifano et al. 2012) underH0. Thus, the P-values can be calculated using different algorithms, such as the moment-matching method (Satterthwaite 1946; Liu et al.
2007), the Davies exact method (Davies 1980), or Kuonen’s saddlepoint method (Kuonen 1999). In this work, we chose to use the Davies method.
KM for quantitative traits in multivariate family data (MF-KM)
The Q statistic derived in Equation (1) can be extended to handle quantitative traits in multivariate family data, denoted as MF-KM. Here the null hypothesis is that the group of genetic variants is not associated with any traits. For sim-plicity of illustration, we consider a data set containing m
individuals and two correlated phenotypes. Under the null hypothesis, H0: t = 0, the model with correlation among phenotypes and familial structure is
y¼Xbþhþe
whereyis a vector of quantitative trait [i.e.,y= (y11,y12,y21,
y22,. . .,ym1,ym2), wheremis the number of individuals],Xb is the fixed effects of covariates,h is the random effect of correlated phenotypes corresponding to the polygenic contri-bution, andeis the random effect of correlated phenotypes corresponding to the random environmental contribution. In our notation, we do not explicitly distinguish families that can be handled implicitly by the kinship matrix in the variance ofh. Since we consider two correlated phenotypes (Bauman
et al.2005),
h N
0;F5
s2
G1 sG12 sG12 s2
G2
e N
0;I5
s2
E1 sE12 sE12 s2
E2
VarðyÞ ¼F5
s2
G1 sG12 sG12 s2
G2
þI5
s2
E1 sE12 sE12 s2
E2
¼S
whereFis twice them3mkinship matrix obtained either from familial relationship or genome-wide data,5is the Kronecker product, and s2
G1,s2G2,sG12,s2E1,s2E2, andsE12
represent the polygenic variances of thefirst and second phenotypes, the polygenic covariance between the two phenotypes, the environmental variances of the first and second phenotypes, and the environmental covariance be-tween the two phenotypes, which can be estimated from the data by using classic optimization methods such as the Nelder-Mead method (Nelder and Mead 1965) or the quasi-Newton method (Broyden 1969; Fletcher 1970; Goldfarb 1970; Shanno 1970), and then the test statistic Qcan be constructed.
Simulation study
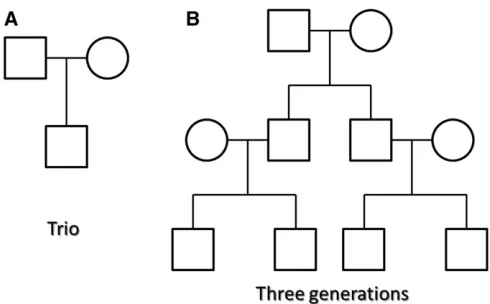
Simulation of sample genotypes: We simulated sample genotypes based on a pool of 10,000 haplotypes over a 200-kb chromosome from a calibrated coalescent model (Schaffner et al. 2005) with linkage disequilibrium (LD) structure mimicking the European ancestry. We simulated family data using two different family structures (Figure 1). First, we simulated 300 trio families with father, mother, and one child (Figure 1A) by randomly selecting 1200 hap-lotypes as the parents’haplotypes. The offspring haplotypes were generated by randomly transmitting one of the two haplotypes of the father and the mother to the child. Simi-larly, we simulated 100 three-generation families with two grandparents, two independent parents who marry into the families, two dependent parents as the offspring of grand-parents, and four children (Figure 1B) by randomly picking two haplotypes for each founder and then randomly picking haplotypes to be transmitted to their descendants. Then we randomly selected 30 rare variants [mean allele frequency (MAF) , 0.05] from the simulated family data over the 200-kb region as one genotype data set. We generated 100 such genotype data sets in the analysis for each of the two family structures.
Type I error rate:To measure type I error rates, for each of the 100 genotype data sets, we simulated 100 sets of a two-dimensional (2D) null phenotype independently of the genotypes. For each trio family, the vector of six quantitative phenotypes for family i was generated via the model
yi¼0:05X1iþ0:5X2iþei
whereX1iis a continuous covariate generated from a normal
distribution with mean 50 and standard deviation 5 that re-peats twice to mimic two phenotypes for each individual. In other words, one single value is drawn from the distribution for one individual, and this value is assigned to both the individual’s phenotype vectors.X2iis a dichotomous
covari-ate genercovari-ated from a Bernoulli distribution with probability
0.5, which is also repeated twice for two phenotypes for each individual;eifollows a multivariate normal distribution with mean vector0and covariance matrix VarðyiÞ
VarðyiÞ ¼Fi5 s2
G1 sG12 sG12 s2
G2 !
þI3335 s2
E1 sE12 sE12 s2
E2 ! ¼ 2 6 4
1 0 0:5
0 1 0:5
0:5 0:5 1
3 7 55
1 0:8 0:8 1
þI3335
1 0:8 0:8 1
wheres2
G1,s2G2,s2E1, ands2E2were set to 1, and the
covari-ancessG12andsE12were set to 0.8. The phenotypes for all the subjects were generated in the same way, and the 100 sets of simulated phenotypes for each of the 100 genotype data sets were used to evaluate the type I error rates. In the sce-nario of families with three generations, the phenotypes were generated in an analogous way, but the kinship matrixFiwas more complicated. Both thefixed-effects and variance param-eters were assumed to be unknown when analyzing the sim-ulated data, and they can be estimated from the simsim-ulated data.
When analyzing the family data, we compared the per-formance of the MF-KM method to four other approaches: (1) family KM ignoring the correlation between traits ap-plied to thefirst and second phenotypes separately (F-KM), (2) multivariate KM without considering familial struc-ture (M-KM), (3) M-KM using independent founders (M-KM-ind), and (4) Fisher’s method (Fisher 1950) com-bining theP-values of F-KM applied to thefirst and second phenotypes, treating the two phenotypes as independent (Fisher-F-KM).
Power evaluation: To evaluate power, we used the same genotypes as described earlier, but we let the phenotypes be associated with the genotypes. We compared the MF-KM
method with F-KM and M-KM-ind. The quantitative pheno-types for one family were generated via the model:
yi50:05X1i10:5X2i1b1G1i1b2G2i1. . .1bkGki1ei
where X1i and X2i are the same as described earlier,
G1i;G2i;. . .;Gki are the genotypes of causal SNPs, and b1;b2;. . .;bkare effect sizes of the causal SNPs. We consid-ered that 30% and 20% of all variants were disease-susceptibility variants and thateiwas determined the same as for the evaluation of type I error rates. Furthermore,
b1;b2;. . .;bkwere set tocjlog10MAFjjin order to assign large
weights to rare variants, wherec = 0.4 was chosen such that when MAF = 0.0001,b ¼1:6 (Wuet al.2011). Because the KM regression could handle both risk and protective variants, we also considered that one-third of the causal variants were protective, which meant thatb¼ 2cjlog10MAFjj(i.e., 20%
disease variants and 10% protective variants and 13% dis-ease variants and 7% protective variants). The phenotypes for all families were generated in the same manner, and these 100 sets of phenotypes for each of the 100 genotype data sets in each family scenario were used to evaluate the power.
Data availability
The MF-KM algorithms have been implemented in R (http:// www.r-project.org/) and the source code is available at (http://www.pitt.edu/qiy17/Softwares.html). File S1 con-tains the R program for MF-KM, README of the program and illustrative examples.
Results
Simulation of the type I error rate
Table 1 lists the empirical type I error rates of MF-KM, F-KM for the first phenotype, F-KM for the second phenotype, M-KM, M-KM using founders (M-KM-ind), and Fisher’s method combining theP-values of F-KM applied to thefirst and second phenotypes (Fisher-F-KM) at a levels of 0.05,
Table 1 Type I error rates of different statistics: multivariate family KM (MF-KM), family KM ignoring the phenotype correlation (F-KM) for the first and second phenotypes, multivariate KM ignoring familial structure (M-KM), M-KM using founders (M-KM-ind), and Fisher’s method combining the F-KMp-values for thefirst and second phenotypes (Fisher-F-KM).
a= 0.05 a= 0.01 a= 0.005 a= 0.001
Trios MF-KM 0.0497 0.0108 0.0051 0.0014
F-KM pheno1 0.0511 0.0113 0.0057 0.0007
F-KM pheno2 0.0473 0.0103 0.0051 0.0012
M-KM 0.0861 0.0211 0.0125 0.0031
M-KM-ind 0.0497 0.0108 0.0047 0.0011
Fisher-F-KM 0.0796 0.0285 0.0192 0.0072
Three generations MF-KM 0.0503 0.0105 0.0049 0.0010
F-KM pheno1 0.0519 0.0104 0.0049 0.0010
F-KM pheno2 0.0496 0.0104 0.0051 0.0010
M-KM 0.1270 0.0384 0.0222 0.0062
M-KM-ind 0.0495 0.0094 0.0051 0.0011
Fisher-F-KM 0.0830 0.0292 0.0200 0.0078
0.01, 0.005, and 0.001 for trio families and families with three generations. The results indicate that the type I error rate is inflated when the M-KM, which ignores familial struc-ture, is applied to correlated samples, even though the cor-relation between phenotypes is modeled. The type I error rate is also inflated when Fisher-F-KM is applied, treating the two correlated phenotypes as independent. In contrast, F-KM, MF-KM, and M-KM-ind retain the correct type I error rates. From the quantile-quantile (QQ) plots in Figure 2, we can see similar patterns. TheP-values are roughly uniformly distributed for MF-KM, F-KM, and M-KM-ind, which indicates that they control type I error rates well, while the type I error rate is inflated for the M-KM applied to correlated samples and for Fisher-F-KM. Comparing the scenarios with two fam-ily structures, the inflation of the M-KM is more severe as the number of correlated samples per family increases.
Statistical power comparison
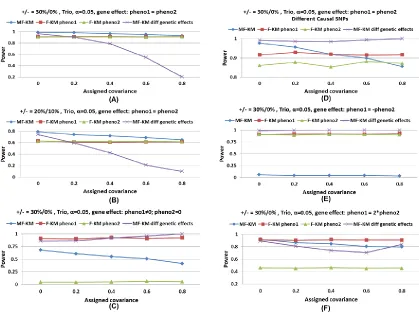
Because M-KM and Fisher-F-KM have inflated type I error rates for related samples, we only investigated the power of MF-KM, F-KM, and M-KM-ind. As shown in Figure 3, the power of MF-KM is consistently higher than that of F-KM (which uses only one phenotype) and M-KM-ind. This is expected because MF-KM makes full use of the data, while, in contrast, F-KM uses only one phenotype at a time, and M-KM uses unrelated founders to preserve correct type I error rates. In the simulation studies, the covariancessG12andsE12 between two phenotypes were set to 0.8. In addition, we variedsG12andsE12so as to study the effect of the correla-tion between phenotypes on the power. As shown in Support-ing Information,Figure S1, the results indicate that MF-KM assuming equal genetic effects on both phenotypes performs best when the correlations between phenotypes are low to
moderate and phenotypes have the same direction of genetic effects and have similar effect size, and MF-KM assuming nonequal genetic effects on both phenotypes performs best when the correlations between phenotypes are moderate to high and phenotypes have different effect size and/or have different direction of effects.
Analysis of genome-wide lung function data
To evaluate the performance of our statistic on a real data set, we applied the method to data from a lung function study (Chenet al.2014, 2015) to carry out gene-based genome-wide association tests of the correlated lung function pheno-types forced expiratory volume in 1 sec. (FEV1) and forced
vital capacity ratio (FEV1/FVC). The data contain 578 Costa
Rican subjects with and without chronic obstructive pulmo-nary disease (COPD), including 316 samples from 13 fami-lies, with 464 subjects being genotyped. The 72 subjects with unconfirmed COPD were excluded. The detailed recruit-ment criteria are described elsewhere (Chenet al.2014). A genome-wide panel of 658,502 SNPs was genotyped, includ-ing 591,381 common variants (MAF$0.05) and 67,121 rare variants (MAF,0.05). We assigned rare variants to a gene if they were located within a 5-kbflank of the gene on either side. In the end, 7064 genes were used in the analysis. We analyzed the association between the correlated two-dimensional FEV1and FEV1/FVC phenotypes and each of the 7064 genes
comprised of rare variants using MF-KM adjusting for age, gen-der, height, and COPD status. The COPD status was included as a covariate to control for potential ascertainment effects because the samples were recruited according to COPD status. In our data set, the Pearson correlation between FEV1and FEV1/FVC is 0.57.
In thefinal analysis, 398 genotyped subjects with full pheno-types were used, but there are still missing genopheno-types. To
handle these, we assigned them to the homozygous reference genotype. In this test, we assumed that the phenotype is caused by rare genetic variants, and thus Wu’s weight (Wu
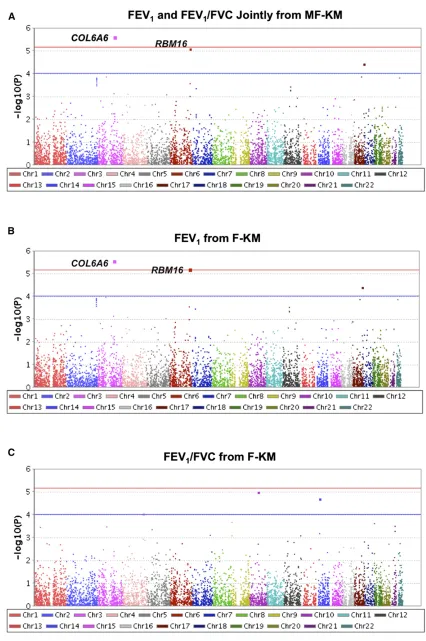
et al.2011) was applied to give rarer variants larger effect sizes. The Manhattan plots ofP-values for genes from MF-KM and F-KM are shown in Figure 4. In these plots, the location of each gene is determined by the location of its first marker. Using the MF-KM statistic, two genes,COL6A6andRBM16
(marginally), were found to be significantly associated with the joint phenotype of FEV1and FEV1/FVC at analevel of
7 3 1026 (which is the Bonferroni-corrected significance
level). Using F-KM, these two genes also were found to be associated with FEV1alone.COL6A6includes 7 rare variants
of 31 genetic variants, andRBM16includes 2 rare variants of 29 genetic variants. The rare alleles in both COL6A6 and
RBM16 seem to be associated with a higher risk for lung function because more individuals with a higher proportion of rare alleles are in the low FEV1and FEV1/FVC area (the
black area in Figure 5) than in the high FEV1and FEV1/FVC
area (the red area in Figure 5). Moreover, COL6A6
(chr.3: 130,274,178–130,400,888) is in the COPD-related re-gions based on the Rat Genome Database (RGD) (Shimoyama
et al.2015). There are two known COPD-related regions,
COPD14_H(chr.3: 36,484,119–175,785,038) andCOPD16_H
(chr.3: 49,418,084–198,022,430).
Discussion
Family-based study designs have been used widely in inves-tigating complex diseases, and hundreds of thousands of
genetic variants, both common and rare, have been genotyped with advances in high-throughput sequencing technology. Thus, appropriate statistical methods are needed for analyz-ing data from these studies while accountanalyz-ing for potential pleiotropic effects. Therefore, here we developed the MF-KM statistic using a linear mixed-model framework to ana-lyze multivariate data with quantitative traits in family-based studies.
MF-KM shares the advantages of other set-based methods, such as improved power and reduced multiple testing by jointly testing a set of genetic variants. Our simulation stud-ies show that MF-KM preserves the desired type I error rates. When multiple phenotypes are available, we show that
MF-KM achieves higher power than commonly used alternate methods. Based on our simulation results, we believe that MF-KM provides a good option for genetic analysis of multivariate data in family-based studies.
The computational time required to implement the MF-KM method depends on sample size, the number of genetic variants, and the complexity of the model being tested under the null hypothesis. In fact, the computational time offitting a model under the null hypothesis may not be critical when performing a genome-wide study. Because MF-KM is a score test, the estimates of fixed-effects coefficients and the co-variance matrix under the null hypothesis are independent of the genetic variants. Therefore, the linear mixed model
Figure 5 Three-dimensional plots of FEV1, FEV1/FVC, and rare allele
load (each point represents a subject) for (A)COL6A6(the total number of rare alleles for each subject is the sum of rare alleles across seven rare genetic variants in this gene) and (B)RBM16(the total number of rare alleles for each subject is the sum of rare alleles across two rare genetic variants in this gene). The black parallelogram indicates the low FEV1and FEV1/FVC area; the red
under the null hypothesis only needs to befitted once. Thebb andSbthen can be saved and reused to construct test statistics for all the genes. Therefore, the total computational time is greatly reduced. However, processing genes takes most of the computational time. If the number of markers in a gene is large, inverting the large matrix is still computationally in-tensive. One way to handle this would be to further group their variants into subgroups such as common or rare non-synonymous or non-synonymous coding variants, as in our pre-vious work (Yiet al.2011), and to also use LD blocks if the subgroups are still large. In addition, we may use fast algo-rithms proposed for linear mixed models, such as EMMA/ EMMAX (Kanget al.2010; Zhanget al.2010b), TASSEL (Zhang
et al. 2010b), and others (Lippert et al. 2011; Svishcheva
et al.2012; Zhou and Stephens 2012, 2014), which would make our approach faster and more efficient. Although the null model needs to befitted only once for a genome-wide study, different initial values may need to be tried so as to
find the maximum-likelihood estimates (MLEs) because the Nelder-Mead method or other optimization methods
find the local maximum. Thus, the computational time also depends on the number of different initial values be-ing tried.
Although the MF-KM method requires certain assump-tions, the framework is general and flexible. For example, nongenetic covariates can be easily incorporated; M-KM is a special case of MF-KM where only unrelated samples are involved. Although kinship coefficients can be obtained di-rectly from the pedigree, if genome-wide genotypes are avail-able, it may be more advantageous to use genetic markers to estimate the kinship coefficients among individuals (Balding and Nichols 1995; Lynch and Ritland 1999; Ritland 2005; Yu
et al. 2006; Kang et al. 2010; Liu et al.2011). Using the estimated kinship coefficients allows us to handle any rela-tionship, known or unknown, in the samples. In behavioral and psychological studies, familial correlation is influenced not only by genetics but also by shared environment, which needs to be considered in addition to kinship coefficients (McGue and Bouchard 1998; Turkheimer and Waldron 2000; Hallmayer et al. 2011). In the presence of a shared environment, our proposed test statistic could yield inflated type I errors, and this could be controlled by including an extra random intercept within families in the null model, but model complexity increases accordingly. In our lung func-tion study, the shared-environmental influence is not as-sumed. Although we have only studied the performance of a linear kernel here, it would be straightforward to use a nonlinear kernel within the flexible KM regression frame-work when a nonlinear association between a disease and genetic variants is assumed.
Acknowledgments
This work was supported in part by the following grants from the National Institutes of Health: HG007358 and R01-EY024226 (to Q.Y. and W.C.); GM-081488, R03-DE024198,
R01-HL092173, and P60-AR064172 (to N.L.); R01-HG006857 (to B.L.); R01-GM073766 (to G.G); National Science Founda-tion grants EPS-1158862 (to Q.Y. and H.K.T.) and 1462990 (to X.L. and N.L.); and HL-073373 and HL-117191 (to J.C.C.); a grant from the Ministry of Science and Technology of Taiwan (102-2628-B-002-039-MY3); and a grant from National Taiwan University (NTU-CESRP-104R7622-8 to W.-Y.L.).
Literature Cited
Almasy, L., and J. Blangero, 1998 Multipoint quantitative-trait
linkage analysis in general pedigrees. Am. J. Hum. Genet. 62:
1198–1211.
Balding, D. J., and R. A. Nichols, 1995 A method for quantifying
differentiation between populations at multi-allelic loci and its implications for investigating identity and paternity. Genetica
96: 3–12.
Bauman, L. E., L. Almasy, J. Blangero, R. Duggirala, J. S. Sinsheimer
et al., 2005 Fishing for pleiotropic QTLs in a polygenic sea.
Ann. Hum. Genet. 69: 590–611.
Broyden, C. G., 1969 A new double-rank minimisation algorithm:
preliminary report. Not. Am. Math. Soc. 16: 670.
Chen, H., J. B. Meigs, and J. Dupuis, 2013 Sequence kernel
asso-ciation test for quantitative traits in family samples. Genet.
Epi-demiol. 37: 196–204.
Chen, W., J. M. Brehm, N. Boutaoui, M. Soto-Quiros, L. Avilaet al.,
2014 Native American ancestry, lung function, and COPD in
Costa Ricans. Chest 145: 704–710.
Chen, W., J. M. Brehm, A. Manichaikul, M. H. Cho, N. Boutaoui
et al., 2015 A genome-wide association study of chronic ob-structive pulmonary disease in Hispanics. Ann. Am. Thorac. Soc.
12: 340–348.
Davies, R., 1980 The distribution of a linear combination of
chi-square random variables. J. R. Stat. Soc. Ser. C Appl. Stat. 29:
323–333.
Falk, C. T., and P. Rubinstein, 1987 Haplotype relative risks: an
easy reliable way to construct a proper control sample for risk
calculations. Ann. Hum. Genet. 51: 227–233.
Fisher, R. A., 1950 Statistical Methods for Research Workers. Oliver
and Boyd, Edinburgh.
Fletcher, R., 1970 A new approach to variable metric algorithms.
Comput. J. 13: 317.
Goldfarb, D., 1970 A family of variable-metric methods derived
by variational means. Math. Comput. 24: 23.
Hallmayer, J., S. Cleveland, A. Torres, J. Phillips, B. Cohenet al.,
2011 Genetic heritability and shared environmental
fac-tors among twin pairs with autism. Arch. Gen. Psychiatry 68:
1095–1102.
Han, F., and W. Pan, 2010 A data-adaptive sum test for disease
association with multiple common or rare variants. Hum. Hered.
70: 42–54.
Hindorff, L. A., P. Sethupathy, H. A. Junkins, E. M. Ramos, J. P.
Mehtaet al., 2009 Potential etiologic and functional
implica-tions of genome-wide association loci for human diseases and
traits. Proc. Natl. Acad. Sci. USA 106: 9362–9367.
Hunter, D. J., P. Kraft, K. B. Jacobs, D. G. Cox, M. Yeager et al.,
2007 A genome-wide association study identifies alleles in
FGFR2 associated with risk of sporadic postmenopausal breast
cancer. Nat. Genet. 39: 870–874.
Kang, H. M., J. H. Sul, S. K. Service, N. A. Zaitlen, S. Y. Konget al.,
2010 Variance component model to account for sample structure
in genome-wide association studies. Nat. Genet. 42: 348–354.
Kuonen, D., 1999 Saddlepoint approximations for distributions of
Kwee, L. C., D. Liu, X. Lin, D. Ghosh, and M. P. Epstein, 2008 A
powerful andflexible multilocus association test for quantitative
traits. Am. J. Hum. Genet. 82: 386–397.
Li, B., and S. M. Leal, 2008 Methods for detecting associations
with rare variants for common diseases: application to analysis
of sequence data. Am. J. Hum. Genet. 83: 311–321.
Li, B., and S. M. Leal, 2009 Discovery of rare variants via
sequenc-ing: implications for the design of complex trait association studies. PLoS Genet. 5: e1000481.
Lin, W. Y., B. Zhang, N. Yi, G. Gao, and N. Liu, 2011 Evaluation of
pooled association tests for rare variant identification. BMC
Proc. 5(Suppl. 9): S118.
Lin, W. Y., N. Yi, D. Zhi, K. Zhang, G. Gaoet al., 2012
Haplotype-based methods for detecting uncommon causal variants with
common SNPs. Genet. Epidemiol. 36: 572–582.
Lin, W. Y., N. Yi, X. Y. Lou, D. Zhi, K. Zhanget al., 2013 Haplotype
kernel association test as a powerful method to identify chro-mosomal regions harboring uncommon causal variants. Genet.
Epidemiol. 37: 560–570.
Lin, W. Y., X. Y. Lou, G. Gao, and N. Liu, 2014 Rare variant
association testing by adaptive combination of P-values. PLoS
One 9: e85728.
Lippert, C., J. Listgarten, Y. Liu, C. M. Kadie, R. I. Davidsonet al.,
2011 FaST linear mixed models for genome-wide association
studies. Nat. Methods 8: 833–835.
Liu, D., X. Lin, and D. Ghosh, 2007 Semiparametric regression of
multidimensional genetic pathway data: least-squares kernel
machines and linear mixed models. Biometrics 63: 1079–1088.
Liu, J., Y. Pei, C. J. Papasian, and H. W. Deng, 2009 Bivariate
association analyses for the mixture of continuous and binary traits with the use of extended generalized estimating
equa-tions. Genet. Epidemiol. 33: 217–227.
Liu, N., H. Zhao, A. Patki, N. A. Limdi, and D. B. Allison,
2011 Controlling population structure in human genetic
asso-ciation studies with samples of unrelated individuals. Stat.
In-terface 4: 317–326.
Lynch, M., and K. Ritland, 1999 Estimation of pairwise
related-ness with molecular markers. Genetics 152: 1753–1766.
Madsen, B. E., and S. R. Browning, 2009 A groupwise association
test for rare mutations using a weighted sum statistic. PLoS Genet. 5: e1000384.
Maity, A., P. F. Sullivan, and J. Y. Tzeng, 2012 Multivariate
phe-notype association analysis by marker-set kernel machine
re-gression. Genet. Epidemiol. 36: 686–695.
Manolio, T. A., L. D. Brooks, and F. S. Collins, 2008 A HapMap
harvest of insights into the genetics of common disease. J. Clin.
Invest. 118: 1590–1605.
McGue, M., and T. J. Bouchard, Jr.., 1998 Genetic and
environ-mental influences on human behavioral differences. Annu. Rev.
Neurosci. 21: 1–24.
Morgenthaler, S., and W. G. Thilly, 2007 A strategy to discover genes
that carry multi-allelic or mono-allelic risk for common diseases: a
cohort allelic sums test (CAST). Mutat. Res. 615: 28–56.
Morris, A. P., and E. Zeggini, 2010 An evaluation of statistical
approaches to rare variant analysis in genetic association
stud-ies. Genet. Epidemiol. 34: 188–193.
Nelder, J. A., and R. Mead, 1965 A simplex-method for function
minimization. Comput. J. 7: 308–313.
Ott, J., 1989 Statistical properties of the haplotype relative risk.
Genet. Epidemiol. 6: 127–130.
Oualkacha, K., Z. Dastani, R. Li, P. E. Cingolani, T. D. Spectoret al.,
2013 Adjusted sequence kernel association test for rare
vari-ants controlling for cryptic and family relatedness. Genet.
Epi-demiol. 37: 366–376.
Price, A. L., G. V. Kryukov, P. I. de Bakker, S. M. Purcell, J. Staples
et al., 2010 Pooled association tests for rare variants in
exon-resequencing studies. Am. J. Hum. Genet. 86: 832–838.
Rabinowitz, D., and N. Laird, 2000 A unified approach to
adjust-ing association tests for population admixture with arbitrary pedigree structure and arbitrary missing marker information.
Hum. Hered. 50: 211–223.
Ritland, K., 2005 Multilocus estimation of pairwise relatedness
with dominant markers. Mol. Ecol. 14: 3157–3165.
Satterthwaite, F. E., 1946 An approximate distribution of
esti-mates of variance components. Biometrics 2: 110–114.
Schaffner, S. F., C. Foo, S. Gabriel, D. Reich, M. J. Daly et al.,
2005 Calibrating a coalescent simulation of human genome
sequence variation. Genome Res. 15: 1576–1583.
Schifano, E. D., M. P. Epstein, L. F. Bielak, M. A. Jhun, S. L. Kardia
et al., 2012 SNP set association analysis for familial data.
Genet. Epidemiol. 36: 797–810.
Schork, N. J., S. S. Murray, K. A. Frazer, and E. J. Topol,
2009 Commonvs.rare allele hypotheses for complex diseases.
Curr. Opin. Genet. Dev. 19: 212–219.
Shanno, D. F., 1970 Conditioning of quasi-Newton methods for
function minimization. Math. Comput. 24: 647.
Shimoyama, M., J. De Pons, G. T. Hayman, S. J. Laulederkind, W. Liu et al., 2015 The Rat Genome Database 2015: genomic, phenotypic and environmental variations and disease. Nucleic
Acids Res. 43: D743–D750.
Sivakumaran, S., F. Agakov, E. Theodoratou, J. G. Prendergast, L.
Zgaga et al., 2011 Abundant pleiotropy in human complex
diseases and traits. Am. J. Hum. Genet. 89: 607–618.
Spielman, R. S., R. E. McGinnis, and W. J. Ewens, 1993 Transmission
test for linkage disequilibrium: the insulin gene region and
insulin-dependent diabetes mellitus (IDDM). Am. J. Hum. Genet. 52: 506–
516.
Svishcheva, G. R., T. I. Axenovich, N. M. Belonogova, C. M. van
Duijn, and Y. S. Aulchenko, 2012 Rapid variance
components-based method for whole-genome association analysis. Nat.
Genet. 44: 1166–1170.
Terwilliger, J. D., and J. Ott, 1992 A haplotype-based“haplotype
relative risk” approach to detecting allelic associations. Hum.
Hered. 42: 337–346.
Turkheimer, E., and M. Waldron, 2000 Nonshared environment: a
theoretical, methodological, and quantitative review. Psychol.
Bull. 126: 78–108.
Verzilli, C. J., N. Stallard, and J. C. Whittaker, 2005 Bayesian
modelling of multivariate quantitative traits using seemingly
unrelated regressions. Genet. Epidemiol. 28: 313–325.
Wellcome Trust Case Control Consortium, 2007 Genome-wide
association study of 14,000 cases of seven common diseases
and 3,000 shared controls. Nature 447: 661–678.
Won, S., W. Kim, S. Lee, Y. Lee, J. Sung et al., 2015 Family-based
association analysis: a fast and efficient method of multivariate
as-sociation analysis with multiple variants. BMC Bioinformatics 16: 46.
Wu, M. C., P. Kraft, M. P. Epstein, D. M. Taylor, S. J. Chanocket al.,
2010 Powerful SNP-set analysis for case-control genome-wide
association studies. Am. J. Hum. Genet. 86: 929–942.
Wu, M. C., S. Lee, T. Cai, Y. Li, M. Boehnke et al., 2011
Rare-variant association testing for sequencing data with the
se-quence kernel association test. Am. J. Hum. Genet. 89: 82–93.
Yan, Q., H. K. Tiwari, N. Yi, W. Y. Lin, G. Gaoet al., 2014
Kernel-machine testing coupled with a rank-truncation method for
ge-netic pathway analysis. Genet. Epidemiol. 38: 447–456.
Yan, Q., H. K. Tiwari, N. Yi, G. Gao, K. Zhang et al., 2015 A
sequence kernel association test for dichotomous traits in family samples under a generalized linear mixed model. Hum. Hered.
79: 60–68.
Yeager, M., N. Orr, R. B. Hayes, K. B. Jacobs, P. Kraft et al.,
2007 Genome-wide association study of prostate cancer
iden-tifies a second risk locus at 8q24. Nat. Genet. 39: 645–649.
Yi, N., N. Liu, D. Zhi, and J. Li, 2011 Hierarchical generalized
jointly estimating group and individual-variant effects. PLoS Genet. 7: e1002382.
Yu, J., G. Pressoir, W. H. Briggs, I. Vroh Bi, M. Yamasaki et al.,
2006 A unified mixed-model method for association mapping
that accounts for multiple levels of relatedness. Nat. Genet. 38:
203–208.
Yuan, K. H., and P. M. Bentler, 2010 Two simple approximations
to the distributions of quadratic forms. Br. J. Math. Stat. Psychol.
63: 273–291.
Zapala, M. A., and N. J. Schork, 2006 Multivariate regression
analysis of distance matrices for testing associations between gene expression patterns and related variables. Proc. Natl. Acad.
Sci. USA 103: 19430–19435.
Zhang, D., and X. Lin, 2003 Hypothesis testing in semiparametric
additive mixed models. Biostatistics 4: 57–74.
Zhang, H., C. T. Liu, and X. Wang, 2010a An association test for
multiple traits based on the generalized Kendall’s TAU. J. Am.
Stat. Assoc. 105: 473–481.
Zhang, Z., E. Ersoz, C. Q. Lai, R. J. Todhunter, H. K. Tiwariet al.,
2010b Mixed linear model approach adapted for genome-wide
association studies. Nat. Genet. 42: 355–360.
Zhou, X., and M. Stephens, 2012 Genome-wide efficient
mixed-model analysis for association studies. Nat. Genet. 44: 821–824.
Zhou, X., and M. Stephens, 2014 Efficient multivariate linear
mixed model algorithms for genome-wide association studies.
Nat. Methods 11: 407–409.
Zhu, W., and H. Zhang, 2009 Why do we test multiple traits in
genetic association studies? J. Korean Stat. Soc. 38: 1–10.
GENETICS
Supporting Information www.genetics.org/lookup/suppl/doi:10.1534/genetics.115.178590/-/DC1
Associating Multivariate Quantitative Phenotypes with
Genetic Variants in Family Samples with a
Novel Kernel Machine Regression Method
Qi Yan, Daniel E. Weeks, Juan C. Celedón, Hemant K. Tiwari, Bingshan Li, Xiaojing Wang, Wan-Yu Lin, Xiang-Yang Lou, Guimin Gao, Wei Chen, and Nianjun Liu

![Figure 2 QQ plots of the P-values from the simulations for type I error rate, with 95% pointwise confidence band (gray area) that is computed underthe assumption of the P-values being drawn independently from a uniform [0, 1] distribution.](https://thumb-us.123doks.com/thumbv2/123dok_us/1535128.1188244/5.603.59.547.46.273/simulations-pointwise-condence-computed-underthe-assumption-independently-distribution.webp)