Evaluation of RAPID for a UNF cask benchmark problem
Valerio Mascolino1,a, Alireza Haghighat1,b, and Nathan J. Roskoff1,c
1Nuclear Science & Engineering Lab (NSEL), Virginia Tech, 900 N Glebe Rd., Arlington, VA, 22203
Abstract. This paper examines the accuracy and performance of the RAPID (Real-time Analysis for Particle transport and In-situ Detection) code system for the simulation of a used nuclear fuel (UNF) cask. RAPID is capable of determining eigenvalue, subcritical multiplication, and pin-wise, axially-dependent fission density throughout a UNF cask. We study the source convergence based on the analysis of the different parameters used in an eigenvalue calculation in the MCNP Monte Carlo code. For this study, we consider a single as-sembly surrounded by absorbing plates with reflective boundary conditions. Based on the best combination of eigenvalue parameters, a reference MCNP solution for the single assembly is obtained. RAPID results are in excellent agreement with the reference MCNP solutions, while requiring significantly less computation time (i.e., minutes vs. days). A similar set of eigenvalue parameters is used to obtain a reference MCNP solution for the whole UNF cask. Because of time limitation, the MCNP results near the cask boundaries have significant uncertainties. Except for these, the RAPID results are in excellent agreement with the MCNP predictions, and its computation time is significantly lower, 35 second on 1 core versus 9.5 days on 16 cores.
1 Introduction
To ensure criticality safety and maintain a high level of security of Used Nuclear Fuel (UNF), it is neces-sary to perform detailed Particle Transport simulations. The commonly used technique is the 3-D, continuous en-ergy Monte Carlo method that is time-consuming and, for eigenvalue calculations, may have difficulties with the source convergence [1, 2]. Wenner and Haghighat [2] and Dufek [3] demonstrated that in criticality problems with high dominance ratio and/or under-sampling possibilities, the fission matrix (FM) methodology [1] should be used in order to be able to obtain unbiased solution.
The RAPID (Real-time Analysis for Particle transport and In-situ Detection) code system [4] is based on the Multi-stage Response-function Transport (MRT) method-ology [5], and uses the FM formulation to determine eigenvalue, subcritical multiplication and fission density distribution of nuclear systems. This paper uses a bench-mark problem similar to the GBC-32 Cask [6] to evaluate the accuracy and performance of RAPID against the re-sults of a reference MCNP [7] solution. We performed a detailed sensitivity analysis on a single-assembly model in order to determine the MCNP eigenvalue parameters nec-essary to obtain a reliable reference solution. These results provided a guide for the selection of an appropriate set of parameters for the eigenvalue calculation for the whole cask.
The paper is organized as follows. Section 2 discusses the RAPID code system and its MRT approach. Section 3
ae-mail: [email protected] be-mail: [email protected] ce-mail: [email protected]
introduces the benchmark problem. Section 4 introduces the methodology used to analyze results. Section 5 dis-cuss the results of different cases to identify the best set of eigenvalue parameters, and compares the selected case with the RAPID calculation. Section 6 gives the conclu-sions and future work perspectives.
2 RAPID Code System
To overcome the source convergence difficulty and com-putational effort of straightforward eigenvalue Monte Carlo calculations, the RAPID code system has been de-veloped based on the MRT methodology. For a UNF pool or cask, RAPID is capable of quickly and accurately calcu-lating eigenvalue, subcritical multiplication, pin-wise, axi-ally dependent fission densities, and detector responses for monitoring a pool or cask. RAPID uses the Fission Matrix (FM) method for eigenvalue calculations, and the adjoint function methodology for the detector response calcula-tions. RAPID partitions a problem into stages in which FM coefficients and importance functions are determined for different values of the key parameters such as enrich-ment, burnup, geometry, and cooling time. Then, it uses a system of equations to solve for eigenvalue and eigenfunc-tion and the adjoint funceigenfunc-tion methodology for determining a detector response. The methodology has been succes-fully demonstrated for spent fuel pools [4].
2.1 The Fission Matrix approach
in which the fission source is driven by an independent source in the spent fuel (i.e., spontaneous fission and (α,n) reactions), the induced fission source in celliis given by Equation 1.
Fi=
N
j=1
(ai,jFj+bi,jSj) (1)
WhereFjis the induced fission source strength in fuel pin
j, Sj is the intrinsic (or independent) source strength in
fuel pin j, ai,j is the number of fission neutrons directly
produced in fuel pinidue to a fission neutron born in fuel pin j,bi,jis the same asai,jexcept for intrinsic source
neu-trons. These values are different becauseS andFhave dif-ferent spatial and spectral distributions within each cell.N is the total number of computational cells (which could be a whole assembly, a single fuel pin, or a fraction thereof).
We also consider the eigenvalue problem as in Equa-tion 2.
Fi=
1 k
N
j=1
ai,jFj (2)
The method results in a set ofN linear equations, which can be solved forF andkgiven theai,j coefficients. The
main task is to determine the coefficientsai,j andbi,j in
the case of subcritical multiplication. Since not all the re-gions are coupled, i.e., have non-zero coefficients, we have developed a multi-layered approach to determine the nec-essary coefficients.
Coefficients ai,j are calculated through fixed-source
Monte Carlo calculations, in which neutrons are originated in cell jand fission neutrons born in cell i’s are tallied. The source neutrons are sampled over energy according to the Watt fission spectrum, isotropically. Forbi,jthe same
applies except that neutrons are sampled according to the spontaneous fission and (α,n) reactions spectra.
3 Benchmark problem
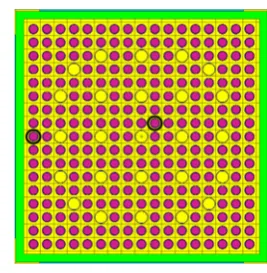
The GBC-32 cask is loaded with 32 Westinghouse 17x17 OFA/V5 fuel assemblies (FA) of different burnups [6]. For the purpose of this work, the cask has been loaded with fresh fuel with 4% wt. enrichment only. The model con-sists of the 32 FAs contained in a stainless steel canister. The canister is equipped with Boral plates encased in Alu-minum clads between the FAs, and it is placed in a Stain-less Steel cylinder. The system is flooded with water. The model is depicted in Figures 1a and 1b. Figure 2 shows one assembly of the GBC-32 Cask.
For the purpose of analysis, two representative pins are highlighted (circled black) in Figure 2: pin (1,9) near the absorber panel on the left of the assembly, and pin (10,10) top-right of the central guide tube. These two pins have been chosen to plot fission density axial distributions be-cause of being subject to the lowest and the highest values of fission density, respectively.
Figure 1.a)xy(at mid active height) and b)xz(aty=0) cuts of the GBC-32 Cask model.
Figure 2. xy(at mid active height) cut of the unit cell of the GBC-32 Cask model.
4 Methodology
The aim of this work is to compare the RAPID calculated ke f f and pin-wise axial fission densities to those of a
refer-ence MCNP calculation. To obtain an accurate referrefer-ence solution, an analysis is performed to obtain the best com-bination of the eigenvalue parameters used in the MCNP’s KCODE calculations.
4.1 Determination of eigenvalue parameters in MCNP
In any Monte Carlo eigenvalue calculation, a major issue is achieving an accurate fission source distribution. This requires determination of three MCNP parameters, includ-ing number of skipped cycles (NSK), number of active cy-cles (NAC), and number of histories per cycle (NPS).
correlated. This effectively causes the fission density tal-lies to oscillate less than their actual statistical uncertainty, leading to an underprediction of the computed uncertainty. This effect usually arises in the fission density distribu-tion tallies and not in theke f f since the latter is an integral
quantity.
In an attempt to detect the potential underprediction of the MCNP reported tally uncertainty, a replication study is performed for a fixed set of the eigenvalue parameters by changing the seed of the PRNG.
4.2 Analysis approach for the establishment of a reference MCNP single-assembly model
The Monte Carlo eigenvalue parameters, NPS, NSK, and NAC, have been investigated by analyzing the eigenvalue (ke f f), the normalized fission density(i.e., source
distri-bution) and the associated uncertainties for the single-assembly model. The fission density is determined in 24 axial intervals for every fuel pin in the model, resulting in 6336 tally regions.
Convergence of the source is examined through the following techniques for different combinations of the eigenvalue parameters:
• The Shannon entropy stabilization as a function of gen-erations [9]. It is worth noting that, as demonstrated by Wenner and Haghighat in [2], this method may fail to correctly diagnose the source convergence in loosely coupled problems.
• The L∞, L1, and L2 norms of the relative differences
of the fission neutron density tallies with respect to the most accurate calculation are computed. These norms are compared to the norms of the uncertainties associ-ated with each tally for the particular calculation, and are defined as follows:
⎧⎪⎪⎪ ⎪⎪⎪⎪⎪ ⎪⎪⎪⎨ ⎪⎪⎪⎪⎪ ⎪⎪⎪⎪⎪ ⎪⎩
L∞−norm: X∞=max
i |xi|
L1−norm: |X|=
1
Nt
Nt i=1
xi
L2−norm: X=
1
Nt
Nt i=1
x2
i
(3)
whereXis a vector composed ofNtelements.Xwill be
either the vector of relative differences or uncertainties. In principle, the norm of the relative difference vector should be lower than the norm of the statistical uncer-tainty if the source has converged. This would indicate that, on average, the variation of the results from case to case is within the statistical uncertainty. Relative dif-ferences are computed for each of the 6336 tally with respect to the most detailed calculation as follows:
Rk,l=
Sk,l−Sk,md
Sk,md
k=1,6336 (4)
whereRk,lis the value of the relative difference of the
k-th tally for the l-th case, Sk,l is the value of thek-th
tally for thel-th case, andSk,mdis the value of thek-th
tally for the most detailed (md) case.
• The Center of Mass (COM) [1] is calculated by:
¯
r= 1
M
Ntallies
i=1
miri (5)
wheremiis fission density at regioni,riis the distance
between regioniand geometric center,Mis the total fis-sion density of the assembly, and ¯ris the COM distance to the geometric center. The COM position evaluated in Equation 5 should oscillate around the geometric center of the model for a symmetric problem.
In addition to the aforementioned analyses, based on a select parameters combination we performed repetition of the same run with different PRNG seeds in order to identify the presence of possible cycle-to-cycle correlation through the approach showed in [8]. From the repetition of the run, the average MCNP calculated variance is cal-culated as follows:
σMCNP=
1
Ns
Ns
i=1
σi (6)
whereNs is the number of different seeds used andσi is
the standard deviation obtained with MCNP for each of the runs.
HavingNs different values for the same quantity, the
"real" standard deviation of the sample can be defined as:
σreal=
1
Ns−1
Ns
i=1
(xi−x¯)2 (7)
where xi is the value of a certain quantity calculated for
thei-th seed, and ¯xis the average of all these values. By calculating the value of these two standard devia-tions, an indication of the underestimation of the MCNP variance due to cycle-to-cycle correlation is provided:
fs=
σreal
σMCNP
(8)
The fsparameter is evaluated using Equation 8 for the
sys-tem eigenvalue,ke f f, and for each of the axially dependent
pin-wise fission density tallies.
Based on the above described evaluation process, a reference MCNP calculation is established for the single-assembly model to be compared with RAPID results.
4.3 Establishment of the full-cask MCNP reference model
Based on the results of Section 4.2, the set of parameters selected for the single-assembly are scaled to represent a full-cask model.
Since the assemblies are separated by absorbing racks, thus assemblies are loosely coupled, the whole-cask model is established by keeping NAC and NSK constant with re-spect to the single-assembly case.
NPS value of 106 (with 144 particles per tally region) has been used for the single assembly model, the direct-scaling approach would lead to prohibitive computation times. Therefore, we have used a reasonable NPS of 105 per assembly (demonstrated in Section 5.1), i.e., 3.2·106
for the full cask.
4.4 Comparison of MCNP reference models to RAPID calculations
The RAPID system calculation is compared to the MCNP reference calculation for both the single-assembly and the full-cask models. Note that the full-cask model is only partially converged because of time limitations. The quan-tities analyzed are the criticality eigenvalue parameter of the systemke f f and the pin-wise axial fission density
dis-tributions. The relative differences between the two meth-ods are calculated and plotted, and maximum and average values are tabulated.
5 Results
This section is divided into four main parts: in Section 5.1 the parametric study of the single-assembly problem to assess adequate eigenvalue calculation parameters to establish a referene MCNP solution is presented; Section 5.2 addresses the cycle-to-cycle correlation issue; while in Sections 5.3 and 5.4 the results of the RAPID code are compared to the MCNP reference calculation for the sin-gle assembly and full cask models, respectively.
5.1 Eigenvalue Parameters
The parametric analyses are made by independently vary-ing the three MCNP criticality parameters (NAC, NPS, and NSK) in order to isolate the effects of the variation of each of them.
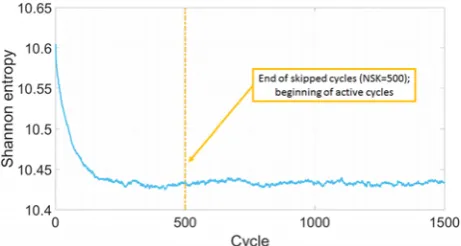
The NAC study has been conducted fixing NSK to 1000 and NPS to 106, varying NAC from 500 to 3500 in steps of 500. The Shannon entropy behavior is presented in Figure 3 as a function of the cycle.
Figure 3.Shannon entropy as a function of cycles.
Figure 3 shows that the value of the Shannon entropy oscillates around a stable value for NAC greater than 300.
Such a behavior is usually interpreted as a sign of source convergence [9].
Figure 4 presents the system eigenvalue, ke f f , as a
function of NAC with the respective standard deviation.
Figure 4.a)k±σkfor different NAC values.
Above figure shows thatke f f has converged, and the
various runs differ by less than one standard deviation. Figure 5 instead shows the behavior of the statistical un-certaintyσkas a function of NAC.
Figure 5.a)σkbehavior for different NAC values.
The statistical uncertainty shown in Figure 5 correctly drops as 1/√N, as expected based on the Central Limit Theorem [1].
Figure 6 shows the percentage distance of the COM from the expected geometric center, relative to half the ac-tive fuel height, for varying NAC:
¯
rn(%)=
100
H/2Nti=1Si,n
Nt
i=1
riSi,n (9)
whereriis the distance of theithregion from the center
of the assembly,Si,nis the fission density value in theith
Figure 6.Center of Mass distance from geometrical center
Figure 6 shows that the COM oscillates of less than 0.5% (with respect to half the active fuel height along the z-direction). Such an oscillation is reasonable and indi-cates that the source has converged.
For the fission density distribution, the norms of the Rk,lvector (|R|l,Rl, andR∞,l) have been computed as
described in Section 4.2 for every runl. Additionally, the norms of the vectorUk,l, containing the relative
uncertain-ties of each tallykas output from MCNP (|U|l,Ul, and
U∞,l) have been calculated. Figures 7, 8, and 9 show the
behavior of these norms as a function of NAC.
Figure 7.Comparison of relative differences and relative uncer-taintiesL1-norms,|R|land|U|l.
Figure 8.Comparison of relative differences and relative uncer-taintiesL2-norms,RlandUl.
Figure 9.Comparison of relative differences and relative uncer-taintiesL∞-norms,R∞,landU∞,l.
Figures 7, 8, and 9 indicate that the relative differences are on averagehigherthan the statistical uncertainty asso-ciated to the calculation.
Figures 10 and 11 show the fission density axial distri-bution in the representative pins (10,10) and (1,9) shown in Figure 2.
Figure 10. Fission density axial distribution in central pin -(10,10)
Figure 11.Fission density axial distribution in pin near absorber - (1,9)
of active cycles, except for the NAC=500 (i.e., the lowest number considered) curve being slightly offset.
Similar analyses have been done for the NSK and NPS parameters independently, keeping fixed the other two. In all the cases, simlar results are obtained, leading to the following conclusions:
• The criticality eigenvalue, ke f f , converges and varies
within the uncertainty for all the various runs;
• The shape of the fission density distribution is converged while on average the variation of the tallies is above the statistical uncertainty, suggesting that these could be un-derestimated;
• The Shannon entropy and COM behaviors are stabilized and would suggest that the fission source is not varying much and is symmetric as expected.
• The norms of the relative differences are higher than the statistical uncertainties ones.
The first three points suggest that the fission source has converged. However, the norms show an unexpected behavior: this can be caused either by a bias in the sam-ple averages calculated by MCNP (i.e., a non-converged source, in contrast with the first three analyses) or an un-derestimation in the statistical uncertainties (e.g., due to cycle-to-cycle correlation). Section 5.2 analyzes the latter phenomenon.
5.2 Cycle-to-cycle correlation investigation
In order to assess the effect of the cycle-to-cycle correla-tion on the computed variance, we performed a replicacorrela-tion study keeping the same set of MCNP criticality parame-ters and changing the PRNG seed. In this way, a "real" standard deviation is calculated and compared to the av-erage MCNP uncertainty, as described in Section 4.2 and in [8]. This study was performed with smaller criticality parameters (NPS=1E6, NSK=300, and NAC=500) with respect to the study done in Section 5.1. This is necessary because significant computation is needed for running the 50 replication cases.
The approach is applied to both the criticality eigen-value,ke f f , and each of the 6336 fission density tallies.
Table 1 give ke f f and the associated standard deviations
("real" and MCNP calculated).
Table 1.Averageke f f , real and MCNP standard deviations, and
their ratio.
¯
k σMCNP(pcm) σreal(pcm) fσ
1.18028 3 2.59 0.8637
The analysis reveals that the "real" standard deviation, calculated through this replication study, is actuallylower than the MCNP calculated one. This is mostly related to the fact that MCNP standard deviations forke f f are
pro-vided with a resolution of 1 pcm. This result is in line with what is shown in Figure 4: the MCNPke f f is
con-verged and the estimation of the statistical uncertainty is accurate.
For the fission density values, the following quantities are analyzed:
• The maximum of the real to MCNP standard deviation ratios for all thek-th tallies:
fσ,max=max
k
fσ,k
(10)
• The average of the real to MCNP standard deviation ra-tios for all thek-th tallies:
fσ,avg=
1
Nt
Nt
k=1
fσ,k (11)
• The weighted average of the real to MCNP standard de-viation ratios using the fission density source for all the k-th tallies:
fσ,wgt=
Nt k=1
fσ,k·Sk
Nt k=1
Sk
(12)
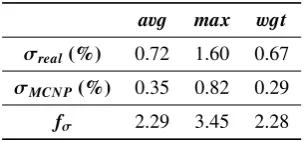
Table 2 summarizes the real and the MCNP standard de-viations and these ratios. The statistical uncertainties for the fission density distribution are underestimated by the MCNP calculations by a factor greater than 2, identifying a strong cycle-to-cycle correlation.
Table 2.Real to MCNP standard deviation ratios for fission density tallies
aug max wgt
σreal(%) 0.72 1.60 0.67
σMCNP(%) 0.35 0.82 0.29
fσ 2.29 3.45 2.28
A 3D plot of the fσratios for these tallies is reported in Figure 12.
Figure 12 demonstrates that there is,on average, a sig-nificant underestimation of the uncertainties and that this underestimation changes significantly in different regions of the model.
As discussed in References [8, 9], cycle-to-cycle cor-relation is related to the method itself and it is not affected by the use of a "better" set of MCNP parameters. There-fore, we can compute the adjustedrelative uncertainties for the NAC, NSK, and NPS parametric analyses (Sec-tion 5.1), multiplying each of the tally uncertainties by the weighted average ratios, fσ,wgt. This would take into
account the presence of cycle-to-cycle correlation in the comparison of the relative differences and relative uncer-tainties for the various cases. The relative differencesL1
-norms,|R|l, are plotted against the adjusted relative
uncer-taintiesL1-norms,|R|l,ad j, for each of the parametric
stud-ies in Figures 13, 14, and 15.
Figure 13.Comparison of relative differences and adjusted rela-tive uncertainties Norm-1,|R|land|U|l,ad jas a function of NAC.
Figure 14.Comparison of relative differences and adjusted rela-tive uncertainties Norm-1,|R|land|U|l,ad jas a function of NSK.
Figure 15.Comparison of relative differences and adjusted rela-tive uncertainties Norm-1,|R|land|U|l,ad jas a function NPS.
The fσ should hold similar results even for higher NAC, NSK, and NPS, since cycle-to-cycle correlation is independent of these parameters, as long as the source has converged, i.e., NSK is high enough [9]. Figures 13, 14, and 15 suggest that the tally variations are on average within the statistical uncertainty associated to the method for all the analyzed cases. Therefore, source convergence is achieved for reasonably lower values of the MCNP crit-icality parameters although the uncertainty calculated by the code is underestimated due to the cycle-to-cycle cor-relation. From this latter analysis we conclude that the NSK=500, NAC=1000, NPS=106 constitutes a suitable reference model for comparison with the RAPID code sys-tem.
5.3 Comparison of RAPID and MCNP results for a Single Assembly
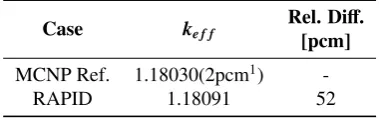
The RAPID code was used to model the single assembly reflected in thex−ydirections. Table 3 presents the results of the eigenvalue calculation.
Table 3.ke f fcomparison of RAPID compared to MCNP
reference calculation.
Case ke f f Rel. Diff.
[pcm]
MCNP Ref. 1.18030(2pcm1)
-RAPID 1.18091 52
1σuncertainty
Above table shows that the RAPID ke f f calculation
(NSK=500, NAC=1000, NPS=106) is in very good
agree-ment with the MCNP reference calculation, with a relative difference of 52 pcm.
Table 4.Computation of RAPID and MCNP required computation time.
Case Num. Time Speedup
Cores [min]
MCNP Ref. 16 666 —
(11.1 hours)
RAPID 1 0.102 6529
(6.12 seconds)
Table 4 indicates that the RAPID calculation on 1 com-puter core is 6500 times faster than the MCNP reference calculation on 16 computer cores.
Figure 16 shows the axial fission distribution of the en-tire assembly, i.e., integrated over thex−ydimensions) for RAPID and the MCNP reference calculation. Note that all uncertainties on the MCNP reference calculation are 1−σ. Uncertainties are within 0.05% for the x−y inte-grated axially-dependent fission density and within 0.59% for the pin-wise axially-dependent one.
● ● ● ● ● ● ● ● ● ● ● ● ● ● ● ● ● ● ● ● ● ● ● ● ● ● ● ● ● ● ● ● ● ● ● ● ● ● ● ● ● ● ● ● ● ● ● ● 0.02 0.04 0.06
0 50 100 150 200 250 300 350 z(cm)
Nor
maliz
ed Fission Density
●
●MCNP−RefRAPID
Figure 16.Axial fission density distribution (integrated over x-y dimensions). Error bars represent 1σuncertainties.
Figure 17 shows RAPID to MCNP relative differences of pin-wise axially dependent fission density distributions.
Figure 17. Relative differences of RAPID vs MCNP calcu-lated pin-wise axially dependent fission density for the single-assembly.
The relative differences for all the regions are below 5%, with regions above 2% being those in the top and bottom layers. This behavior at the fuel rod tips is due to the assumed axial symmetry in the way FM coeffi -cients are calculated. Maximum, average, fission-density weighted average and adjusted-weighted average relative it uncertainties for the MCNP single assembly calculation are given in Table 5. Table 6 gives maximum, average, and weighted-average relative differences of RAPID vs. MCNP.
Table 5.MCNP relative uncertainties for fission density distribution - Single-assembly
Relative uncertainties(%)
Max. Avg. Wgt. avg. Wgt. avg. adj.
0.59 0.25 0.21 0.48
Table 6.RAPID vs MCNP relative differences for fission density distribution - Single-assembly
Relative differences(%)
Maximum Average Weighted avg.
5.00 0.92 0.69
Tables 5 and 6 demonstrate that RAPID and MCNP calculated fission densities are in excellent agreement.
5.4 Comparison of RAPID and MCNP results for the full-cask
As already discussed in Section 4.3, the set of parame-ters used for the full-cask reference MCNP calculation are NPS=3.2·106, NSK=500, NAC=1000.
ke f f for RAPID and MCNP reference calculations are
given in Table 7 for the full cask. These results show ex-cellent agreement.
Table 7.ke f fcomparison of RAPID compared to MCNP
reference calculation - Full cask.
Case ke f f Rel. Diff.
[pcm]
MCNP 1.14545(1pcma) /
RAPID 1.14590 39
a1σstatistical uncertainty
The maximum, average, and weighted average uncer-tainty values for the full-cask MCNP calculated fission density distribution tallies are reported in Table 8.
Table 8.Full-cask MCNP calculated fission density distribution uncertainties.
Relative uncertainties(%)
Maximum Average Weighted avg.
Similar to the single-assembly case, the RAPID to MCNP relative differences for the pin-wise axially-dependent fission density distribution have been calcu-lated. Figure 18 shows the 3D distribution of these relative differences.
Figure 18.Relative differences of RAPID vs MCNP calculated pin-wise axially-dependent fission density for the full cask.
Figure 18 shows how the relative differences are lower than 2% the inner regions, where the MCNP statistical uncertainties are smaller. The highest relative differences are on the boundaries: it is important to note that, due to under-sampling [10], the peripheral fission densities cal-culated by MCNP are far from convergence and might be significantly biased. Accurate estimation of the fission density in these regions is required for detector responses estimation and dose calculations on the outside surface of the cask. Hence, the fission matrix approach should be used instead of straight-forward Monte Carlo calculations to achieve accurate unbiased detector responses. Cask dose calculation has been recently implemented in RAPID and demonstrated in [11]. The average relative difference, weighted on the fission density distribution, amounts to 1.56%, comparable to the statistical uncertainty reported in Table 8.
Table 9 shows the computational time requirements for both the methods, demonstrating how a large nuclear sys-tem as the full cask can be simulated in real time with RAPID, with a significant speedup with respect to MCNP.
Table 9.Computation time of RAPID and MCNP reference calculation - Single assembly.
Case Num. Time Speedup
Cores [min]
MCNP Ref. 16 13,767 —
(9.5 days)
RAPID 1 0.585 23,533
(35 seconds)
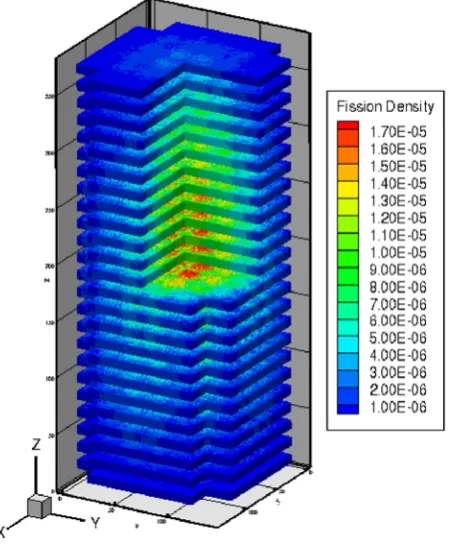
Figure 19 shows RAPID calculated 3-D fission density distribution.
Figure 19.3-D fission density distribution in the GBC-32 Cask.
6 Conclusions
This paper examines the performance of the RAPID code system for the simulation of a UNF cask benchmark, GBC-32. Because of the presence of absorbing plates in between the assemblies in a cask, any eigenvalue Monte Carlo simulation faces with the difficulty of particle under-sampling. Hence, it is necessary to examine carefully the source convergence. To do so, a detailed statistical anal-ysis is performed using a single assembly model with re-flective boundary conditions.
that do not require any eigenvalue calculation, doesn’t suf-fer from any of these difficulties.
Based on the parametric analysis, an appropriate set of eigenvalue parameters (NAC, NSK, NPS) have been selected to establish both a single-assembly and full-cask reference model for comparison with RAPID. It is demon-strated that the calculated eigenvalue and fission density distribution by the RAPID and MCNP code systems are in excellent agreement with the reference MCNP results for both the models, leading to average relative differences of the order of a few percents mostly related to boundary ef-fects that will be addressed in future work.
In addition, under-sampling may cause biased bound-ary MCNP tallies even when large criticality parameters are used. This issue is avoided using the FM approach, since no Monte Carlo criticality calculations are neces-sary. The calculation of external doses and detector re-sponses is highly affected by the accuracy of the outer re-gions, nearby the detector location, hence making the use of codes based on the FM methodology, such as RAPID, necessary to calculate these quantities.
Moreover, it is shown that the RAPID computation time is significantly (several orders of magnitude) smaller than the MCNP one, i.e., 35 seconds vs. 9.5 days on 16 cores. This speedup increases as the model becomes larger.
References
[1] A. Haghighat, Monte Carlo Methods for Particle
Transport (CRC Press Taylor & Francis Group,
2015)
[2] M. Wenner, A. Haghighat, Progress in Nuclear Sci-ence and Technology2, 886 (2010)
[3] J. Dufek, W. Gudowski, Annals of Nuclear Energy 36, 1270 (2009)
[4] W. Walters, N.J. Roskoff, A. Haghighat, A Fission Matrix Approach to Calculate Pin-wise 3D Fission
Density Distribution, inProc. M&C 2015(Nashville,
Tennesse, 2015)
[5] A. Haghighat, K. Royston, W. Walters, Annals of Nuclear Energy87, 61 (2016)
[6] J.C. Wagner,Computational Benchmark for Estima-tion of Reactivity Margin from Fission Products and Minor Actinides in PWR Burnup Credit Prepared by (2000), ISBN 1800553684
[7] X-5 Monte Carlo Team, MCNP-A General Monte
Carlo N-Particle Transport Code, Version 5, Los
Alamos National Laboratory (2005)
[8] B.T. Mervin, S.W. Mosher, J.C. Wagner, G. Mal-donado, Nuclear Science and Engineering173, 276 (2013)
[9] T. Ueki, F.B. Brown,Stationarity diagnostics using Shannon entropy in monte carlo criticality
calcula-tion I: F test., in American Nuclear Society 2002
Winter Meeting(2002), pp. 17–21
[10] M. Wenner, A. Haghighat, A combined diagnostic approach for Monte Carlo source convergence
iden-tification, inProc. M&C 2009(Saratoga Spring, NY,
May 3-7, 2009)
[11] V. Mascolino, A. Haghighat, N.J. Roskoff,
Exter-nal SNF Cask Dose Calculation Using RAPID, in
Advances in Nuclear Nonproliferation Technology&
Policy Conference(Santa Fe, New Mexico,