
On the Importance of Text Analysis for Stock Price Prediction
Heeyoung Lee
1Mihai Surdeanu
2Bill MacCartney
3Dan Jurafsky
11Stanford University, Stanford, California, USA 2University of Arizona, Tucson, Arizona, USA
3Google, Mountain View, California, USA
[email protected], [email protected], [email protected], [email protected]
Abstract
We investigate the importance of text analysis for stock price prediction. In particular, we introduce a system that forecasts companies’ stock price changes (UP, DOWN, STAY) in response to financial events reported in 8-K documents. Our results indicate that using text boosts prediction accuracy over10%(relative) over a strong baseline that incorporates many financially-rooted features. This impact is most important in the short term (i.e., the next day after the financial event) but persists for up to five days.
Keywords:8-K text analysis, stock price forecasting, financial events
1.
Introduction
A vast amount of new information related to companies listed on the stock market appears constantly, with imme-diate impact on stock prices. Monitoring such information in real time is important for big trading institutions but out of reach of the individual investor. We present a news mon-itoring and stock prediction system, designed from the po-sition of the individual investor without access to real-time trading tools. The contributions of our work are:
• We demonstrate that 8-K financial reports, which must be filed by publicly listed U.S. companies when major events occur, impact the stock price of the correspond-ing company for several days.
• We implement a model that predicts the next days’ stock movement by incorporating relevant financial in-formation, such as recent stock price movement and earnings surprise, and textual information from these financial reports. We demonstrate that the model which includes textual information performs signifi-cantly better than a model with financial information alone.
• We release a corpus that aligns these financial events with the corresponding stock prices, in the hope that this promotes research on this problem.
2.
Related Work
There are many attempts to use language features to bet-ter predict market trends. Xie et al. (2013) introduced tree representations of information in news, Bollen et al. (2010) used Twitter data, Bar-Haim et al. (2011) fo-cused on identifying better expert investors, and Leinwe-ber and Sisk (2011) studied the effect of news and the time needed to process the news in event-driven trading. Kogan et al. (2009) proposed a method that predicts risk based on financial reports. Engelberg (2008) shows that linguistic in-formation, perhaps because of cognitive load in processing, has greater long-term predictability for asset prices than quantitative information. While this literature provides an
important background, few previous results show improve-ments from textual information on predicting the impact of financial events on top of quantitative features like earnings surprise, which are known to be very predictive.
3.
Corpus
We create and release a corpus that aligns descriptions of financial events with changes in stock prices. We describe below these two components of the dataset. The entire corpus is available for download here: http://nlp. stanford.edu/pubs/stock-event.html.
3.1. Financial Reports
We focus on the companies’ 8-K financial reports. Pub-licly listed U.S. companies are required to file 8-K reports whenever they have a significant business event, including bankruptcies, layoffs, the election of a director, a change in credit, etc (see Table 1). We downloaded the raw reports from the Securities and Exchange Commission website1.
We preprocessed the text in these reports as follows: (a) we removed all HTML tags such as<p>or<td>, and (b) we removed all tables with numeric values, which are typically accounting figures. Here is an example snippet from a 8-K report after preprocessing:
On November 15, 2011, the Board of Directors (the “Board”) of Apple Inc. (the “Company”) appointed Robert A. Iger to the Board. Mr. Iger will serve on the Audit and Finance Committee of the Board.
We collected 8-K reports for all S&P 500 companies be-tween 2002 and 2012, with the last two years (2011-2012) reserved for the final evaluation, the previous two (2009-2010) for development, and the remainder for training. We also collected data on reported (from 8-K reports) and consensus (the estimation of analysts) Earnings Per Share
Material definitive agreements Bankruptcies or receiverships Director is elected
Director departs
Asset movement: acquisition or sale Result of operations and financial condition
Material Direct Financial obligations (bonds, debentures) Triggering events that accelerate material obligations (defaults on a loan)
Exit or disposal plans Material impairments
Delisting or transfer exchange notices Unregistered equity sales
Modifications to shareholder rights Change in accountant
SEC investigations and internal reviews Financial non-reliance notices
Changes in control of the company Changes in executive management
Departure or appointment of company officers Amendments to company Governance Policies Trading suspension
Change in credit
Change in company status Other events
Table 1: The list of financial event types in 8-K reports from
http://en.wikipedia.org/wiki/Form_8-K
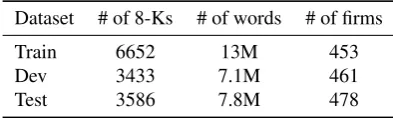
Dataset # of 8-Ks # of words # of firms
Train 6652 13M 453
Dev 3433 7.1M 461
Test 3586 7.8M 478
Table 2: The datasets
(EPS), only retaining the reports for which this informa-tion was available. Table 2 shows the dataset statistics. Al-though market trends are drastically different in different time periods (e.g., the financial crisis in 2008 vs. the recov-ery period afterwards), we nonetheless chose to split the data temporally to avoid training on information that oc-curred after the events in the testing partition. Each 8-K report is time stamped with a release time, which we use to label each event as occurring before market open, during the market, or after market close.
3.2. Stock Prices
For each 8-K report, we calculate the difference in the com-pany’s stock price before and after the report is released. For example, if the 8-K report is published before market opens, this difference is computed between the price at the next open and the price at the previous close. We normalize this difference by subtracting the same difference computed for the entire S&P 500 index (stock index GSPC) for the same period. For example, if a company’s stock price goes up 3% after the event and S&P 500 index goes up 1% in the same period, then the normalized change is 2%. This nor-malization is needed to isolate the company-specific change from the overall market trend, in the hope that the investor using this tool can outperform overall market trends. The
normalized price change rate is binned into one of three la-bels:UP(the price goes up more than 1%),DOWN(the price
goes down more than 1%),STAY(the price change is within 1%). In this work, we calculate accuracy for system eval-uation, but it is also possible to use mean squared error in a regression task. The daily price data is downloaded from Yahoo! Finance2, and the prices are adjusted by dividends,
stock splits, and other corporate actions.
4.
Features
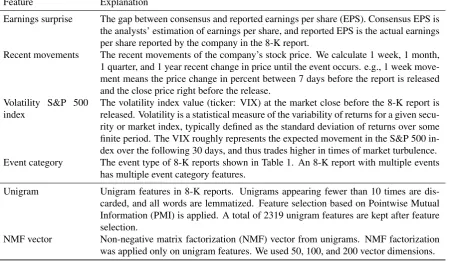
Table 3 shows the list of features we used. We gen-erated 21 numeric or event categorical features of four non-linguistic feature types, including recent stock price changes, the volatility index, earnings surprise (the ratio between expected and actual earnings per share), and event category (the reason for filing the form 8-K). We down-loaded the earnings surprise feature fromhttp://biz. yahoo.com/z/, and we extracted the event categories from the meta data in the 8-K reports. Note that a single 8-K report may contain multiple event types, so there can be multiple event category features for one report.
To understand the trend of a stock price we implemented several features based on recent changes in the correspond-ing instrument. All these features captures changes be-tween stock moving averages over multiple time intervals: (a) 1 month, using the 5 days moving average, (b) 1 quar-ter using the 10 days moving average, and (c) 1 year, using the 20 days moving average. As described in section 3.2., we normalize these recent stock price movements with the change of S&P 500 index in the same period with the same moving average window.
For the linguistic features we used unigram features, first lemmatizing all unigrams and then incorporating a model of negation by marking as a negative every word appearing between a linguistic negation and a clause-level punctua-tion mark (Das and Chen, 2001; Pang et al., 2002). We then removed any features that occurred fewer than 10 times throughout the training data and used PMI for feature se-lection to retain 2319 linguistic features.
While we achieved good results with our unigrams with negation model (see Section 7.), raw text features can be sparse. In an attempt to address this potential sparsity, we incorporated dimensionality reduction in our model. To this end, we applied non-negative matrix factorization (NMF) (Lee and Seung, 1999) to the linguistic features (i.e., the unigrams previously introduced) and the result-ing vector combined with the baseline numeric features in a random forest classifier, testing several different values for the latent vectorization dimensions (50, 100, 200).
5.
Run-through Example
We show how our feature extraction and labeling is done in this section. Below we show a snippet from a 8-K report of Visa Inc. on October 29 2008.
. . . On a GAAP basis, the Company reported a net loss of$356million . . . We remain intensely focused on helping our financial institution and retail clients through this difficult period . . .
Feature Explanation
Earnings surprise The gap between consensus and reported earnings per share (EPS). Consensus EPS is the analysts’ estimation of earnings per share, and reported EPS is the actual earnings per share reported by the company in the 8-K report.
Recent movements The recent movements of the company’s stock price. We calculate 1 week, 1 month, 1 quarter, and 1 year recent change in price until the event occurs. e.g., 1 week move-ment means the price change in percent between 7 days before the report is released and the close price right before the release.
Volatility S&P 500 index
The volatility index value (ticker: VIX) at the market close before the 8-K report is released. Volatility is a statistical measure of the variability of returns for a given secu-rity or market index, typically defined as the standard deviation of returns over some finite period. The VIX roughly represents the expected movement in the S&P 500 in-dex over the following 30 days, and thus trades higher in times of market turbulence. Event category The event type of 8-K reports shown in Table 1. An 8-K report with multiple events
has multiple event category features.
Unigram Unigram features in 8-K reports. Unigrams appearing fewer than 10 times are dis-carded, and all words are lemmatized. Feature selection based on Pointwise Mutual Information (PMI) is applied. A total of 2319 unigram features are kept after feature selection.
NMF vector Non-negative matrix factorization (NMF) vector from unigrams. NMF factorization was applied only on unigram features. We used 50, 100, and 200 vector dimensions.
Table 3: The list of features. We have 1 earnings surprise feature, 4 recent movements features, 1 volatility index feature, and 15 event category features after feature selection.
There are three event types in this 8-K report: Results of Operations and Financial Condition, Financial Statements and Exhibits, Regulation FD Disclosure.
Close price of Visa Inc. on Oct 29, 2008 50.69 Open price of Visa Inc. on Oct 30, 2008 50.59
Reported EPS 0.58
Consensus EPS 0.56
Close price of S&P index on Oct 29, 2008 930.09 Open price of S&P index on Oct 30, 2008 939.38 Close price of VIX on Oct 29, 2008 69.96
Table 4: Various financial information about Visa Inc. or other market index (VIX: volatility index)
Table 4 shows the price and other information about the company at the time of the event. Given this document and stock prices of Visa Inc., we calculate the change in price to be−0.2%, and normalize it by subtracting the change of the S&P 500 index in the same time period, which was1.00%. Note that, without normalization, the original change would be binned into STAY, but, after normalization, the label becomes DOWN because the normalized price change is
−1.2%.
This label is then paired with a set of features extracted au-tomatically. The first group of features is financial. For ex-ample, for this stock and event, the reported EPS is3.57%
larger than the consensus EPS, therefore the value of the earnings surprise feature is3.57. A separate feature is con-structed based on the close price of the volatility index on October 29, 2008, which was69.96. This report contains three event types: Results of Operations and Financial
Con-dition, Regulation FD Disclosure, Financial Statements and Exhibits, which generate three other features. To calculate recent price changes, we used (a) a 5-day moving average (MA) for the 1-month price change feature, (b) 10-day MA for the 1-quarter change, and (c) 20-day MA for 1 year. We normalized all these change features using the S&P 500 index. For the stock in this example, these values were:
4.89% for 1-week change, −21.8% for 1-month change, and−31.5%for 1-quarter change. The 1-year change was not available for this company.
The second group is linguistic, such as lemmatized uni-gram features from the document such as {loss: 1, basis: 1, ...}. For some of models presented here, we further implement dimensionality reduction of the lin-guistic features using NMF.
6.
Experimental Setup
The feature set previously described form the core of a sys-tem that forecasts stock price movement (UP,DOWN,STAY) in response to a financial event. For all experiments re-ported here, we trained this model using a random forest classifier (Breiman, 2001), using 2000 trees. The hyper-parameter for the percentage of features to be considered at each split point in a decision tree is tuned on the develop-ment set.
We compare our system against two baselines. A simple but very strong baseline is a deterministic system that predicts movementUPwhen actual earnings were better than expec-tation. We also compare against a random forest classifier that uses all the 21 proposed financial features described above but no linguistic features.
Feature B1 B2 Uni NMF E
Earnings surprise √ √ √ √ √ Recent movements √ √ √ √ Volatility index √ √ √ √
Event category √ √ √ √
Unigrams √ √
NMF vector √ √
Table 5: The list of features used in each model. B1: Base-line1, B2: Baseline2, Uni: Unigram model, NMF: NMF model, E: Ensemble model
we modified the random forest code to guarantee that this feature is included in all generated decision trees.
Finally, we built an ensemble model that combines the three NMF variants using majority voting. Table 5 summarizes all the models proposed in this work.
6.1. Temporal Aspect Model
To see how the event influences the company’s stock price over time, we calculate the price change, which is used to generate the UP/DOWN/STAY label, at various time inter-vals. We use the close price before the report occurrence (as we did above), but instead of the open price on the next day (right after the event occurred), we use the open price on the n-th day, wherenranges from one to five. In the above Visa Inc. example, we calculate the price change be-tween the close on Oct 29, 2008 and at the open on Oct 31, 2008 for n = 2. With this model we will investigate the predictive power of text as we move farther away from the event.
7.
Experimental Results
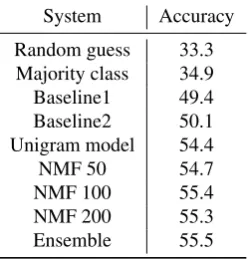
Table 6 summarizes the experiments. The earnings surprise feature is very informative for this task, and together with additional non-linguistic features achieves an accuracy of about 50%. Unigrams with the simple negation heuristics improve the performance about 4%. While non-negative matrix factorization does not yield a significant improve-ment over the unigram model, if we combine these more generalized vectors with the unigram model, we obtain a significant increase in accuracy of about1%.
Linguistic features thus give significant improvement com-pared to the non-linguistic baseline.
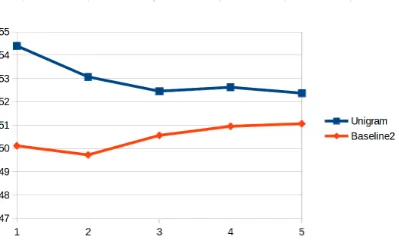
Table 7 and Figure 1 show how the predictive power of lin-guistic and non-linlin-guistic features changes as we move far-ther away from the relevant event. The non-linguistic fea-tures show a relatively flat trend for varying the time inter-val, but the linguistic features give more predictive power in the very short term, compared to longer period. This indicates that the effect of linguistic features diminishes quickly with time. This result is somewhat contrary to Engelberg’s (2008), which suggested that soft information (such as news articles) carries a higher processing cost, and thus takes longer to affect the market than hard information (that is, quantitative information such as growth rate). This result needs more investigation, but one possible explana-tion is that we use company reports instead of newspapers.
System Accuracy
Random guess 33.3 Majority class 34.9 Baseline1 49.4 Baseline2 50.1 Unigram model 54.4 NMF 50 54.7 NMF 100 55.4 NMF 200 55.3 Ensemble 55.5
Table 6: Results for all proposed models. Baseline1 is the deterministic system only using earnings surprise, and Baseline2 uses all 21 financial features. The Unigram model uses 2319 unigram features in addition to the 21 fi-nancial features. We used three different dimensions for non-negative matrix factorization. The Ensemble model combines the three NMF models using majority voting. Both baseline systems are significantly better than random guess; the unigram model is significantly better than both baseline systems; and the ensemble model is significantly better than the unigram model. All five differences are sta-tistically significant (p <0.05). We used approximate ran-domization (Hoeffding, 1952; Noreen, 1989) for checking statistical significance.
Price change interval Baseline2 Unigram difference
BE→1-d 50.11 54.4 4.29 BE→2-d 49.72 53.07 3.35 BE→3-d 50.56 52.45 1.90 BE→4-d 50.95 52.62 1.67 BE→5-d 51.06 52.37 1.31
Table 7: Performance of the temporal aspect model. The price change interval column indicates the interval used to calculate the price change before and after the event. BE means before event, n-d meansn-th day. e.g., BE→2-d indicates that the price change was calculated between the close price before the event and the open price of the second day of the event.
Because newspaper articles reflect not only new informa-tion about the company, but also the perspectives and opin-ions of third parties, they may require more time for the market to digest. We hypothesize that the market is highly sensitive to company reports in the short term, but more sensitive to third-party perspectives in the longer term.
8.
Error Analysis
Table 8 shows the error distribution from the Baseline2 and Unigram models. An example of a win for the Unigram model comes from a report from FedEx on Sep 22 2011. The Baseline2 model predictsUPlikely due to the earnings surprise feature (reported EPS exceeded consensus EPS by
0.69%), but the unigram model correctly predictsDOWN. Below is a relevant snippet from the 8-K report:
Figure 1: Accuracy of the temporal aspect model over five days.
Baseline2 Correct Wrong
Unigram Correct 1449 515 Wrong 348 1274
Table 8: Error comparison
lower than expected growth, the more rapid de-cline in demand for FedEx Express services, par-ticularly from Asia, outpaced our ability to re-duce operating costs. We have slightly rere-duced our earnings forecast to reflect current business conditions . . .
Here the Unigram model correctly identifiedlower, decline, andreduceas negative predictors.
An example of a loss for the Unigram model comes from a report from Allergan Inc. on Feb 02 2011. The Baseline2 model correctly predictsDOWN, largely thanks to the earn-ings surprise feature (reported EPS was1.12%lower than the consensus EPS). However, the unigram model wrongly predictsSTAYbecause of the positive words in the 8-K re-port. Below is a relevant snippet from the 8-K report:
”We are very pleased with our fourth quarter and full year results, as well as the record num-ber of regulatory approvals secured in 2010,” said David E.I. Pyott, Allergan’s Chairman of the Board and Chief Executive Officer.
Among the unigram features most often used as split points in the random forest, we have positive words such as in-crease, growth, new, strong, forward, well, grow, as well as negative words such ascharge, loss, lower, decline, reduce, down, adjust, regulation, offset, reduction. Three of them (strong, loss, decline) are in the sentiment lexicon for the finance domain. This will be discussed in more detail in section 9.1. There are some words such asfutureorproduct
whose positive valence is not very obvious, but make sense in combination with other words also selected as unigram features (e.g., new product). We also have weandwhile
among our top features. Previous research has suggested that using more first-person plural pronouns may demon-strate various kinds of affective meaning like collective
fo-cus (Gortner and Pennebaker, 2003; Stone and Pennebaker, 2002). As our FedEx example illustrates, while is often used to explain negative facts.
9.
Negative Results
9.1. Sentiment Features
In addition of the lexicalized features previously described, we experimented with sentiment lexicons, which were shown to be effective in previous research (Bollen et al., 2010). Similar to this work, we added features that cap-ture counts of positive/negative sentiment words. We used SentiWordNet3 as an open-domain sentiment lexicon, and
considered a word a positive word if its first sense has a positive score larger than0.5and a negative score of0(the reverse applied to negative words). However, incoporating these features did not improve performance significantly over the simpler unigram model. Our conjecture is that because SentiWordNet is open-domain, it does not model well the financial domain. For example,growthhas objec-tive or negaobjec-tive sentiment according to SentiWordNet, but it is usually positive in finance.
We further experimented with sentiment lexicons designed specifically for finance (Jegadeesh and Wu, 2013). Positive and negative sentiment word count features were generated similarly as above. However, this configuration also failed to outperform the unigram model. There are two causes for this result. First, a post-hoc analysis of the test results in-dicated that our unigram features (after PMI) capture about
77%of sentiment words in the Jegadeesh and Wu lexicon. Second, sentiment lexicons do not contain many of the lex-icalized features ranked highly by our model. Among 17 words that were identified as important by our unigram model (increase, growth, new, strong, forward, well, grow, charge, loss, lower, decline, reduce, down, adjust, regula-tion, offset, reduction), only three words (strong, loss, de-cline) appear in the Jegadeesh’s sentiment lexicons.
9.2. Bigram and Word Clustering Features
We also tried bigram and dependency-based features which were shown to be effective for similar tasks in previous works (Wang and Manning, 2012; Kogan et al., 2009; En-gelberg, 2008). However, for our task, these features did not have a positive contribution.
In an attempt to address the sparsity of lexicalized features, we built thesaurus word clusters using the algorithm of Lin and Pantel (2001) and the company’s earnings call transcripts as the source documents. The algorithm learned many useful clusters, such as:
{double-dip, pandemic}, {significant, meaningful, dramatic, substantial}, {ten-year, 8-year, 7-year, 50-year, six-year, 12-year}, {hesitant, anxious, nervous, pessimistic, worried}. However, this experiment also failed to boost performance. Our conjecture is that these clusters remain too specific and fail to provide a relevant generalization.
9.3. Other Classifiers
We also experimented with other classification models, such as logistic regression and multilayer perceptron. None of these outperformed the random forests.
10.
Limitations
While this work suggests that text analysis of company fil-ings can improve predictions of short-term movements in stock prices, we do not claim that these techniques can form the basis of a viable trading strategy. Such a claim could not be supported without taking into consideration a variety of real-world impediments to profitable trading. At a mini-mum, a convincing model portfolio would need to capture frictions arising from: (1)transaction costs, such as bid-ask spreads; (2)slippage, or the tendency of large trading programs to move the market, especially in illiquid securi-ties; and (3)borrowing costsassociated with taking short positions in securities predicted to fall in value. Accurately modeling such effects lies beyond the scope of this work; we restrict ourselves to examining whether the text of com-pany filings carries any predictive value.
11.
Conclusion
In this work we built a corpus that can be used to investi-gate the importance of text analytics for stock price move-ment. Our corpus aligns descriptions of financial events reported in 8-K documents with the corresponding stock prices, which facilitates the development of stock price forecasting systems that combine financial and textual in-formation. The corpus is publicly available (see Section 3.). Using this corpus, we showed that incorporating textual in-formation is indeed important, especially in the short term (the two days immediately following the event). For ex-ample, our experiments indicate that predicting next day’s price movement is improved by10%(relative) if text is con-sidered. As discussed, our research made several simplify-ing assumptions and, because of this, should not be con-sidered as a complete trading strategy. However, it does indicate that text carries predictive power for stock price movement.
12.
Acknowledgments
This work was supported by a Google Faculty Research Award, by the NSF via award IIS-1159679, and by the Cen-ter for Advanced Study in the Behavioral Sciences at Stan-ford.
Thanks to the Stanford NLP Group for sharing ideas. We also thank Di Wu for providing their sentiment lexicon.
13.
References
Roy Bar-Haim, Elad Dinur, Ronen Feldman, Moshe Fresko, and Guy Goldstein. 2011. Identifying and Fol-lowing Expert Investors in Stock Microblogs. In Pro-ceedings of EMNLP-2011.
Johan Bollen, Huina Mao, and Xiao-Jun Zeng. 2010. Twitter mood predicts the stock market. CoRR, abs/1010.3003.
Leo Breiman. 2001. Random forests. Machine Learning, 45:5–32.
Sanjiv Das and Mike Chen. 2001. Yahoo! for Amazon: ex-tracting market sentiment from stock message boards. In
Proceedings of the 8th Asia Pacific Finance Association Annual Conference.
Joseph Engelberg. 2008. Costly information processing: Evidence from earnings announcements. San Francisco Meetings Paper.
Eva-Maria Gortner and James W. Pennebaker. 2003. The archival anatomy of a disaster: Media coverage and community-wide health effects of the texas a&m bonfire tragedy. Journal of Social & Clinical Psychology, page 580.
Wassily Hoeffding. 1952. The large-sample power of tests based on permutations of observations. The Annals of Mathematical Statistics, pages 169–192.
Narasimhan Jegadeesh and Di Wu. 2013. Word power: A new approach for content analysis. Journal of Financial Economics.
Shimon Kogan, Dimitry Levin, Bryan R. Routledge, Ja-cob S. Sagi, and Noah A. Smith. 2009. Predicting risk from financial reports with regression. InProceedings of Human Language Technologies: The 2009 Annual Con-ference of the North American Chapter of the Associa-tion for ComputaAssocia-tional Linguistics, NAACL ’09, pages 272–280, Stroudsburg, PA, USA. Association for Com-putational Linguistics.
Daniel D. Lee and Sebastian Seung. 1999. Learning the parts of objects by non-negative matrix factorization.
Nature, 401(6755):788–791.
David Leinweber and Jacob Sisk. 2011. Event-driven trad-ing and the new news. The Journal of Portfolio Manage-ment, 38(1):110–124.
Dekang Lin and Patrick Pantel. 2001. Induction of seman-tic classes from natural language text. In Proceedings of ACM Conference on Knowledge Discovery and Data Mining (KDD-01), pages 317–322, San Francisco, CA, USA.
Eric W. Noreen. 1989. Computer-Intensive Methods for Testing Hypotheses. John Wiley & Sons.
Bo Pang, Lillian Lee, and Shivakumar Vaithyanathan. 2002. Thumbs up? sentiment classification using ma-chine learning techniques. In Proceedings of the Con-ference on Empirical Methods in Natural Language Pro-cessing.
Lori D. Stone and James W. Pennebaker. 2002. Trauma in real time: Talking and avoiding online conversations about the death of princess diana. Basic and Applied So-cial Psychology, 24:173–183.
Sida Wang and Christopher Manning. 2012. Baselines and bigrams: Simple, good sentiment and topic classifica-tion. InProceedings of the 50th Annual Meeting of the Association for Computational Linguistics (ACL 2012). Boyi Xie, Rebecca J. Passonneau, Germn Creamer, and
![Effectiveness of the population based Check your health preventive programme conducted in primary care with 4 years follow up [the CORE trial]: study protocol for a randomised controlled trial](data:image/gif;base64,R0lGODlhAQABAIAAAP///wAAACH5BAEAAAAALAAAAAABAAEAAAICRAEAOw==)