Putting the Squeeze on Molecule-Based Magnets: Exploiting Pressure to Develop Magneto-Structural Correlations in Paramagnetic Coordination Compounds
Alvaro Etcheverry-Berrios,1 Simon Parsons,1,* Konstantin V. Kamenev,2,* Michael R. Probert,3,* Stephen A.
Moggach,4,* Mark Murrie5,* and Euan K. Brechin1,*
1 EaStCHEM School of Chemistry and Centre for Science at Extreme Conditions, The University of Edinburgh, David Brewster Road, Edinburgh, EH9 3FJ, UK; [email protected]
2 School of Engineering and Centre for Science at Extreme Conditions, The University of Edinburgh, Peter Guthrie Tait Road, Edinburgh, EH9 3FD, UK; [email protected]
3 School of Natural and Environmental Sciences, Newcastle University, Kings Road, Newcastle, NE1 7RU, UK; [email protected]
4 School of Molecular Sciences and Centre for Microscopy, Characterisation and Analysis, University of Western Australia, 35 Stirling Highway, Crawley, Perth, 6005, Western Australia, Australia;
5 School of Chemistry, University of Glasgow, University Avenue, Glasgow, G12 8QQ, UK;
Abstract
The cornerstone of molecular magnetism is a detailed understanding of the relationship between structure and magnetic behaviour, i.e. the development of magneto-structural correlations. Traditionally, the synthetic chemist approaches this challenge by making multiple compounds that share a similar magnetic core but differ in peripheral ligation. Changes in the ligand framework induce changes in the bond angles and distances around the metal ions which are manifested in changes to magnetic susceptibility and magnetisation data. This approach requires the synthesis of series of different ligands and assumes that the chemical/electronic nature of the ligands and their coordination to the metal, the nature and number of counter ions and how they are positioned in the crystal lattice, and the molecular and crystallographic symmetry have no effect on the measured magnetic properties. In short, the assumption is that everything outwith the magnetic core is innocent, which is a huge oversimplification. The ideal scenario would be to have the same complex available in multiple structural conformations, and this is something that can be achieved through the application of external hydrostatic pressure, correlating structural changes observed through high pressure single crystal X-ray crystallography with changes observed in high pressure magnetometry, in tandem with high pressure inelastic neutron scattering (INS), high pressure electron paramagnetic resonance (EPR) spectroscopy and high pressure absorption/emission/Raman spectroscopy. In this review, which summarises our work in this area over the last 15 years, we show that the application of pressure to molecule-based magnets can (reversibly): (1) lead to changes in bond angles, distances and Jahn-Teller orientations; (2) break and form bonds; (3) induce polymerisation/depolymerisation; (4) enforce multiple phase transitions; (5) instigate piezochromism; (6) change the magnitude and sign of pairwise exchange interactions and magnetic anisotropy and (7) lead to significant increases in magnetic ordering temperatures.
Keywords: High Pressure X-ray Crystallography, High Pressure Magnetometry, High Pressure Absorption Spectroscopy, Molecule-based Magnets, Single-Molecule Magnets, Single-Ion Magnets.
1. Introduction
Over the last 50 years there has been a significant increase in the number of high-pressure single-crystal and powder diffraction studies performed on molecular systems, with several comprehensive reviews on the subject including the effect of pressure on amino acids[1], metal-complexes [2] and metal-organic frameworks [3-4]. The complexity of molecular systems examined under pressure has grown significantly with the first molecules consisting of just a handful of atoms, such as benzene which was first published in 1969 [5]. More recently molecular porous systems containing thousands of atoms and with unit cell volumes in excess of 55,000 ų have been studied (Figure 1) [6]. In all, some 3328 structures in the Cambridge Structural Database (CSD) have been collected at pressure to date (CSD version 5.41).
Advances in pressure cell technology, and in particular the size and ease of use of diamond anvil cells (DACs) such as the Merrill Bassett cell [7], turnbuckle cell [8], and other miniature diamond anvil cells [9] has made possible the study of molecular systems of increasing complexity. One area where the use of pressure has seen a significant rise in popularity is in the study of functional materials where high-pressure diffraction studies performed in conjunction with other high-pressure measurements on the same sample have helped develop structure-property relationships. Supplementary techniques have included high-pressure UV-Vis [10], fluorescence emission [11], conductivity [12], Mossbauer [13] and magnetic measurements. These combined studies have revealed how structural distortions, caused by increasing pressure, have enforced changes in the physical properties of materials. Examples include measuring changes in conductivity and band structure in molecular conductors [12], monitoring framework ‘breathing effects’ on uptake of guest species within porous Metal-Organic Framework materials [14], and how structural changes in encapsulated fluorophores affect emission properties [11]. One area where this approach has made a significant impact is in the field of magnetism. Herein we highlight our efforts in developing magneto-structural correlations in transition metal molecule-based magnets; we do not attempt to cover examples from other researchers which are many and varied [15-28].
Figure 1. Cell volume versus publication year for all high-pressure structures collected in the CSD (version 5.41) that contain the required field ‘pressure’ in the cif.
2. Mn complexes
The compounds we chose to study first were those containing MnIII. This was for a number of reasons. At the
beginning of our research in ~2006 we were making MnIII-based Single-Molecule Magnets (SMMs) and had a
large library of complexes from which to choose, many of which had very interesting structural/magnetic features [29,30]. Aligned to this was the presence of the Jahn-Teller (JT) axis of the octahedral MnIII ion. Given the
well-0 10000 20000 30000 40000 50000 60000
1965 1975 1985 1995 2005 2015 2025
C
e
ll V
o
lu
me
known dynamic JT effect observed in numerous coordination compounds [31], we speculated that hydrostatic pressure would be capable of changing JT bond lengths/orientations and that that would have a pronounced effect on both magnetic exchange interactions and magnetic anisotropy.
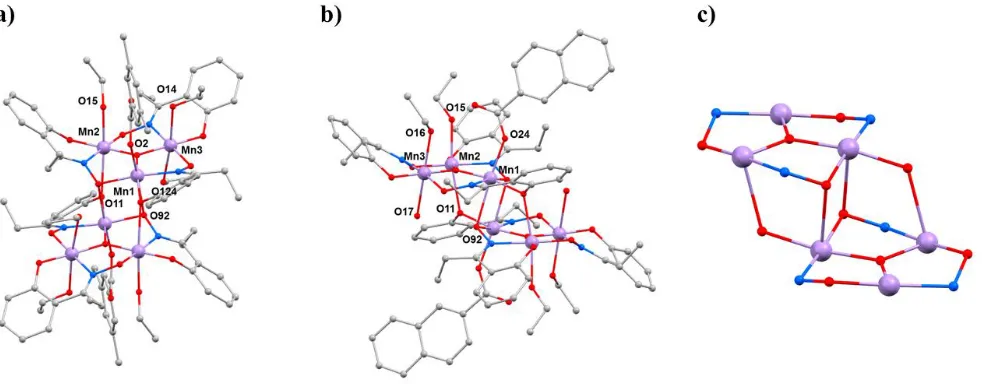
The compounds [Mn6O2(Et-sao)6(O2CPh(Me)2)2(EtOH)6] (1) and [Mn6O2(Et-sao)6(O2C-naphth)2(EtOH)4(H2O)2]
(2;sao2– is the dianion of salicylaldoxime) are part of a well-studied family of SMMs for which detailed
magneto-structural correlations under ambient conditions have been developed [32-34]. The general structure of these complexes (Figure 2) describes two parallel, off-set [MnIII
3(μ3-O)]7+ triangular subunits linked via two central
oximate O-atoms and two peripheral phenoxide O-atoms, leading to a [MnIII
6(μ3-O)2(μ3-ONR)2(μ-ONR)4]8+ core.
The bridging between neighbouring Mn ions within each triangle occurs through an NO oximate group, such that each Mn2 pair forms a −Mn−N−O−Mn− moiety, and thus the Mn3 triangle, a (−Mn−O−N−)3 ring. The coordination
spheres of the Mn ions are completed by two terminal carboxylates (one on each triangle) and by terminal solvent molecules. All Mn ions are in the 3+ oxidation state, are six-coordinate adopting distorted (pseudo) octahedral geometry, with their axially elongated JT axes approximately perpendicular to the [Mn3O]7+ planes [35]. All family
members can be categorised into two subsections according to their magnetic behaviour: those possessing intra-triangle antiferromagnetic exchange interactions, and those possessing intra-intra-triangle ferromagnetic exchange interactions. All family members display inter-triangle ferromagnetic exchange. This results in compounds with S
= 12 ground states in the latter, and 4 ≤ S < 12 ground states in the former. Interestingly, the sign and magnitude of the magnetic exchange is controlled through R-saoH2 ligand design, with larger, non-rigid R (in the main, e.g.
R = Me, Et) causing puckering of the −Mn−N−O−Mn− moiety. The change in torsion angle from near planar (when R = H for example) to non-planar decreases the antiferromagnetic contribution to the nearest-neighbour exchange, and at ~31° the pairwise interaction switches to being ferromagnetic [36]. Given that such enormous changes in magnetic behaviour are observed through very small changes in structure, aligned to the fact that the magnitude of the exchange (J) is very small (and thus the absolute difference in J is small) made compounds 1
and 2 ideal candidates for the first ever combined HP single crystal X-ray diffraction / HP magnetic study of a SMM.
Figure 2. (a) The molecular structure of complex 1. (b) The molecular structure of complex 2. (c) The metallic skeleton common to 1 and 2. Colour code: Mn = lilac, O = red, N = blue, C = grey. H atoms are omitted for clarity. Hydrostatic high pressure (HP) single-crystal X-ray diffraction (XRD) measurements were performed on 1 and 2
in petroleum ether at T = 300 K to a maximum pressure of 1.5 GPa [37]. 1 and 2 crystallise in the monoclinic space groups P21/n and P21/c, respectively, and remain so in the full pressure range. The most obvious initial effect
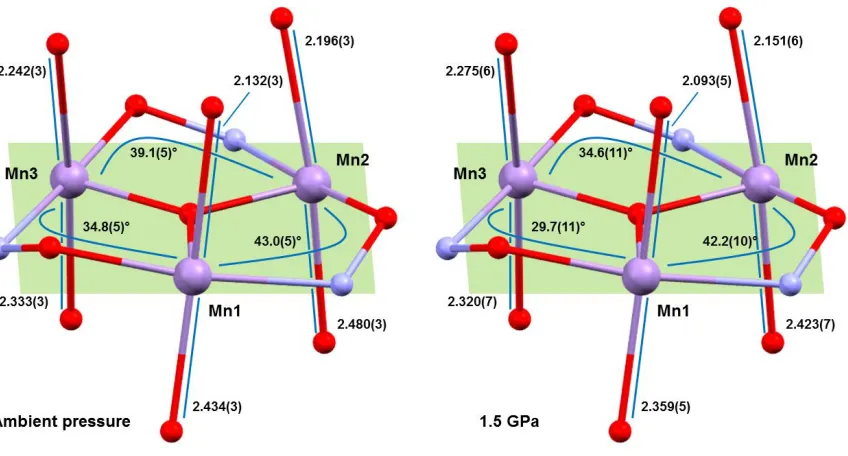
interactions (H···H) reduce by a maximum of ~0.9 Å in 1 and just ~0.07 Å in 2. The intramolecular changes are more remarkable (Figure 3), with the Mn–N–O–Mn torsion angles flattened considerably, and the JT axes compressing and re-aligning differently with respect to the plane of the three metal centres in the triangle (Tables 1-2). The Mn–N–O–Mn torsion angles decrease by up to ~5.1° (1), ~5.7° (2). Significantly the Mn1-N-O-Mn3 torsion angle in both cases falls from above to below the angle expected to switch the pairwise exchange from ferromagnetic to antiferromagnetic; 34.8(5)→29.7(11)° (1), 33.2(2)→27.5(17)° (2). Note that Mn3 lies at the periphery of the molecule, away from the more structurally rigid core, and is the only metal ion bonded to two solvent molecules, which sit on its JT axis. The changes in the JT axes with pressure are less consistent. For 1 the JT axes of Mn1 and Mn2 are compressed with pressure (2.132(2), 2.434(3) Å → 2.093(5), 2.359(5) Å; 2.196(3), 2.480(3) Å → 2.151(6), 2.423(7) Å, respectively). However, the JT of Mn3 actually elongates at 0.5 GPa, before compressing at all other (higher) pressures resulting in a small overall compression of one bond and a small overall elongation of the other. All three JT axes move to become slightly more perpendicular to the mean plane of the [Mn3] triangle, albeit by just ~0.9-1.6°. In 2 the JT axes all compress with pressure (Mn1, 2.102(3), 2.508(3) Å →
2.033(7), 2.486(9) Å; Mn2, 2.205(3), 2.397(3) Å → 2.141(9), 2.387(11) Å; Mn3, 2.395(3), 2.188(3) Å → 2.398(7), 2.107(7) Å) and variations in the alignment of the axes are within the statistical error, though the trend appears analogous to that seen for 1.
Table 1. Comparison of the Mn–O–N–Mn torsion angles (°) at ambient pressure and at 1.5 GPa for complexes
1 and 2.
At ambient pressure in 1
At 1.5 GPa in 1 At ambient pressure in 2
At 1.5 GPa in 2
Mn1–O–N–
Mn2/° 43.0(2) 42.2(10) 41.1(2) 41.1(1.7)
Mn2–O–N–
Mn3/° 39.1(2) 34.6(11) 40.5(2) 36.5(1.8)
Mn3–O–N–
Mn1/° 34.8(2) 29.7(11) 33.2(2) 27.5(1.7)
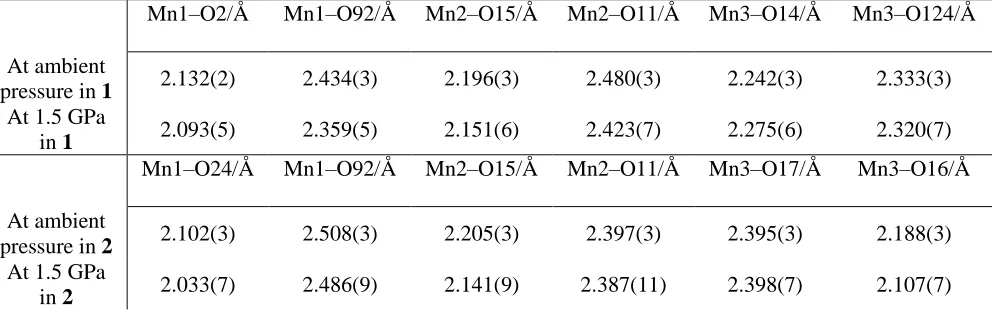
Table 2. Comparison of the bond lengths (Å) of the Jahn-Teller axes at ambient pressure and at 1.5 GPa for complexes 1 and 2.
Mn1–O2/Å Mn1–O92/Å Mn2–O15/Å Mn2–O11/Å Mn3–O14/Å Mn3–O124/Å
At ambient
pressure in 1 2.132(2) 2.434(3) 2.196(3) 2.480(3) 2.242(3) 2.333(3)
At 1.5 GPa
in 1 2.093(5) 2.359(5) 2.151(6) 2.423(7) 2.275(6) 2.320(7)
Mn1–O24/Å Mn1–O92/Å Mn2–O15/Å Mn2–O11/Å Mn3–O17/Å Mn3–O16/Å
At ambient
pressure in 2 2.102(3) 2.508(3) 2.205(3) 2.397(3) 2.395(3) 2.188(3)
At 1.5 GPa
Figure 3. Comparison of Jahn-Teller bond lengths and Mn–O–N–Mn torsion angles in 1 at ambient pressure (left) and 1.5 GPa (right). Colour code as Figure 1.
HP susceptibility and magnetisation data were collected to 2 GPa using Daphne 7373 oil as the pressure transmitting medium. The magnetic behaviour of 1 and 2 at ambient pressure has been described in detail previously [29,38]. In the following text the numbers in brackets refer to complex 2. Data measured in the cell, but with zero applied pressure (T = 300 – 5 K, B = 0.1 T) can be simulated with the parameters g = 1.99(2.03) and
J = +1.75(+1.31) cm–1 in a model assuming all exchange interactions are the same.† With increasing pressure, the value of χMT increases more slowly with decreasing temperature and has a much smaller maximum for both
complexes, clearly indicative of a weaker (less positive) ferromagnetic exchange interaction, and/or the presence of antiferromagnetic exchange. Indeed, simulation of the susceptibility data for 1 at the highest pressures measured requires the introduction of a 2J model in which the Mn1-Mn3 exchange interaction is antiferromagnetic (J1 =
+1.10 (+1.00) cm–1, JMn1-3 = –0.10 (−0.45) cm–1), consistent with the structural changes in the torsion angles.
Simulations suggest the spin ground state remains S = 12 at lower pressures, but switches to S = 11 (or smaller) at higher pressures. A fit of the magnetisation data for compound 1 measured in the cell, but with zero applied pressure (T = 2-7 K, B = 0.5-5.0 T) to an axial zero-field splitting (zfs) plus Zeeman Hamiltonian (Giant Spin Model) affords S = 12, g = 1.99 and D(S=12) = –0.38 cm–1, consistent with that observed for all ferromagnetically coupled members of the family. At the highest pressures measured these parameters become S = 11, g = 1.98 and
D(S=12) = –0.34 cm–1. The data for 2 could not be fitted, but qualitatively show a similar trend in behaviour. As expected with decreasing |J| and the introduction of antiferromagnetic exchange, the barrier to magnetisation reversal in these SMMs is reduced dramatically (Figure 4). There is a clear pressure and frequency-dependent decrease in the out-of-phase, χM″, peak positions in the ac susceptibility data from T ≤ 6 K. For example, for 1 the
peak at 300 Hz at 0(1.75) GPa occurs at ~6.3(4.8) K; for 2 the peak at 100 Hz at 0(1.4) GPa occurs at 3.9(3.0) K. A fit of the HP χM″ data to the Arrhenius equation revealed a decrease in Ueff in 1(2) from 83(63) K to 63(47) K.
Figure 4. (a) Arrhenius plots based on out-of-phase ac susceptibility measurements of 1 at different pressures. (b) Hysteresis loops for 1 recorded at the indicated pressures at 2 K.
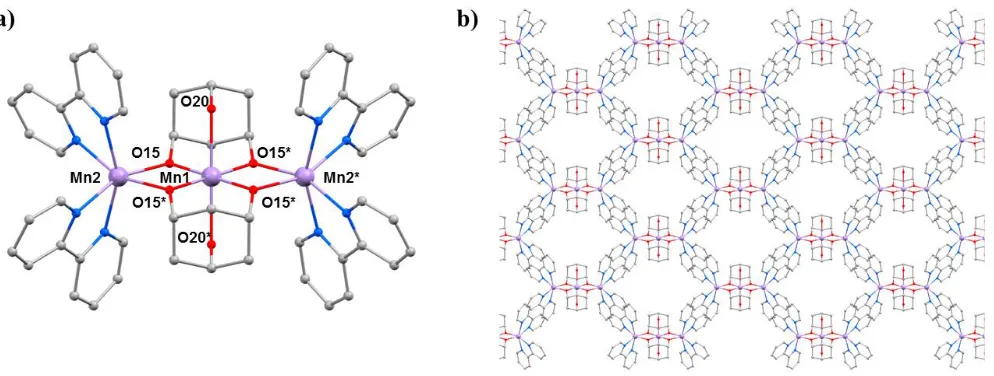
The second SMM to be the focus of a combined HP crystallography/magnetism study was the compound [Mn3(Hcht)2(bpy)4](ClO4)3·Et2O·2MeCN (3·Et2O·2MeCN; Hcht2– is the dianion of cis,cis-1,3,5-cyclohexanetriol
and bpy is 2,2’-bipyridine) [39,40]. The structure of 3 (Figure 5) contains a linear [MnIIIMnII
2O4]3+ core with the
central MnIII centre (Mn1) bound to the peripheral MnII ions (Mn2 and symmetry equivalent, s.e.) by four alkoxide
O-atoms (O15 and s.e.) provided by two Hcht2– ligands, positioned one above and one below the trimetallic chain.
One protonated oxygen atom (O20 and s.e.) from the tripodal alcohol defines the JT axis of Mn1. The MnIII–O–
MnII angle is ~102°, with the coordination sites of each MnII ion completed by four N-atoms from two bpy ligands.
Mn2 (and s.e) are in highly distorted octahedral geometries with cis angles in the range 72.30(16)–105.65(15)° and trans angles in the range 156.0(2)–158.17(14)°. When viewed perpendicular to the bc plane the disposition of the [Mn3] cations resembles a honeycomb-type lattice where the MeCN molecules of crystallisation are H-bonded
to the terminal bonded arm of the tripodal ligand (N···O, ~2.8 Å), while the perchlorate anions are H-bonded to the ring of carbon atoms (O···H–C, ≥ 2.3 Å) and lie between the bpy groups of adjacent [Mn3] molecules. The
closest inter-molecular contacts between cations occur between off-set π-stacked bpy groups (C···C, ~3.5 Å).
HP single crystal XRD measurements were performed in petroleum ether at T = 300 K and three different pressures to a maximum of 1.25 GPa [41]. Complex 3 crystallises in the monoclinic space group I2/m and remains so in the full pressure range. Remarkably, by 0.16 GPa, there is complete elimination of the MeCN and Et2O solvent of
crystallisation. It has literally been squeezed out of the crystal, representing the very first example of pressure-induced solvent elimination to have been observed from the crystal structure of any molecular coordination compound. This leaves large void spaces in the structure, equating to ~9.3% of the total volume that are gradually reduced to ~5.5% at 1.25 GPa. The total change in volume over the entire pressure range is ~10.5%, resulting in intermolecular distances shortening by ~0.5 Å. For example, separations between MnIII ions along the three
dimensions shift from 11.919(2), 13.385(2) and 22.044(4) Å at ambient pressure to 11.331(3), 13.586(3) and 21.547(4) Å at 1.25 GPa, respectively. Despite significant changes in inter-molecular interactions, there are only minor intramolecular changes. The Mn-O15 bonds contract from 1.898(3) Å at ambient pressure to 1.858(5) Å at the highest pressure measured, the Mn1···Mn2 separation decreases from 3.143(1) Å to 3.118(2) Å, and the planes of the bpy rings become a little more ‘twisted’ with respect to each other (15.4(1)°→16.6(2)°).
Dc magnetic susceptibility data collected at ambient pressure (T = 300 – 5 K, B = 0.1 T) reveals weak ferromagnetic exchange between the MnIII and MnII ions with J = +1.15 cm–1. Fitting of the magnetisation data (T = 2 – 7 K, B =
1 – 7 T) afforded the parameters S = 7, D(S=7) = –0.17 cm–1 with g = 1.99. With increasing pressure the susceptibility
data clearly indicate a weakening interaction, χMT increases more slowly with increasing pressure as temperature
decreases, reaching a smaller maximum at T = 5 K. Simulation of the HP susceptibility data (Table 3) shows that the exchange decreases by close to 50%, to a value of J = +0.60 cm–1 at 0.85 GPa. This behaviour is consistent with the observed shortening of Mn1-O15 bond distance and Mn1···Mn2 separation which would increase the antiferromagnetic contribution to the exchange. Magnetisation data at all pressures is super-imposable and can be fitted with the same parameter set as those obtained at ambient pressure, consistent with the lack of change in geometry at the JT distorted MnIII site and the retention of ferromagnetic nearest neighbour exchange.
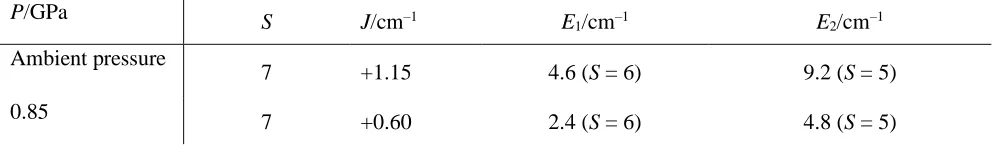
Table 3. Comparison of the J values and the energy differences between the ground state and first/second excited spin states at ambient pressure and at 0.85 GPa for complex 3 as calculated from an isotropic fit of the susceptibility data.
P/GPa S J/cm–1 E
1/cm–1 E2/cm–1
Ambient pressure
7 +1.15 4.6 (S = 6) 9.2 (S = 5)
0.85 7 +0.60 2.4 (S = 6) 4.8 (S = 5)
The complex [Mn12O12(O2CCH2tBu)16(H2O)4]·CH2Cl2·MeNO2 (4·CH2Cl2·MeNO2) belongs to the prototype
[Mn12O12(O2CR)16(H2O)4] family of SMMs [42,43]. The general structure of these complexes consists of a ring of
eight MnIII centres surrounding a central MnIV
4O4 cube, bridged by oxide and carboxylate ligands (Figure 6). In
the case of Mn12acetate, the MnIII ions occupy two crystallographically independent sites with the eight JT axes
lying in near alignment with the magnetic easy axis, affording D(S=10) = –0.457(2) cm–1. In combination with a S =
10 spin ground state this leads to an effective barrier to magnetisation reversal of ~60 K [44]. Bulk [Mn12] samples,
however, often contain a small percentage of a fast-relaxing (FR) JT isomer, which display a misaligned/horizontal JT axis and a much lower barrier height, Ueff ≈ 40 K, and initial HP studies of the static magnetic properties of
Mn12acetate at low temperatures, and HP INS measurements, had suggested some conversion of the slow relaxing
(SR) isomer to the FR isomer with pressure [45-47]. However, both studies lacked any crystallographic confirmation. In order to address this, we turned our attention to [Mn12O12(O2CCH2tBu)16(H2O)4]·CH2Cl2·MeNO2
(4·CH2Cl2·MeNO2) because it exists as the 100% FR isomer, with the JT axis on Mn8 oriented equatorially rather
Figure 6. (a) The molecular structure of complex 4. (b) The structure of the Mn–O core of 4 at ambient pressure and (c) at 2.5 GPa. The ‘vertical’ JT bonds are coloured orange and the JT bonds on Mn8, which switches with applied pressure, are coloured green. Colour code: Mn = lilac, O = red, C = grey, H = pale green. H atoms (except on H2O ligands shown in (b) and (c)) and solvent molecules are omitted for clarity.
HP single crystal XRD measurements were performed in Daphne oil at T = 298 K and at three different pressures up to 2.5 GPa [48]. Complex 4 crystallises in the triclinic space group P-1 and remains so in the full pressure range. At ambient pressure the formula unit contains one MeNO2 and CH2Cl2 of solvation. At 1.5 GPa the
occupancies of the solvent decreases to 0.75MeNO2 and 0.5CH2Cl2 per formula unit, and at 2.5 GPa the solvent is
removed completely - suggesting that the solvent is released into the hydrostatic medium and reabsorbed on decompression. The main structural changes within the cluster occur at the MnIII centres. At 1.5 GPa, the JT
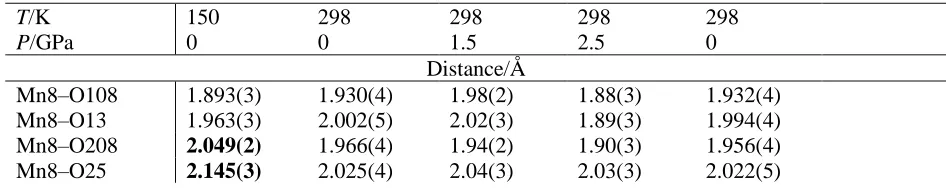
elongated bonds on Mn5, Mn6 and Mn12 become more asymmetric, while those on Mn7 and Mn9–Mn11 decrease, but only by ~0.02 Å on average. At Mn8 the JT bond (O208-Mn8-O25; 2.049(2) Å, 2.145(3) Å) lengths decrease, and at 1.5 GPa the six Mn–O distances span the range 1.94(2) to 2.082(15) Å (Table 4), suggesting that the disorder present at ambient pressure persists. At 2.5 GPa (Figure 6) the horizontal JT bonds at Mn8 switch to vertical JT bonds, O14-Mn8-O26 (2.105(17) Å, 2.19(2) Å). Between 1.5 and 2.5 GPa, the JT bonds on the remaining MnIII sites do not change significantly. Release of pressure re-establishes the coordination seen at
ambient pressure. Note that FR→SR isomer conversion had been previously reported to be affected by solvent loss, consistent with this HP crystallographic data [42,43].
Table 4. Mn–O bond lengths at Mn8 as a function of pressure. Values for significantly elongated bonds are shown in bold.
T/K 150 298 298 298 298
P/GPa 0 0 1.5 2.5 0
Distance/Å
Mn8–O108 1.893(3) 1.930(4) 1.98(2) 1.88(3) 1.932(4)
Mn8–O13 1.963(3) 2.002(5) 2.02(3) 1.89(3) 1.994(4)
Mn8–O208 2.049(2) 1.966(4) 1.94(2) 1.90(3) 1.956(4)
Mn8–O14 1.961(2) 2.012(5) 2.082(15) 2.105(17) 2.015(5)
Mn8–O26 1.956(3) 2.010(5) 2.034(17) 2.19(2) 2.005(5)
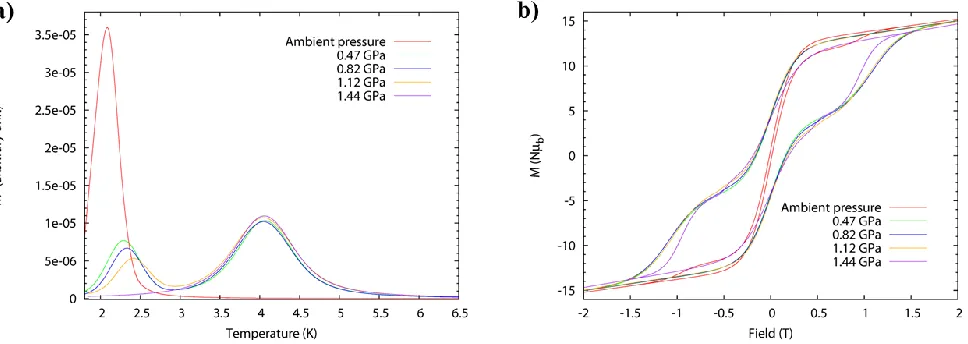
High pressure ac susceptibility data (Figure 7) from ambient pressure to a maximum of 1.44 GPa was collected in Daphne oil. The ambient pressure data reveals only one peak at low temperature (Tmax = 2.1 K at 1 Hz) due to the
FR species. At 0.47 GPa the low temperature peak shifts to higher temperature (~2.3 K) with a significant decrease in its intensity, and a new broader peak appears at ~4 K, i.e. both FR and SR isomers are now present. This trend continues to higher pressures and at 1.44 GPa the low temperature peak disappears and only the high temperature peak is observed (Tmax = 4.1 K at 1 Hz) due to the exclusive presence of the SR species. The switch is fully
reversible. Arrhenius analysis of the frequency dependence affords Ueff(FR) = 41 K, τ0 = 4 × 10⁻¹⁰ s, increasing to
Ueff(FR) = 46 K, τ0 = 8 × 10⁻¹⁰ s at 1.12 GPa. The energy barrier of the pressure-induced SR species, Ueff(SR) =
63 K, compares well to the value, Ueff = 62 K, previously reported for the SR species
[Mn12O12(O2CCH2tBu)16(H2O)4]·CH2Cl2·MeCN. The switch from FR→SR isomer is also evidenced in the
evolution of the hysteresis loop under pressure at 2 K (Figure 7), whose coercive field increases with pressure. An estimation of the axial ZFS from the 1.44 GPa magnetisation data affords, D = –0.61 K, in excellent agreement with that obtained from single-crystal low temperature hysteresis loops.
Figure 7. (a) High pressure ac susceptibility data for compound 4 measured at a fixed frequency of 1 Hz (left). Conversion of the fast-relaxing (FR) to the slow-relaxing (SR) species can be seen through the disappearance of the peak at ~2K and the emergence of the peak at ~4K. (b) High pressure hysteresis loops for 4 at T = 2 K from ambient to 1.44 GPa.
The compounds [Mn2O2(bpy)4](ClO4)3·3MeCN (5·3MeCN) and [Mn2O2(bpy)4](PF6)3·2MeCN·H2O
(6·2MeCN·H2O) belong to a family of mixed-valence oxo-bridged MnIII/MnIV dimers originally synthesised as
models for metalloenzymes [49]. Their structures (Figure 8) contain a central [MnIIIMnIVO
2]3+ asymmetric core
with two bridging μ-O2– ligands and two 2,2’-bipyridine (bpy) ligands completing the octahedral coordination
around each Mn ion. Charge balance is maintained by the presence of three [ClO4]– (5·3MeCN) or three [PF6]–
(6·2MeCN·H2O) counter ions. Mn1 is in the 3+ oxidation state, with the JT axis defined by the N29–Mn1–N41
vector which lies approximately perpendicular to the [Mn2O2] plane. The Mn–Mn separation and the Mn-O–Mn
bridging angles are 2.7058(4) Å, 96.42(7)°, 96.09(7)° in 5·3MeCN and 2.7177(7) Å, 97.00(11)°, 96.97(11)° in
6·2MeCN·H2O. In both cases the solvent molecules and anions are hydrogen bonded to the protons of the bpy
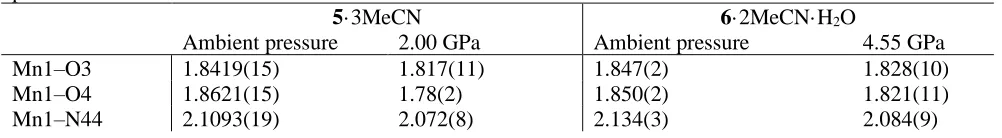
Figure 8. (a) The molecular structure common to complexes 5·3MeCN and 6·2MeCN·H2O. (b) Variations in the
bond lengths from ambient pressure to 2.00 GPa in 5·3MeCN. Only statistically significant changes are shown. Colour code: Mn = lilac, O = red, N = blue, C = grey. H atoms, counterions and solvent molecules are omitted for clarity.
HP single crystal XRD measurements were performed in petroleum ether at room temperature [50]. Data were collected at four different pressures to a maximum pressure of 2.00 GPa for 5, and six different pressures to a maximum pressure of 4.55 GPa for 6. Complex 5 crystallises in the triclinic space group P-1 and complex 6
crystallises in the monoclinic space group P21/n; both remain in the same space groups in the full pressure range.
The main effect of applying pressure is the contraction of the unit cell volume (2517.49(9) → 2239.1(11) Å3;
5150.7(2) → 4207.5(6) Å3, respectively), due to the reduction of void space and aided by the lack of any significant
intermolecular interactions. The main intramolecular changes are to the Mn–Mn distance, which contracts from 2.7058(4) → 2.676(4) Å at 2.0 GPa in 5 and from 2.7177(7) → 2.672(3) Å at 4.55 GPa in 6. In the case of 5, this change is likely due to the contraction of both Mn–O4 bonds (Table 5), however for 6 the variations observed for the Mn–O distances and the Mn–O–Mn angles are not statistically significant. In 5 there are also significant changes in the Mn1–N bond lengths, which see two of the four decreasing and one (N32) increasing. The JT axis (N41–Mn1–N29), is significantly shortened, with the Mn1–N29 bond contracting from 2.2221(18) Å to 2.142(6) Å. For Mn2 the changes are less significant, except for the Mn2–N5 bond which increases from 2.078(5) Å at 0.18 GPa to 2.144(8) Å at 2.00 GPa. A similar change is also seen in 6.
High pressure dc susceptibility data (T = 350 – 20 K, B = 0.1 T) were collected to a maximum pressure of 0.87(0.84) GPa for 5(6) using Daphne oil as hydrostatic medium. The behaviour of both complexes is analogous to that previously reported for 5(6)across the whole temperature and pressure regime, consistent with the lack of any significant intramolecular structural change at low pressures. Simulations of the susceptibility data afford J = –177 cm–1 and g = 1.96 for 5 and J = –185 cm–1 and g = 1.98 for 6.
Table 5. Selected bond lengths (Å) and angles (°) for 5·3MeCN and 6·2MeCN·H2O at ambient and maximum
pressure.
5·3MeCN 6·2MeCN·H2O
Ambient pressure 2.00 GPa Ambient pressure 4.55 GPa
Mn1–O3 1.8419(15) 1.817(11) 1.847(2) 1.828(10)
Mn1–O4 1.8621(15) 1.78(2) 1.850(2) 1.821(11)
Mn1–N41 2.2053(18) 2.194(7) 2.220(3) 2.156(8)
Mn1–N32 2.1666(19) 2.245(16) 2.2128(3) 2.085(9)
Mn1–N29 2.2221(18) 2.142(6) 2.212(3) 2.148(8)
Mn2–O3 1.7867(15) 1.79(2) 1.781(2) 1.752(12)
Mn2–O4 1.7753(15) 1.740(10) 1.779(2) 1.791(11)
Mn2–N5 2.0971(18) 2.144(8) 2.077(3) 2.029(8)
Mn2–N8 2.0160(18) 2.002(6) 2.008(3) 1.998(8)
Mn2–N17 2.0813(18) 2.060(13) 2.078(3) 2.017(9)
Mn2–N20 2.0165(18) 2.021(5) 2.017(3) 1.982(8)
Mn1–Mn2 2.7058(4) 2.676(4) 2.7177(7) 2.672(3)
Mn1–O3–Mn2 96.42(7) 95.6(11) 97.00(11) 96.5(4)
Mn1–O4–Mn2 96.09(7) 98.7(11) 96.97(11) 95.4(5)
3. Cu complexes
The choice of investigating CuII complexes was partly influenced by our initial success in MnIII chemistry where
we repeatedly saw large structural changes associated with JT axes. Aligned with this was the well-known coordinative flexibility of the CuII ion which is commonly four, five or six coordinate, adopting a variety of
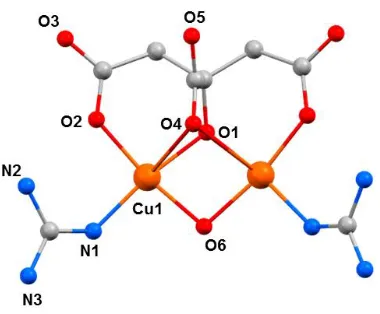
geometries, and consequently, colours. Such species therefore offered another potential variable to examine – high pressure absorption/emission spectroscopy, which would allow us to correlate changes in the metal coordination sphere to piezochromism. The Cu dimer [GuH][Cu2(OH)(cit)(Gu)2] (7, H4cit = citric acid, Gu = guanidine) is
somewhat unusual, in that it was the first reported example of a coordination compound containing neutral guanidine ligands bonded to a transition metal ion (Figure 9) [51].At ambient pressure complex 7 crystallises in the orthorhombic space group Pnma. The two CuII ions have a distorted square pyramidal [4 + 1] coordination
environment. They are bridged by a µ-OH– ligand (O6), the citrate alkoxide (O1) and the citrate α-carboxylate group (O4). The latter forms the long ‘axial’ bond (Cu1…O4, 2.740(4) Å). The coordination environment of each metal ion is completed by one citrate β-carboxylate (O2) and one neutral guanidine ligand (N1). The region of the sixth coordination site of the CuII ion is occupied by an uncoordinated β-carboxylate O-atom from a neighbouring
molecule (Cu1…O3, 3.217(4) Å. The GuH+ cation is located in a pocket between the two neutral Gu ligands and
is H-bonded to the anion.
Figure 9. The molecular structure of the anion in 7. Colour code: Cu = orange, O = red, N = blue, C = grey. H atoms and the counter cation are omitted for clarity.
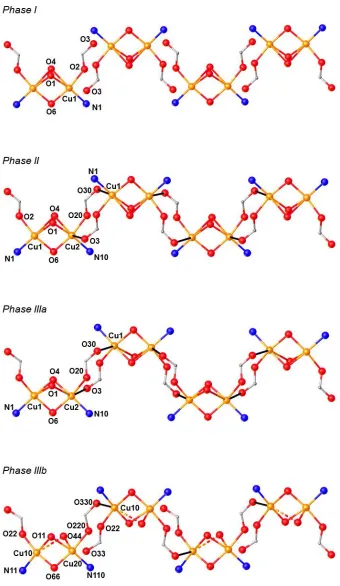
intermolecular change is observed: the Cu1···O3 distance shortens by 0.264 Å to 2.953(2) Å. On increasing the pressure to 2.9 GPa complex 7 undergoes a single-crystal-to-single-crystal phase transition to the non-centrosymmetric space group P212121 (Phase II). The Cu1···O3 contact is now defined by two independent
interactions, Cu1···O30 (2.879(7) Å) and Cu2···O3 (2.610(6) Å), and the metal coordination environment changes from [4 + 1] → [4 + 2] with the long contacts now defined by the intramolecular Cu–O4 bond and the intermolecular Cu1–O30 (Cu2–O3) contact. The result of these changes is the formation of a polymer via
conversion of intermolecular contacts to intramolecular bonds (Figure 10); the first example of the polymerisation of a transition metal complex with pressure. A second single-crystal-to-single-crystal phase transition occurs between 2.95 GPa and 4.23 GPa, this time to the centrosymmetric monoclinic space group P21/c, forming Phase
III, which consists of two crystallographically independent polymeric chains. One of these chains (based on Cu1, Cu2) remains largely unchanged, while the other (based on Cu10, Cu20) undergoes significant rearrangement. Specifically, the bridging α-carboxylate ligand twists forcing the Cu–O–Cu moiety to be more asymmetric, the Cu10–O44 and Cu20–O44 bonds measuring 2.816(7) and 2.497(7) Å, respectively. Simultaneously, one polymer-forming bond, Cu10–O330, shortens to 2.449(6) Å, while the second (Cu20…O33, 3.098(6) Å), breaks. Thus, while the integrity of the second chain is retained, the polymerisation only involves only one CuII centre, i.e. half
A second, structurally related citrate/guanidine-based CuII dimer, [GuH]
4[Cu2(cit)2]·2H2O (8), was also studied
[52]. Compound 8 (Figure 11) crystallises in the orthorhombic space group Pbca and consists of two symmetry equivalent CuII ions bridged by two alkoxide O-atoms (O7 and s.e.) from the citrate ligands, the metals being
further coordinated by the β-carboxylate O-atoms from each ligand (O1, O3). The four-coordinate, pseudo-tetrahedral metal centre has approximate D2d symmetry. In addition, each α-carboxylate group is oriented towards
one of the CuII centres at a Cu1–O5 distance of 2.628(3) Å, with the O5-Cu-Cu angle being 73.05(6)°. An
alternative description of the coordination sphere of the metal centre is therefore a highly distorted [4 + 1] geometry.
Figure 11. (a) The molecular structure of the anion in 8. (b) Crystal packing of complex 8 along the a-axis. Colour code: Cu = orange, O = red, N = blue, C = grey. H atoms and counter ions (in (a)) are omitted for clarity.
HP single crystal XRD measurements were performed on 8 in a 1:1 mixture of pentane-isopentane to a maximum pressure of 2.20 GPa. The crystal packing of 8 consists of alternate layers of cations and anions (Fig. 11b), in which the GuH+ ions direct an extensive hydrogen-bonding network with the citrate ligand O-atoms and lattice
H2O molecules. The main effect of applying pressure is a compression along the direction of the layer-stacking in
the b-axis (which also contains the largest voids), which decreases in length by 8.9% to 2.20 GPa (14.713(9) Å → 13.4098(7) Å). The shortening of the a and b axes allied to the diamond like packing motifs formed by the guanadinium cations causes the c axis to lengthen, an early example of negative linear compressibility in molecular solids. The most significant intramolecular change is in the Cu-O5 distance, which decreases from 2.628(3) Å at ambient pressure to 2.407(3) Å at 2.20 GPa. The metal geometry is therefore now 5-coordinate [4 + 1] with approximate C4v symmetry. Interestingly, the Cu-O5 bonds also lie along the b-axis – meaning that the largest
intramolecular compression correlates with the largest intermolecular compression. HP single crystal electronic spectroscopy measurements reveal that 8 undergoes a colour change from blue to green, due to a reduction in absorption in the 18500–14000 cm–1 region. This is directly related to the reduction in the Cu-O5 bond length and the rearrangement of the Cu coordination sphere. The d–d spectrum (Figure 12) at ambient pressure consists of two bands at 15300 and 12800 cm–1, which are observed in the full pressure range to a maximum of 5.5 GPa. Both bands blue shift linearly with pressure at a rate of 140 and 100 cm–1 GPa–1, respectively. The 15300 cm–1 band intensity decreases with pressure and almost disappears above 2.5 GPa. The intensity ratio in the 0-2.5 GPa range decreases in line with the reduction in the Cu-O5 distance, suggesting this to be chiefly responsible for the observed piezochromism. The main effects observed in the electronic spectra can be explained in terms of simple monomeric CuII units (Figure 12b). At ambient pressure, the Cu-O5 interaction is weak and though the Cu site symmetry is
C1, the spectrum can be interpreted by considering a pseudo-tetrahedral (D2d) 4-coordinate Cu moiety showing
two allowed transitions (e → b2 and a1 → b2). At higher pressures, the Cu-O5 interaction becomes much shorter
(e → b2). In short, the gradual reduction of the ‘axial’ Cu-O bond length induces a continuous transformation of
the local Cu site symmetry from ~D2d at ambient pressure to ~C4v in which e → b2 is the only allowed transition.
Figure 12. (a) Electronic absorption of complex 8 at different pressures (up to 5.5 GPa) at ambient temperature. (b) Correlation diagram showing the energy level structure of 4-coordinate CuII from T
d to D2d, and 5-coordinate
from D2d to C4v. The arrows indicate symmetry allowed transitions.
The complexes [Cu2(OH)2(H2O)2(tmen)2](ClO4)2 (9, tmen = tetramethylethylenediamine),
[Cu2(OH)2(tben)2](ClO4)2 (10, tben = di-tbutylethylenediamine) and [Cu2(OH)2(bpy)2](BF4)2 (11, bpy =
2,2’-bipyridine) are part of a large family of hydroxo-bridged CuII dimers that have been studied since the 1970s when
Hatfield and Hodgson first developed a quantitative magneto-structural correlation relating the bridging CuII
-O-CuII angles in the diamond shaped [Cu
2(µ-OH)2] core to the magnitude of the exchange interaction [53]. Complex 9 (Figure 13) has each CuII ion in a [CuO
3N2] square pyramidal coordination sphere, while in 10 the bulky tBu
groups of the tben ligands force the geometries of the metal ions to be intermediate between square planar and tetrahedral, with additional solvent ligation impossible, such that the CuII ions are four coordinate with [CuO
2N2]
coordination spheres (Figure 14a). The CuII ions in 11 are in a JT distorted [CuO
2N2F2] octahedral geometry, with
the F–Cu–F vector defining the JT axis (Figure 14b). The Cu–O–Cu angles are 102.03(13)° in 9, 102.72(6)° and 101.62(6)° in 10, and 97.40(14)° in 11. At ambient pressure, they crystallise in the monoclinic space groups P21/c
(9), C2/c (10) and C2/m (11).
HP single crystal XRD measurements were performed using petroleum ether as hydrostatic medium [54]. Data were collected at 0.25, 0.70, 1.20 and 2.50 GPa for 9, at 0.21 and 0.90 GPa for 10, and at 0.30, 0.80, 1.53, 2.25, 2.80, 3.50, 4.00, 4.30 and 4.70 GPa for 11. Crystals of 10 and 11 remain in the same space group in the full pressure range, whereas complex 9 undergoes a phase transition between 1.20 and 2.50 GPa from monoclinic P21/c to
triclinic P-1. In all cases, the primary effect of applying pressure is a reduction of the unit cell, the compressions being assigned to the removal of void space due to the absence of any significant inter-molecular interactions. The secondary effect is intra-molecular. In 9 the Cu–O–Cu angle becomes smaller, from 102.03(13)° to 99.7(7)° at 1.20 GPa, with a concomitant shortening of the Cu···Cu distance from 2.9784(12) Å to 2.939(3) Å (Table 6). At ambient pressure, one H2O molecule is bonded to each CuII ion, approximately perpendicular to the Cu2O2 plane
Å. Further increases in pressure lead to a phase transition from the monoclinic space group P21/c to the triclinic
space group P-1 between 1.20 and 2.50 GPa, with the asymmetric unit now containing two full dimers and four perchlorate anions. The loss of symmetry is caused by the elimination of one H2O molecule from half the dimers,
producing two different complexes: one with two H2O molecules (one bonded to Cu1 and Cu1*) and one with
only one H2O molecule (bonded to Cu3; Figure 13). This was the first reported example of pressure-induced H2O
elimination. In both dimers, the decreasing Cu···Cu distance with increasing pressure continues, reaching 2.914(3) Å for Cu1-Cu1* and 2.849(9) Å for Cu3-Cu4 at the highest pressure (2.5 GPa) measured.
Figure 13. The molecular structure of complex 9 at (a) 0.25 GPa and (b) 2.5 GPa. Colour code: Cu = orange, O = red, N = blue, C = grey, Cl = green. H atoms (and counterions in (a)) are omitted for clarity.
Table 6. Selected distances (Å) and angles (°) in compounds 9-11 as a function of pressure (GPa).
P / GPa 9
Cu1···Cu1* Cu1–O10–Cu1* Cu1–Cu1*–O11
ambient 2.9784(12) 102.03(13) 91.41(16)
0.25 2.9578(19) 101.2(3) 88.7(3)
0.70 2.946(2) 101.1(3) 87.4(3)
1.20 2.939(3) 99.7(7) 80.4(7)
Cu1···Cu2 Cu1–O1–Cu2 Cu1–O2–Cu2 Cu1–Cu2–O5 Cu2–Cu1–O6
2.50 2.914(3) 98.4(4) 99.5(6) 91.2(4) 80.1(4)
Cu3···Cu4 Cu3–O3–Cu4 Cu3–O4–Cu4 Cu3–Cu4–O7
2.50 2.004(16) 93.9(13) 94.0(7) 67.4(6)
10
Cu1···Cu2 Cu1–O1–Cu2 Cu1–O2–Cu2
ambient 2.9784(3) 102.72(6) 101.62(6)
0.21 2.964(3) 103.3(5) 102.4(5)
0.90 2.908(7) 99.3(10) 104.2(11)
11
Cu1···Cu1* Cu1–O10 Cu1–F1 Cu1–O10–Cu1*
ambient 2.8663(17) 1.908(2) 2.775(2) 97.40(14)
0.80 2.8649(14) 1.911(2) 2.711(2) 97.13(14)
1.53 2.8544(12) 1.9069(19) 2.655(2) 96.91(13)
2.25 2.8427(15) 1.908(2) 2.609(3) 96.33(16)
2.80 2.8422(12) 1.907(2) 2.577(2) 96.35(14)
3.50 2.8331(13) 1.914(2) 2.548(2) 95.49(14)
4.00 2.8313(14) 1.913(3) 2.530(3) 95.45(18)
4.30 2.8374(17) 1.920(3) 2.543(4) 95.3(2)
4.70 2.8210(19) 1.904(3) 2.503(3) 95.6(2)
Complexes 10 and 11 are less affected by the application of pressure. In 10, the Cu···Cu distance decreases from 2.9784(3) Å at ambient pressure to 2.908(7) Å at 0.90 GPa, with the Cu–O–Cu angles changing from 102.76(6)° and 101.62(6)° to 99.3(10)° and 104.2(11)°. The shortening of the Cu···Cu distance is likely due to the contraction of the bond between Cu2 and the two bridging hydroxide ions decreasing from 1.9198(12) Å to 1.77(3) Å, thus becoming one of the shortest CuII–OH distances ever reported. The presence of the two BF
4– anions in 11 results
in a more rigid structure, reducing the effect of applying pressure. The Cu–F distances decrease from 2.775(2) Å to 2.503(3) Å (ambient pressure → 4.7 GPa), the Cu···Cu distance changes from 2.8663(17) Å to 2.8210(19) Å, and the Cu–O–Cu angles decrease from 97.40(14)° at ambient pressure to 95.6(2)° at 4.7 GPa.
Figure 14. (a) The molecular structure of complex 10 at ambient pressure. (b) The molecular structure of complex
11 at ambient pressure. Colour code: Cu = orange, O = red, N = blue, C = grey, B = pink, F = pale green. H atoms (and counterions in (a)) are omitted for clarity.
HP dc magnetic susceptibility data (T = 350 – 20 K, B = 0.1 T) were collected at ambient pressure to a maximum pressure of 0.84 GPa (9), 0.87 GPa (10) and 0.86 GPa (11) using Daphne oil. Simulation of the susceptibility data at ambient pressure reveals strong antiferromagnetic exchange in 9 and 10 (J = –260 cm–1 and J = –252 cm–1, respectively) and moderate ferromagnetic exchange in 11 (J = +22 cm–1). The χMT value for complexes 9 and 10
at low temperatures (up to 90 K) are 0 cm3 mol K–1 at all pressures. As the temperature increases the χ
MT value of
9 increases following different paths as a function of the applied pressure, reaching a maximum value of 0.28 cm3
mol–1 K at ambient pressure, and 0.39 cm3 mol–1 K at 0.84 GPa. The data follows a similar trend for complex 10
with χMT changing from 0.30 cm3 mol–1 K to 0.34 cm3 mol–1 K (ambient pressure → 0.87 GPa) at T = 350 K. This
behaviour reveals a weakening of the antiferromagnetic interaction between the CuII ions. The parameters obtained
from the simulations at different pressures (Table 7) show that J decreases from –260 cm–1 to –203 cm–1 for 9 and from –252 cm–1 to –228 cm–1 for 10 with increasing pressure, in agreement with magneto-structural correlations developed for [Cu2(OH)2] dimers in which decreasing Cu-O-Cu angles, Cu-O and Cu···Cu distances are all
expected to decrease |J| [55]. HP susceptibility measurements of 11 show a small increase in the χmT value with
Table 7. Comparison of the J values as a function of pressure for complexes 9-11 with g = 2.09 for 9/10 and g
= 2.11 for 11.
9 10 11
P (GPa) J (cm–1) P (GPa) J (cm–1) P (GPa) J (cm–1)
ambient –260 ambient –252 ambient +22
0.22 –222 0.30 –246 0.40 +24
0.59 –220 0.58 –234 0.61 +25.5
0.84 –203 0.87 –228 0.86 +29.4
Previous HP PXRD and magnetic susceptibility measurements on the coordination polymer [CuIIF
2(H2O)2(pyz)]
(12, pyz = pyrazine) had shown successive structural phase transitions, and a pronounced change in the effective dimensionality of the extended CuII···CuII exchange interactions from 2D to 1D [56]. To further complement this
study, we performed detailed HP single crystal XRD and HP single-crystal EPR spectroscopy on 12 in order to provide direct information regarding any pressure-induced reorientation of the JT (d𝑧2) axes and magnetic
(d𝑥2−𝑦2) orbitals. At ambient pressure, complex 12 crystallises in the monoclinic space group P21/c with one CuII
ion in the asymmetric unit (Figure 15). The six-coordinate, JT distorted octahedral CuII ion is bonded to two
O-atoms (1.984(4) Å) from the two H2O ligands, two F- ions (1.908(4) Å), and two N-atoms (2.454(6) Å) from the
pyz ligands. The latter define the orientation of the JT axis, whereby the pyz ligands direct the formation of 1D chains along the a-axis of the unit cell. In the bc plane, these chains are linked into a 2D network by short Cu– OH···F–Cu H-bonds (2.623(4) Å and 2.607(4) Å). The magnetic d𝑥2−𝑦2 orbital of the CuII ion therefore lies in
the CuF2O2 (bc) plane, as confirmed by ambient low temperature magnetisation data which show 2D
antiferromagnetic magnetic order with TN = 2.54 K.
Figure 15. The molecular structure of complex 12 showing (a) the 2D network in the bc-plane, and (b) the 1D chains directed by the pyz ligands along the a-axis. The dashed light blue lines highlight the Cu–OH···F–Cu H-bonds. Colour code: Cu = orange, O = red, N = blue, C = grey, F = yellow, H = pale green.
the 1D pyrazine chains. This structural reorganization simultaneously relieves the tension in the OH···F hydrogen bonds, which increase to 2.702(3) and 2.626(3) Å, respectively. 12 undergoes a second, even more disruptive, pressure-induced phase transition between 2.85 and 3.30 GPa to the triclinic space group P-1 (Phase IV). During this transition one H2O molecule per Cu unit from two thirds of the chains is lost, forcing a dimerization of the
chains through the F- ions (Figure 16). The remaining one third of the chains are unchanged. Interestingly, and by
contrast the 3 where the solvent was ejected from the lattice, the expelled water molecules remain in the crystal lattice and sit between the monomeric and dimeric chains, held in place by the OH···F H-bonding network. In Phase IV the JT axes are now oriented along the O-Cu-F bonds (Cu2-O1, 2.22(3) Å, Cu2-F6*, 2.28(2) Å), and adjacent Cu ions within the dimerized chains are now bridged directly by F- ions (Cu2-F6, 1.908(18) Å;
Cu2-F6-Cu2*, 103.0(8)°). A separate study has revealed a third transformation route at 3.3 GPa which leads to a phase in which the chemical connectivity and orientation of the JT axes in phase II were retained but its symmetry is reduced to triclinic and the orientation of the pyrazine ligands changes [58].
Figure 16. Phases I, II and IV observed in the HP single crystal XRD for complex 12. The green bonds highlight the orientation of JT axis (d𝑧2) of the CuII ion along the a-axis of the cell. The magnetic d𝑥2−𝑦2orbital lies
perpendicular to this, in the bc plane. Phase III observed in the pXRD measurements [56] was not seen in the single crystal XRD measurements. Colour code is the same as in Figure 15. H atoms are omitted for clarity.
HP single crystal EPR measurements at 0.67 GPa (Figure 17) as a function of field orientation at 69.3 GHz and 10 K show a single, sharp peak with strong angle dependence and g-value extrema of g|| = 2.42 and g⊥ = 2.08. The
former corresponds to the direction parallel to the JT axis. At 1.82 GPa and 65.7 GHz two signals are observed, one with a similar angle dependence to the low-pressure signal and a second with a weaker angle dependence and
g-values in the 2.05-2.10 range. This corresponds to field rotation within the plane of the d𝑥2−𝑦2orbital, i.e. the ⊥
increasing the pressure to 2.1 GPa, the EPR intensity is observed only in a single, broad low g-value signal that displays a weak angle dependence. This is direct evidence that the magnetic d𝑥2−𝑦2orbital has switched from the
CuF2O2 plane to the CuF2N2 plane. Access to the pressure at which the second phase transition was observed (i.e.
to Phase IV) were beyond the technological capabilities of the plastic EPR cells.
Figure 17. (a) Experimental EPR spectra recorded at 10 K as a function of field orientation within the ab plane of a single crystal (transmission offset). The three panels correspond to three different pressures and microwave frequencies. Spectra were recorded every 10°, with 0° corresponding to the field along the a-axis; the field orientations corresponding to the top and bottom traces are indicated in each panel. (b) EPR peak positions taken from (a) together with data obtained at other frequencies (not shown), plotted as their corresponding g-factors versus the orientation of the applied field within the ab plane of the crystal.
4. Ni compounds
Research in the field of Single-Ion Magnets (SIMs) has focussed on achieving precise control over the coordination geometry of a single paramagnetic (d-/f-block) metal ion in order to construct a specific ligand field that generates first order spin-orbit coupling (SOC) [59-61]. An attractive option for HP measurements is NiII for which a range
of 4-/5-coordinate, air-/moisture-stable species are known. For example, ambient pressure magnetic measurements and HF-EPR studies performed on both oriented single crystals and powder samples of the complex [Ni(MeDABCO)2Cl3](ClO4) (13, MeDABCO = 1-methyl-4-aza-1-azoniabicyclo[2.2.2]octanium) had shown it to
possess |D| ≥ 400 cm-1 [62]. Given that |D| is highly sensitive to changes in coordination geometry, it appeared an
ideal candidate to explore the effects of pressure. Complex 13 (Figure 18) crystallises in the orthorhombic space group Pca21. The structure describes a simple 5-coordinate, slightly distorted trigonal prismatic NiII ion bonded to
two axial MeDABCO+ ligands and three equatorial Cl- ions (Table 8). The structural distortions away from ideal
D3h symmetry arise from the JT effect which splits the degeneracy of the d𝑥𝑧- d𝑦𝑧 and d𝑥2−𝑦2 - d𝑥𝑦 pairs of
Figure 18. (a) The molecular structure of the cation of 13. Colour code: Ni = cyan, N = blue, C = grey, Cl = green. H atoms and counterions are omitted for clarity. (b) NEVPT2-LFT computed d-orbital energies of the NiII ion in
at ambient pressure along with the most significant excitations that contribute to the total D value: (i) −488 cm−1;
(ii) +22 cm−1; (iii) +19 cm−1; (iv) +8 cm−1.
Table 8. Selected distances (Å) and angles (°) in compound 13 as a function of pressure (GPa).
P / GPa Ni1–N11 Ni1–N21 Ni1–Cl1 Ni1–Cl2 Ni1–Cl3
ambient 2.230(2) 2.215(2) 2.293(1) 2.3016(9) 2.305(1)
1.65 2.199(6) 2.190(6) 2.295(2) 2.298(3) 2.311(2)
N11–Ni1–N21 Cl1–Ni1–Cl2 Cl2–Ni1–Cl3 Cl1–Ni1–Cl3
ambient 177.1(1) 123.2(1) 119.0(1) 117.7(1)
1.65 176.2(2) 124.3(1) 123.4(1) 112.3(1)
HP single-crystal XRD measurements were performed using Fluorinert FC-77 at four different pressures, to a maximum of 1.65 GPa; unit cell parameters were determined over the pressure range 0.58–3.51 GPa [64]. 13
remains in the same space group in the full pressure range without major changes in the relative orientation of the molecules in the lattice (the volume decreases from 2145.0(4) Å3 at ambient to 1936.4(3) Å3 at 1.65 GPa), and the
effect of applying pressure on the bond lengths around the NiII ion is negligible (Table 8). In contrast, there are
significant changes to the equatorial bond angles: Cl1–Ni1–Cl2 and Cl2–Ni1–Cl3 increase to 124.3(1)° and 123.4(1)°, respectively, while Cl1–Ni1–Cl3 decreases to 112.3(1)°. A small decrease in the trans N–Ni–N angle is also observed (177.1(1)→176.2(2)°). The net result is a further lowering of the symmetry around the metal centre, as confirmed by continuous shape measures which reveal S(D3h) = 0.09 at ambient pressure and S(D3h) =
0.23 at 1.65 GPa [65].
found to coincide with this axis. The origin of the very large D value is the closely lying d𝑥2−𝑦2and d𝑥𝑦 orbitals
(their separation is ~239 cm−1) which contribute −488 cm−1 to the total D parameter. Significant, but smaller,
positive contributions stem from excitations from the d𝑥𝑧 and d𝑦𝑧 orbitals to the d𝑥𝑦 orbital. Calculations on the
structure collected at higher pressure suggest a decrease in D by approximately one third, from −399 cm−1 at 0
GPa to −264 cm−1 at 1.4 GPa, highlighting the extreme sensitivity of the magnetic anisotropy to small structural
changes in the Cl-Ni-Cl angles (Table 9). Specifically, these changes lead to a larger separation between the d𝑥𝑦
and d𝑥2−𝑦2 orbitals, which directly correlates with a decrease in the major contribution to |D|. This is accompanied
by an increase in the rhombic anisotropy, E, from 0.10 cm−1 at ambient pressure to 0.86 cm−1 at 1.4 GPa, which
originates from the increased separation between the d𝑥𝑧 and d𝑦𝑧 orbitals and an increase in the tunnel splitting
between the MS = ±1 states. Using the ab initio calculations and HF-EPR data as a starting point, simulations of
HP dc magnetic susceptibility data (T = 290 – 2 K, B = 1 T) collected at four different pressure points to a maximum pressure of 1.08 GPa show clear agreement with a decrease in |D| and an increase in |E| with pressure (Table 10). The availability of theoretical methods for the calculation of anisotropy, exchange coupling coupling and other magnetic parameters, together with elucidation of the orbital interactions that influence them, is a major development in the field of high-pressure coordination chemistry. We anticipate that it will not only enable meaningful conclusions to be drawn from data which can on occasion suffer from poor statistics, but, as this and the next study show, it also pin-points the electronic source of the magneto-structural correlations seen experimentally.
Table 9. NEVPT2 calculated D and E values computed from the high-pressure single-crystal X-ray data along with the most prominent contribution to D, the tunnel splitting of the MS = ±1 levels and the δ value computed
for the structure.
P / GPa D / cm–
1
E /
cm–1
Contribution from 1st excited state
(NEVPT2) / cm–1
Tunnel splitting / cm–1
Sum of Cl–Ni–Cl angle deviation, δ / °
ambient –399 0.104 –488 0.21 6.49
0.58 –347 0.208 –435 0.42 7.64
0.90 –317 0.419 –403 0.84 10.44
1.40 –264 0.861 –346 1.72 15.19
1.65 –264 0.871 –346 1.75 15.4
Table 10. Parameters used for the simulation of the magnetic data for complex 13.
P / GPa gz gx gy D/cm–1 E/cm–1
ambient 3.36 2.05 2.05 –399 0.10
0.52 3.28 2.12 2.13 –349 0.22
0.79 3.24 2.16 2.18 –323 0.33
5. Re compounds
Our interest in single ions possessing large magneto-anisotropies next led to ReIV [66]. The complexes
[ReCl4(MeCN)2]·MeCN (14) and [ReBr4(bpym)] (15, bpym = 2,2’-bipyrimidine) (Figure 19) are characterised by
large magnetic anisotropies and significant intermolecular magnetic exchange interactions mediated through Re– X···X–Re type contacts (X = halogen), resulting in spin canting (the non-colinearity of neighbouring spin centres) and magnetic order at low temperature (TC (14) = 6.5 K, TC (15) = 18.0 K) [67,68].The dipolar exchange pathways
arise as a result of the spin density from the ReIV ion being significantly delocalised onto the peripheral atoms of
the ligand. Intermolecular magnetic exchange interactions can be modified by changing intermolecular distances,
i.e. making these distances shorter would be expected to increase the strength of the exchange and increase the ordering temperature, and one way of achieving this is to exert hydrostatic pressure.
Figure 19. (a) The molecular structure of (a) 14 and (b) 15. Colour code: Re = purple, N = blue, C = grey, Cl = green, Br = light brown. H atoms and solvent molecules are omitted for clarity.
Compounds 14 (Pnma) and 15 (P212121) crystallise in orthorhombic space groups, with the metal ion occupying
a distorted octahedral environment, bonded to two N-atoms and four halides. The extended structures display staggered zig-zag chains that propagate along the a-axis of the unit cell via interhalide dispersive interactions (Figure 20). Under pressures of up to 4.30 GPa unit cell volumes decrease by 20% (14) and 14% (15), the principal component of compression occurring down the c-axis of the unit cell in both cases [69]. Complex 15 undergoes a phase transition between 1.93 GPa and 3.06 GPa to a monoclinic phase with space group P21, and when subjected
to complete compression-decompression cycles to 4 GPa, both complexes return to their original ambient pressure unit cell/space group. In addition, ambient pressure crystal structures solved at T = 4 K show both species retain their room temperature structures. The most significant structural changes observed under pressure in 14 and 15
occur in the intermolecular Re-X···X–Re distances. For compound 14 the Re–Cl4···Cl2–Re distance shortens by
Figure 20. The extended structures of (a) 14 and (b) 15. Colour code: Re = purple, N = blue, C = grey, Cl = green, Br = light brown. H atoms and solvent molecules are omitted for clarity. The dashed lines show the halide···halide interactions.
High pressure SQUID magnetometry was performed on microcrystalline samples of 14 and 15 using Daphne oil as the hydrostatic medium. HP dc magnetic measurements (T = 50.0 – 2.0 K, B = 0.01 T) were collected at ambient pressure to a maximum pressure of 4.1 GPa for 14 (4.2 GPa for 15). These experiments show that the application of hydrostatic pressure leads to an increase in ordering temperature (Figure 21). At the highest pressures measured,
TC (determined from field cooled and zero-field cooled measurements as a function of temperature) reaches 28 K
at 4.10 GPa for 14, and 42 K at 4.30 GPa for 15. For 14, this represents a four-fold enhancement, with the rate at which TC increases being 5.1 and 5.4 K GPa−1 for 14 and 15, respectively. The phase transition observed for
compound 15 does not affect the monotonic increase of the ordering temperature, and in both cases the changes in
TC are reversible; recovery of the ambient pressure TC is observed when the pressure is released from the cell.
Figure 21. Pressure dependence of the ordering temperature of (a) compound 14 and (b) compound 15.
Density functional calculations show that the shortest Re-X···X-Re pathways generate the most efficient magnetic exchange interactions at all pressures, and that an increase in the magnitude of J in 14 and 15 is observed when external pressure is applied, in agreement with increasing TC in both systems. The correlation between parameters
Figure 22. Magneto structural correlations in 15. The blue circles represent the pressure dependence of the ordering temperature, while the red circles the exchange interaction J. The lines represent the linear best-fit.
Conclusions
Despite HP single crystal XRD being available since the 1950s reports of its combination with other HP techniques (magnetometry, INS, EPR, absorption/emission/Raman spectroscopy) to examine magneto-structural relationships in molecule-based magnets remain rather rare. This is surprising given the enormous potential benefits on offer. This may be partly due to technology – the design and manufacture of pressure cells for other types of measurements (e.g. magnetometry, EPR) lag behind that of DACs for single crystal XRD and these pressure cells often do not reach the same high pressures. Sod’s law dictates this is often where the structural changes occur. However, this is not always the case, and as we have summarised above, it is possible to extract a wealth of fascinating and useful information. Looking just at magnetic coordination compounds we have discovered that pressure can lead to significant changes in bond angles and distances around metal centres, reorientation of JT axes, the breaking and forming of bonds, polymerisation/depolymerisation, multiple phase transitions that can depend on the hydrostatic medium, colour changes, switching of the sign of magnetic exchange interactions (F↔AF), enormous changes in zero-field splitting parameters and magnetic ordering temperatures. This wealth of intramolecular effects distinguishes coordination complexes from purely organic materials, where, except for leading to changes in conformation, the effects of pressure are usually exclusively intermolecular, albeit with some notable exceptions [70]. With ever-improving cell design now making a breadth of characterisation techniques available to a HP studies we hope that this review article highlighting our own work can serve as an example, and as a stimulus, for other researchers to realise that HP techniques may be a valuable addition to their experimental toolkit.
† All quoted exchange interactions in this review are derived from the H = -2JijSiSj formalism
Author Contributions: A.E.B., S.A.M., M.M. and E.K.B wrote the manuscript. S.P., K.V.K. and M.R.P. proof-read, reviewed and edited the manuscript. All authors have read and agreed to the published version of the manuscript.
Acknowledgements: We would like to acknowledge the hard work and dedication of all the PhD students and PDRAs who have worked on these projects funded on the above named grants. Alessandro Prescimone, Pascal Parois, Scott McKellar, Javier Sanchez-Benitez, Sergio Sanz, Xiao Wang, Chris Woodall, Jose Martinez-Lillo, Charlie McMonagle, Gavin Craig, Helen Duncan, Angelos Canaj and Marco Coletta.
Conflicts of Interest: The authors declare no conflict of interest.
References
1. Moggach, S. A.; Parsons, S.; Wood, P. A. High-pressure polymorphism in amino acids. Crystallogr. Rev.2008,
14, 143-183.
2. Moggach, S. A.; Parsons, S. High pressure crystallography of inorganic and organometallic complexes. In
Spectroscopic Properties of Inorganic and Organometallic Compounds: Techniques, Materials and Applications, Yarwood, J.; Douthwaite, R.; Duckett, S. B., Eds. 2009; Volume 40, pp. 324-354.
3. McKellar, S. C.; Moggach, S. A. Structural studies of metal-organic frameworks under high pressure. Acta Crystallogr. B2015, 71, 587-607.
4. Collings, I. E.; Goodwin, A. L. Metal–organic frameworks under pressure. J. Appl. Phys.2019, 126, 181101. 5. Piermarini, G. J.; Mighell, A. D.; Weir, C. E.; Block, S. Crystal Structure of Benzene II at 25 Kilobars. Science
1969, 165, 1250-1255.
6. Bezzu, C. G.; Burt, L. A.; McMonagle, C. J.; Moggach, S. A.; Kariuki, B. M.; Allan, D. R.; Warren, M.; McKeown, N. B. Highly stable fullerene-based porous molecular crystals with open metal sites. Nat. Mater.2019,
18, 740-745.
7. Moggach, S. A.; Allan, D. R.; Parsons, S.; Warren, J. E. Incorporation of a new design of backing seat and anvil in a Merrill-Bassett diamond anvil cell. J. Appl. Crystallogr.2008, 41, 249-251.
8. Giriat, G.; Wang, W.; Attfield, J. P.; Huxley, A. D.; Kamenev, K. V. Turnbuckle diamond anvil cell for high-pressure measurements in a superconducting quantum interference device magnetometer. Rev. Sci. Instrum.2010,
81, 073905.
9. Binns, J.; Kamenev, K. V.; McIntyre, G. J.; Moggach, S. A.; Parsons, S. Use of a miniature diamond-anvil cell in high-pressure single-crystal neutron Laue diffraction. IUCrJ2016, 3, 168-179.
10. Shirotani, I.; Inagaki, Y.; Utsumi, W.; Yagi, T. Pressure-sensitive absorption spectra of thin films of bis(diphenylglyoximato)platinum(II), Pt(dpg)2: potential application as an indicator of pressure. J. Mater. Chem. 1991, 1, 1041-1043.
11. Sussardi, A.; Hobday, C. L.; Marshall, R. J.; Forgan, R. S.; Jones, A. C.; Moggach, S. A. Correlating Pressure-Induced Emission Modulation with Linker Rotation in a Photoluminescent MOF. Angew. Chem. Int. Ed.2020, 59, 8118-8122.
12. Benjamin, H.; Richardson, J. G.; Moggach, S. A.; Afanasjevs, S.; Warren, L.; Warren, M. R.; Allan, D. R.; Morrison, C. A.; Kamenev, K. V.; Robertson, N. Pressure-induced non-innocence in bis(1,2-dionedioximato)Pt(II) complexes: an experimental and theoretical study of their insulator–metal transitions. Phys. Chem. Chem. Phys.
2020, 22, 6677-6689.