1
Collaborative Groundwater Modeling: Open-Source,
Cloud-Based, Applied Science at a Small-Island Water Utility Scale.
Christopher K. Shuler1,* and Katrina E. Mariner2
1. Water Resources Research Center and Department of Geology and Geophysics, University of Hawaii at Manoa, 1680 East West Road, HI 96822, USA, [email protected], 1 (808)-956-7640 * Corresponding Author.
2. American Samoa Power Authority, American Samoa USA
Declarations of interest: none
Abstract
Recent advances in cloud-computing and social-networking are influencing how we
communicate professionally, work collaboratively, and approach data-science tasks. Here we show how the groundwater modeling field is well positioned to benefit from these advances. We present a case study detailing a vertically-integrated, collaborative modeling framework jointly developed by participants at the American Samoa Power Authority and at the University of Hawaii Water Resources Research Center. The framework components include direct collection and analysis of climatic and streamflow data, development of a water budget model, and
initiation of a dynamic groundwater modeling process. The framework is entirely open-source and applies newly available data-science infrastructure using Python-based tools compiled with Jupyter Notebooks and cloud computing services such as GitHub. These resources allow for seamless integration of multiple computational components into a dynamic cloud-based
workflow that is immediately accessible to stakeholders, resource managers, or anyone with an internet connection.
2 Highlights
Used cloud-based methods to collaborate with remote stakeholders in American Samoa
Applied open-source tools to develop a collaborative hydrologic modeling framework
Used seamless framework to integrate multiple data collection and modeling components
Components included monitoring network, water budget model, and groundwater model
Keywords
Groundwater Modeling, Hydrologic Monitoring Network, American Samoa, Jupyter Notebooks, GitHub, Python
Software and Data Availability
All raw data, model code, and processed model outputs are archived under an open-source license in the project repository on GitHub titled ASPA-UH_Integrated_Modeling_Framework. Developer contact information is: Christopher Shuler, Water Resources Research Center and Department of Geology and Geophysics, University of Hawaii at Manoa, 1680 East West Road, HI 96822, USA, [email protected], 1 (808) 956 7847. We archived and released the most recent version if the repository in September 2019, which can be accessed at:
http://doi.org/10.5281/zenodo.3460214. The working version of the repository can be accessed at: https://github.com/cshuler/ASPA-UH_Integrated_Modeling_Framework.
3
1. Introduction
For the last half-century, computational modeling has become a principal tool in the water resource manager’s toolbox. Groundwater models have become indispensable, industry standard methods for estimating the availability and sustainability of groundwater resources (e.g. Young & Bredehoeft, 1972; Cummings & McFarland, 1974; Willis & Yeh, 1987). However, because of the inherent complexity of numerical models and the significant time, effort, and expertise needed for their development, it is often challenging for stakeholders and water resources managers to access models that are appropriate for their needs (Essawy et al., 2018). Within the traditional model development paradigm, water management agencies usually take one of two approaches for obtaining hydrologic models to suit their needs, 1) dedicate significant resources to building internal modeling capacity or 2) contract with outside ‘experts’ to deliver models that typically cannot be interacted with once completed. Drawbacks to the former approach include the high cost of training, software, and salary required for agencies to retain personnel with sufficient skills to assess the validity, conceptualization, calibration, and usefulness of existing models or to create and maintain effective modeling programs. This level of resource dedication is often only possible for larger utility companies or management
agencies, leaving small, remotely located agencies with few to no options for accessing quality modeling tools. On the other hand, the latter approach of hiring contractors generally results in production of static models that may lose relevance quickly and are often delivered in a format that do not allow end-users to modify parameters or address new questions. This approach also suffers from the inherent temporariness of typical funding mechanisms, whereas the calibration and validation process lasts only as long as the project account is solvent, after which a final report is delivered and the latest iteration of model files are archived for long-term storage on a server in the back of someone’s office. Compounding this issue is the fact that many
groundwater models are developed with proprietary software or within specialized
computational environments, making it prohibitively challenging for end-users to open and interact with the finished product.
4
framework conceived as a joint effort between the University of Hawaii Water Resources Research Center (UHWRRC) and the American Samoa Power Authority (ASPA). The intended outcomes for this modeling framework are commensurate with the motivations behind the participatory and collaborative modeling movement that has, in recent decades, become a highly utilized approach in environmental management (e.g. Argent and Grayson, 2003; Liu et al., 2008). These outcomes are centered around addressing the need for enhanced researcher – stakeholder engagement and producing, practical, defendable models that sufficiently address stakeholder needs and promote model use in guiding important water management decisions. This paradigm allows for incorporation of the views, needs, and knowledge of many
stakeholders, including scientists, policy makers, and resource managers in the modeling process. Moran (2016) describes the collaborative process as one where, “…model developers, decision-makers, stakeholders and others work together to develop a shared understanding of [the region’s] management objectives and the model’s role in supporting those objectives. Langsdale et al. (2013) further refines collaborative modeling as a process where, “Both the model and the process remain accessible and transparent to all participants, Collaborative modeling builds trust and respect among parties.”
Participatory and collaborative modeling methods are well tested and have been applied across many disciplines ranging from computer science (e.g. Bidarra et al., 2001), to economics (e.g. Mendoza and Prabhu, 2006), and social sciences (e.g. Flint et al., 2017). The approach is especially pertinent in water resource management, as water’s indispensable and ubiquitous nature inherently makes any issue a multi-stakeholder concern. In the water resources field, collaborative or participatory approaches have been applied in numerous case studies across a range of technical foci including watershed modeling (e.g. Liu et al., 2008), groundwater
modeling (e.g Barfield, 2009; Beall et al., 2011), and water policy and planning (e.g Tidwell et al., 2004). However, the technological boundaries for the implementation of this collaborative paradigm within the high-level programming revolution of the present day have not yet been fully explored. Here we contend that recent developments in cloud-computing technologies are now providing new opportunities for collaboration and communication between remotely located institutions. Application of new technological tools within a collaborative paradigm allows
5
The primary objective of this manuscript is to present an example of a collaborative hydrologic modeling framework that that takes advantage of recent advances in cloud-computing and open-source modeling tools. The framework is vertically integrated as it is intended to handle all components in the process that ultimately leads to the development of groundwater models used for drinking water management. These components include: (1) the direct collection and processing of basic hydrologic parameters through an island-wide hydrologic monitoring network, (2) development of automated data processing applications to integrate updated data into subsequent model components, (3) creation of a dynamic water budget model to predict island-wide groundwater recharge and (4) development and application of a set of open-source groundwater modeling tools that can be directly modified by stakeholders to address local water resources management questions.
The framework is intended to be entirely open-source, and all raw data, model code and processed outputs are made publicly available online, so anyone with skills and interest can modify inputs, test scenarios, and continue model development. This philosophy promotes transparency, reproducibility, and accessibility through both the development and
6
2. Case Study Setting
The island of Tutuila is the main population center of the U.S. territory of American Samoa. It is located near 14° S and 170° W, and at 142 km2 is the third largest island in the Samoan hot-spot island chain. Geologically, Tutuila contains two distinct provinces. The bulk of the island is composed of an older, highly eroded basaltic shield edifice (1.5 to 1.0 Ma), and recent
(Holocene age) rejuvenation-stage volcanism on the southwestern flank of the older shields has created the younger Tafuna-Leone Plain (Stearns, 1944; McDougall, 1985). The young
pahoehoe flows of the Tafuna-Leone Plain give it a higher hydraulic conductivity (K) than the Older-Volcanic Unit, which is composed of a heterogeneous mixture of a’a lava flows,
pyroclastic materials, and trachyte domes (Stearns, 1944; Eyre and Walker, 1991). Geological subdivisions within each of these units exist, and may be used as the basis for further
refinement into zones with different hydrogeologic properties (Izuka et al., 2007). Tutuila’s climate is warm and humid with abundant, year-round rainfall due to its position within the South Pacific Convergence Zone. The island experiences a wetter season with increased precipitation amounts from October to May, and a drier season with less, though still significant, precipitation from June to September. Rainfall varies considerably with location and elevation, and ranges between 1,800 mm/yr near the Tafuna Airport up to more than 5,000 mm/yr along the crest of the highest mountains (Daly et al., 2006). The region is also influenced by tropical storms and hurricanes, and an average of 25 to 30 significant thunderstorms affect the island annually (Kennedy et al., 1987).
7
(Izuka et al., 2007; ASPA, 2013, Shuler et al., 2014, Shuler et al., 2017). While each of these models addressed a specific question, ranging from defining well-capture zones to modeling nutrient transport, none have satisfied the requirements to fully address ASPA’s water
management needs. The static nature of these models also restricts their ability to be modified, and ASPA, like most small-scale water utilities, does not have time or resources to support building and maintaining an active hydrologic modeling program on their own.
2.1 Collaborative Groundwork and Stakeholder Needs
In American Samoa, ASPA is the only water utility and the agency is also responsible for all municipal power, wastewater, and solid waste services. American Samoa is a unique
environment as it is small (population of approximately 60,000), geographically isolated (4,000 km to the nearest continent), and a sovereign society still retaining much of its indigenous culture and tradition. Therefore, ASPA is particularly invested in not only meeting customer needs, but also in conservation and responsible stewardship of the island’s limited natural resources. The Water Resources Research Center is a technical research unit at the University of Hawaii, and its stated mission is, “To promote understanding of critical state and regional [including the U.S. Affiliated Pacific Islands] water resource management and policy issues through research, community outreach, and public education.” To fulfil this mission in American
Samoa, UHWRRC has been working with ASPA and other agencies since 2013 to develop an integrated water resources research program in the territory that strives to incorporate on-island stakeholder concerns into research priorities.
8
a recent training workshop conducted in American Samoa for ASPA and UHWRRC staff, the following modeling focused management priorities were identified:
- Assessing resource sustainability, through water budgets or sustainable yield estimates - Identifying new well drilling locations based on freshwater lens thickness
- Simulating contaminant plumes from sources including piggeries and industry - Identifying low-pressure zones and examining hypothetical stresses in the water
distribution system
These stakeholder-driven objectives currently guide the focus of our conceptual and numerical groundwater modeling activities, as well as the continued development of hydrological
monitoring operations.
3. Framework Development Methods
3.1 Cyberinfrastructure Framework
To make hydrologic monitoring data publicly accessible, and also to store projects and code in a way that allowed results to be automatically updated each time new data became available, a set of open-source, cloud-based applications were used as the cyberinfrastructure for our collaborative modeling framework. These applications have been imperative for facilitating communication, providing the ability to collaboratively code, and for taking care of the basic data science needs that would be overwhelmingly resource intensive for either agency to develop independently. We selected Jupyter Notebooks (https://jupyter.org) for Python-based coding and project development, GitHub (https://github.com) for project storage and version control, Skype and Google Hangouts (www.skype.com and https://hangouts.google.com) for
communication, and as of this writing, we are currently exploring different applications for live, cloud-based code execution (e.g. Binder and Google Colab) (https://mybinder.org and
9
The diverse and rapidly developing array of existing Python packages allows the language to be used reliably for every task across our collaborative modeling framework. Maintaining this methodological consistency streamlines execution of the modeling process by routing
computational outputs from one module as inputs to others. While computing languages such as Python, R, and MATLAB are commonly used for scientific model development (e.g. Borah and Bhattacharjya, 2013; Bakker et al., 2016; Yin et al., 2017), code-based tools have
nonetheless been historically difficult for end-users to access, due to steep learning curves and sometimes costly licenses. Jupyter Notebooks help to solve this issue by bridging the gap between “coders” and the uninitiated by integrating live code, equations, visualizations, web links, and explanatory documentation into notebooks to make them easier to understand and interact with (Perez and Granger, 2015; Kluyver et al., 2016). Because of this accessibility, Jupyter Notebooks are becoming increasingly popular amongst modelers and across many scientific disciplines (e.g. Subramanian et al., 2015; White et al., 2016; Somers, 2018). Though these advances may seem unimportant to those more familiar with coding, in a collaborative framework where team members with variable degrees of expertise wish to be involved in the modeling process, simplicity and ease of access is paramount for everyone’s engagement.
10
While GitHub provides online file storage and organization, it does not provide computational resources for running models. To avoid issues with local dependencies (software) and
computational resource limitations on individual user’s computers, we are currently exploring the utility of a number of open-source, cloud-computing resources dedicated to addressing this concern. Such services operate by opening a cloud-based Python environment on a remote server and installing all needed software at the time of use. There are numerous existing
resources including Binder and Google Colab, amongst others, that provide this service through seamless integration with Jupiter Notebooks and GitHub. At present, we have found these services to be most useful for conducting demonstrations of framework components during workshops or teleconferences. Finally, although a seemingly simple task, the importance of teleconferencing and specifically screen-sharing services cannot be overlooked for projects of this nature. For this project, Skype and Google Hangouts has been a significant boon for facilitating communication to and from American Samoa, which is still serviced by international telephone calling rates. These internet-based services allow participants to share screens and see visual output directly, and this is especially helpful when working within a fairly complicated modeling framework.
3.2 Modeling Framework
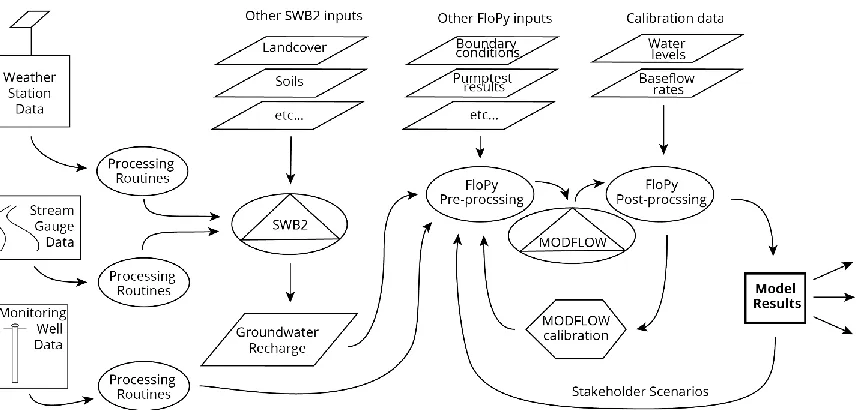
The Tutuila collaborative modeling framework is intended to include tools that address the island’s most pressing water management questions through three distinct, yet integrated components. These include (1) collection and automated processing of weather station, stream gauge, and monitoring well data from a hydrologic monitoring network, (2) development and application of a dynamic water budget model that produces and automatically updates an island-wide groundwater recharge coverage based on monitoring network data, and (3) ongoing collaborative development of dynamic regional and local scale numerical groundwater models that automatically intake the most recent recharge coverage and monitoring well data.
11
model script. We developed the Tutuila water budget model, with the Soil-Water Balance 2 (SWB2) code developed by the USGS (Westenbroek et al., 2018). The SWB2 model calculates spatially distributed groundwater recharge rates at a monthly resolution, and all inputs and outputs are processed in the same Python development environment as the monitoring network data. While linking these steps creates a complex network of interdependencies, consistency and organization are easily maintained through GitHub. The final component in the collaborative modeling process is a MODFLOW based groundwater model. This component, like those previously described, is developed within the same Python-based environment, thereby allowing for a cohesive workflow and seamless integration from raw data to model results. For
groundwater model development, we used FloPy, a Python based site package designed to simplify pre-processing, run-time, and post-processing tasks for development of MODFLOW based models. As new data is collected and uploaded, dynamic updates to the SWB2
generated groundwater recharge coverage are translated through to the FloPy models, which then, ideally, become more accurate every time new monitoring data is processed. Figure 1 shows a schematic of the data processing and modeling workflow for the ASPA-UHWRRC cooperative modeling framework.
12
3.3 Hydrologic Monitoring Network
Beginning in the 1950’s, the U.S. Geological Survey (USGS) monitored rainfall and streamflow at multiple sites throughout American Samoa. However, in 2008 all USGS monitoring operations in the territory were halted, leaving a 7-year long data gap until 2015 when we began installing weather stations. Since 2015 we at ASPA and UHWRRC have worked to develop a monitoring network consisting of eight stream gauging stations, six weather monitoring stations, and three preliminary water level monitoring sites (Fig. 2). Hydrologic data from these instruments is imperative for estimating groundwater recharge, which is an important spatially distributed input variable in groundwater models, especially in island settings with very steep rainfall gradients. Both ASPA and UHWRRC contributed to instrument installation and we continue to work
together to maintain the network. To ensure continuity with data downloads and maintenance of physical infrastructure, ASPA created a full-time position for a hydrologic technician, and
UHWRRC continues to develop and maintain systems for data processing, quality assurance / quality control (QA/QC) procedures, and archiving and distribution of data.
All weather stations have the capability to record precipitation, temperature, relative humidity (RH), wind speed and direction, and solar radiation (SR). The network was initially developed using low-cost Spectrum Technologies Inc. WatchDog 2900ET weather stations (Spectrum item number 3350WD2), but as funding allows, these stations are incrementally being replaced with solar powered Campbell Scientific stations (Fig. 3) consisting of an RM Young Wind Sentry Set (03002-L12-PT), a CSL Temperature/RH Probe (CS215-L7-PT), an Apogee SP-110
Pyranometer (CS300-L12-PT), and a Texas Electronics Rain Gauge (TE525-L10-PT) (part numbers refer to Campbell Scientific catalog numbers). All stations are mounted on 2-3 m poles and placed at sites with the best balance of station-siting characteristics considering the
available terrain (WMO, 1983; U.S. EPA, 1987). Weather stations log at 15 minute intervals, and data is downloaded quarterly by the ASPA technician. Once downloaded, the technician simply uploads raw data files to the project repository on GitHub for processing and for long-term storage. Additional metadata and information about the ASPA-UHWRRC network is given in Shuler and El-Kadi (2018a).
13
minute intervals. The stream gauges physically consist of stainless steel HOBO Water Level Loggers (HOBO model # U20-001-01) i.e. pressure transducers (PT), installed in durable steel housings, which are permanently mounted to immobile structures such as bridges or bedrock outcroppings. Housings are constructed of perforated square galvanized steel pipe with a locking mechanism at the top (Fig. 3). Site selection involved field scoping and soliciting input from multiple departments at ASPA, other on-island stakeholders such as the American Samoa EPA, and also with hydrologists at other universities to ensure maximization of data utility. Site selection criteria included considering site access, proximity to historical gauges, bank and channel-control stability, and representativeness of the variability in Tutuila’s different climatic and geological regions. Additional metadata and information about the stream gauge network is available in Shuler and El-Kadi (2018a). Data is downloaded from loggers and uploaded to GitHub by ASPA on a quarterly basis.
In 2017 we initiated a pilot program to repurpose abandoned ASPA production wells as
14
Figure 2: Monitoring network instrument map for Tutuila Island with weather stations shown as green circles and stream gauges shown as blue triangles, and monitoring wells shown as black hexagons.
15
3.4 Tutuila SWB2 Model Development
The USGS developed the SWB2 Water Budget Modeling Code (Westenbroek et al., 2018) to allow users to easily calculate water budget components, and specifically groundwater recharge. Some functionality based on the Hawaii Water Balance Code (Engott et al., 2017) was incorporated into SWB2 making it one of the better suited options for modeling tropical basaltic islands in the Hawaiian or Samoan chains (Westenbroek et al., 2018). For this study, the SWB2 code was applied to develop a Tutuila Island groundwater recharge coverage that then served as an input to the FloPy groundwater model. The SWB2 code is based on a modified Thornthwaite-Mather (1955) soil-water balance approach, which in a simplified form is represented by the following:
Recharge = Rainfall – Runoff – Actual Evapotranspiration
For this study, runoff-to-rainfall ratios and temporal rainfall distributions derived from our monitoring network data were used as key input variables to the Tutuila SWB2 Water Budget Model. All other input datasets used for the SWB2 model were obtained from existing
publications or databases, with each being described in the respective documentation as cited below. All SWB2 inputs are either in the form of tabular lookup data or spatially-distributed datasets in the ESRI ascii grid format. Input files for the Tutuila SWB2 model included:
- Gridded monthly precipitation data (Daly et al., 2006)
- Precipitation gauge data used to represent temporal rainfall distributions (this study) - Land use data (Meyer et al., 2016)
- Impervious surface ratios (Meyer et al., 2016) - Canopy coverage ratios (Meyer et al., 2016)
- Soil-type data consistent with the NRCS SSURGO database (Nakamura, 1984)
- Direct infiltration data from municipal water line leaks (ASPA, personal communication) - Direct infiltration data from OSDS effluent discharge (AS-DOC, 2009)
- Runoff-to-rainfall ratios (this study; Perrault, 2010); Wong, 1996)
- Potential evapotranspiration data in monthly gridded format (Izuka et al., (2005). - Canopy evaporation data (Engott et al., 2015; AWS Truepower, 2014)
16
The SWB2 code calculates all water balance components at a daily resolution and output files are produced in NetCDF format. The Tutuila Water Budget Model, just like the other routines and models used in the framework, was designed to be dynamic, whereas once newly collected runoff and rainfall data are uploaded to GitHub, the seamlessly integrated workflow
automatically incorporates it into all subsequent calculations. Although a dynamic version of the Tutuila Water Budget Model is integrated as a module of the integrated modeling framework, a static version of the water budget model was published as a stand-alone version, for
documentation as Shuler and El-Kadi (2018b). This report along with all of the input data, code, and output data for the static version of the Tutuila Water Budget Model is publicly available at (https://github.com/UH-WRRC-SWB-model/SWB2-Tutuila).
3.5 FloPy Groundwater Model Development
In 1984 the USGS released the first version of MODFLOW (McDonald, and Harbaugh, 2003). Over three decades later, MODFLOW remains one of the most widely used groundwater modeling applications. The model’s large user base results from its simplicity and continuing evolution, and presently, the Python based module FloPy lies at one of the forefronts of USGS model development efforts (Bakker et al., 2016). FloPy is an open-source Python package that provides functionality to simplify pre-and post-processing tasks for the MODFLOW family of models, such as MODFLOW (Harbaugh et al., 2000), MT3DMS (Zheng and Wang, 1999), and SEAWAT (Guo and Langevin, 2002). Following the development philosophy of most Python packages, FloPy is open-source and constantly in-development, therefore new functionality continues to be added by the software’s developers and users. Presently, the FloPy package is relatively new, but it is rapidly gaining in popularity due to its modularity, open-source
availability, and support by USGS modelers (e.g. Rotzoll et al., 2016; Feo et al., 2018, Foglia et al., 2018). Benefits of using FloPy for developing groundwater models include: 1) model building and pre-processing steps are quick to execute, 2) specific inputs are easy to modify, for
17
paradigm quite well, simplifying the model evolution process as new stakeholder needs, development of new procedures, and updated data become available.
At present, we have initiated FloPy groundwater model development for regional scale models covering the whole-island, and because this component of the framework continues to be driven by direct stakeholder needs, sustained development is intended to continue into the foreseeable future; pending continued support from both UHWRRC and ASPA. Presently the scope of the groundwater modeling component of the framework is focused on (1) presenting examples of FloPy/Python modeling functionality using data from Tutuila and (2) providing opportunities for staff at ASPA to work with a ready built model and to experiment with applying results for management needs. While the model we have developed currently provides the foundation for models that will be applied by ASPA in the future, at present the model presented in this manuscript is not calibrated or validated to the point where it is intended to be used as a management tool. At the time of writing, we are collaboratively refining our existing modeling tools in order to lower uncertainties to the point where we can inform management questions with a higher degree of certainty. While development of the groundwater modeling component remains ongoing, throughout the process we have employed a common set of guiding principles to ensure that groundwater models integrate seamlessly into the greater collaborative
framework. These include:
1. The groundwater models only depend on tools that operate within the Python environment. This ensures seamless integration of this component with the others. 2. Model steps are broken into manageable units in order to make the process easy to
understand. Each step is annotated with text-based explanations in markdown cells separating code blocks, and input data and important parameters are clearly defined, typically in a dedicated cell.
3. Whenever possible, output from each step is automatically visualized using in-line plots. Plots are also saved as images and as geographic data files, using ‘.kml’ format, which open directly in end-user mapping platforms.
4. All input datasets are simple, cleanly organized, and well annotated. Participants can directly modify inputs if needed or when other updated datasets become available. 5. Calibration routines automatically incorporate updated observation and input data, e.g.
18
6. Cell size resolution is simple to modify so experimentation can be performed at low resolution with short morel run times. Resolution can then be increased for sensitivity testing or creating finalized results.
7. All model files are kept small enough to be hosted on GitHub (under 100 mb each).
4. Process Implementation and Results
4.1 Monitoring Network Implementation
Weather stations and stream gauges are downloaded on a quarterly basis and the raw data require QA/QC processing and integration with previous data to create long-term station records. We accomplish these tasks with Python based processing routines designed to produce output data that are formatted for use as input to the water budget model, with the primary weather station output accessed by the SWB2 model being a daily rainfall time series from each station. Once downloaded, the hydrologic technician at ASPA uploads raw data files directly to the cloud-based repository on GitHub (Shuler and Mariner, 2019), and new datasets are automatically incorporated with previous datasets once the processing routine is run.
The weather station data processing routine includes:
- Consolidation and organization of raw data files into a single time series - Performing QA/QC checks
- Removing previously identified sequences of corrupted data from known station malfunctions
- Graphing datasets to allow users to inspect data validity (Fig. 4)
- Summarizing data at different time resolutions and creating output files both for distribution and to be used as input in the Tutuila SWB2 Water Budget Model
19
thereby necessitating continual updates to rating curves. Although rating curves can take many different mathematical forms, we have achieved the lowest error by applying a 2d-polynomial relationship between stage and discharge at the Tutuila gauging sites. Data from land-based barometers is also uploaded with stream stage data and used to automatically correct for transient changes in barometric pressure.
The data processing routine for stream gauge data includes: - Automated barometric compensation
- Removal of false readings
- Corrections for physical changes at gauging sites - Automated rating curve development
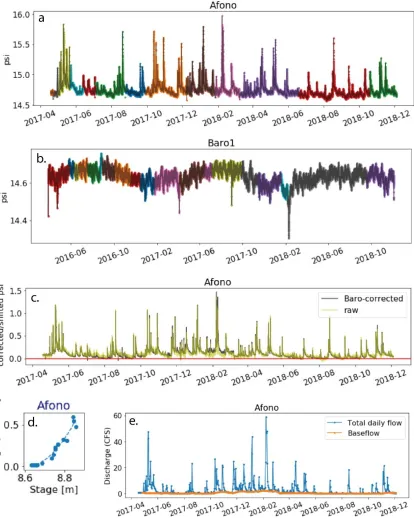
- Baseflow and surface runoff separation (Wahl and Wahl, 1995)
- Summarizing data into daily time series, monthly averages, and annual averages (Fig. 5)
The routine also generates monthly volumetric surface runoff rates for each basin above each gauge, which is the primary stream gauging output accessed by the SWB2 model to calculate runoff to rainfall ratios. An updated file is automatically generated each time new data is loaded and the routine is run, and this file is saved to a location directly accessed by the SWB2 model as it compiles input data.
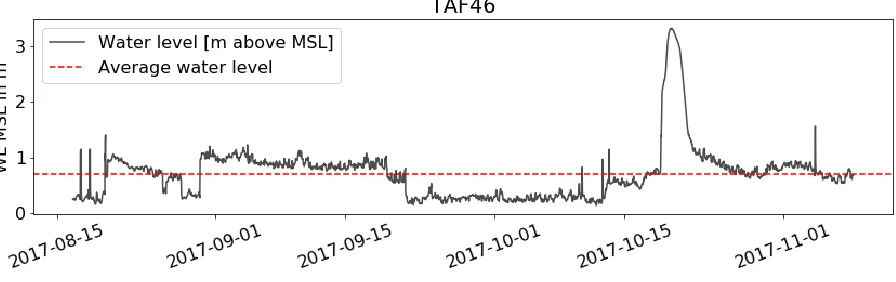
Monitoring well data is processed with a routine similar to the streamflow routine, where data is consolidated, barometrically compensated, and QA/QC procedures are implemented (Fig. 6). At present, the groundwater modeling component is set up as a steady state model, therefore the transient water level data is averaged to obtain a single water level value for each site, which is then consolidated with the other static water levels and used for calibrating the MODFLOW model.
20
21
Figure 5: Example visualizations for a selection of the procedures implemented in streamflow processing at the Afono Stream Gauge. Steps include but are not limited to, a) consolidation of individual
22
Figure 6: Example plot of preliminary water level data from Tafuna Monitoring Well #46. Raw data is processed with a routine similarly to the streamflow processing routine, and average water levels from each site are automatically updated for use as observation points in the groundwater model each time new data is collected and processed. Note strong aquifer response (in late October) to what was likely a heavy rainfall event.
4.2 SWB2 Model Implementation
The SWB2 model component was designed to be run as a series of modular cells, the first of which contain pre-processing routines that format shapefile or raster datasets into ascii grids for use in the SWB2 model. It is simple for the user to modify or substitute different input datasets during any of these steps if desired, to update the model or to assess different scenarios. The open-source SWB executable (https://github.com/smwesten-usgs/swb2) is run as a sub-process from the Jupyter Notebook. Once the SWB2 code is executed, the model output is
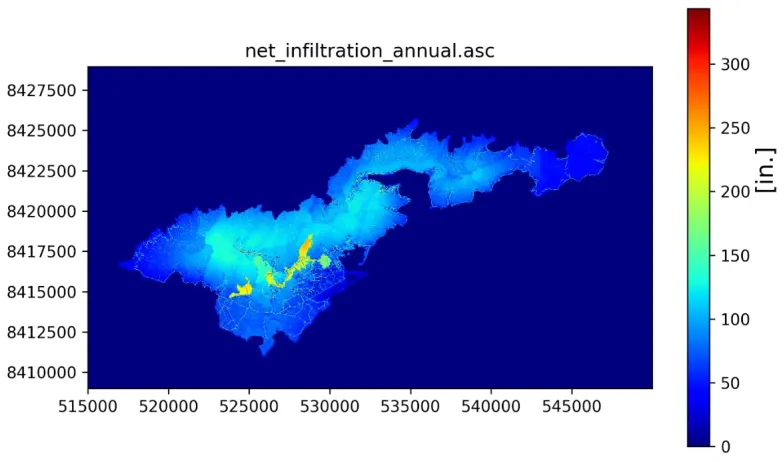
post-processed to produce annual resolution outputs for each water budget component. With the most current array of input data, the SWB2 output indicates that Tutuila receives approximately 402 Mgal/d as precipitation inputs, and of these inputs, approximately 33 Mgal/d or 8% are lost to canopy interception, 61 Mgal/d or 15% are lost to evapotranspiration, 84 Mgal/d or 21% are lost to island wide runoff, leaving the remaining 54% of inputs, totaling 221 Mgal/d, as the total island wide groundwater recharge estimate (Fig. 7). The annual groundwater recharge layer produced by SWB2 is then directly integrated into the FloPy pre-processing routine to supply the MODFLOW model with recharge rates at the desired spatial resolution. Because the framework is dynamic, results adjust as updated streamflow and weather station data are
23
The primary management utility of the water budget model lies in assessing different scenarios to show how possible future conditions may affect groundwater recharge. To develop recharge predictions in consideration of likely future climate scenarios, we modified the rainfall and temperature variables in the SWB2 model using output from gridded dynamically-downscaled climate projections for American Samoa (Wang and Zhang 2016). The gridded climate model data covered three specific scenarios: 1) present-day climate for the years 1990 to 2009, 2) future climate during the years 2080-2099 reflecting a lower-carbon emissions scenario (RCP4.5), and 3) 2080-2099 climate reflecting on a higher emissions scenario (RCP8.5). The Wang and Zang (2016) projections for both emissions scenarios predict significant increases in both precipitation and temperature, and when integrated into the Tutuila SWB2 model, this translated into overall increases in all water budget components as calculated by the modified SWB2 runs. Most notably, the 11% to 18% increase in precipitation predicted by the RCP8.5 and RCP4.5 scenarios, respectively, drove increases in groundwater recharge rates of 17% to 27%, respectively.
24
4.3 FloPy Model Implementation
One of the primary motivations behind developing the modeling framework within a cooperative paradigm was to build direct technical capacity at ASPA, the organization tasked with managing the island's water resources. Therefore, instead of focusing the groundwater model component on creating a single extensively calibrated static model realization, this component is designed to build modeling capacity and share knowledge between participants through the collaborative development of a set of modular FloPy-centric tools. By developing this portion of the framework as a dynamic toolbox we can continually adapt the models and data collection efforts to target specific water management questions as they arise. For example, ASPA is currently drilling a number of new production wells in the village of Malaeimi on Tutuila. As additional pump test and drawdown data are collected during well development, these tools can be directly applied by ASPA to help set sustainable pumping rates at the wells.
We developed the groundwater modeling toolbox as a series of Jupyter Notebooks that use the whole island of Tutuila as the model active area. When investigation of a more localized area is desired, the active area can be changed by substituting different shapefiles and the scripts can be reused with only a small amount of modification. The implementation presented here covers the whole-island model, which is intended to demonstrate the application of these tools.
However, the validity of the regional scale realization is severely limited by the spatial
distribution of available observation data, which is a common issue when modeling steep and challenging terrains, such as high volcanic islands, where wells are only located in coastal areas. Therefore, results and plots based on this realization should be considered to be for demonstration purposes only and should not be directly used for management purposes at this time.
25
4.3.1 Model Initialization
The first cells of each notebook consolidate explanations, variable definitions, and settings (grid
size, time steps, etc…) to make it easy for users to understand and interact with the model. All
modules were written to automatically adjust for changes in grid resolution so users can reduce
model run time when experimenting. Input datasets are clearly defined in a single cell so users
know what data goes into each model. The subsequent Jupyter Notebook cells each contain a
separate module that handles a specific model development task. These tasks generally
correspond to specific MODFLOW packages, for example geolocation and model grid
boundaries are defined in a single cell that creates the MODFLOW “.dis” package. In this cell
the grid is defined by importing a projected shapefile, determining its extent, and extending the
grid edges beyond the shapefile edges by a defined percentage. For this case study, the grid
covers an area 5% larger than the extent of the -50 m bathymetric contour around Tutuila (Fig
8a). The “.bas” package contains model active areas and boundary conditions such as specified
head or general head boundaries. We define these by overlaying shapefiles onto the model
grid, and creating grid indexed arrays to assign conditions to individual cells. For the Tutuila
model, the area inside of the -50 m bathymetric contour, which geologically represents the
former maximum areal extent of the island prior to erosion and subsidence (Stearns, 1944), is
defined as the model active area, and the submarine area between this contour and the island’s
coastline is set as a general head boundary to simulate the freshwater head (set to 0.01 m)
exerted on the ocean bottom by seawater. (Fig 8b). The model top and bottom elevations are
defined with a digital elevation model (Fig 8c) and a constant depth value of 1000 ft.,
respectively. Model stress periods and time steps are also defined for the “.bas” package.
26
Figure 8: Example visualizations of FloPy model input datasets including: a) model grid area and
coastline shape, b) model area set as general head boundary condition, c) model cell top elevations, and d) downsampled recharge coverage, originally from the SWB2 model.
27
4.3.2 Model Execution and Calibration
With the FloPy package model inputs can be formatted and the MODFLOW executable can be
run directly from a single Python interface. This functionality allows the model to be wrapped
into a loop, function, or class for model calibration and sensitivity testing. Calibration can be handled by a wide array of widely used Python-based optimization packages such as SciPy (https://www.scipy.org/), PEST (http://www.pesthomepage.org/), or other custom built
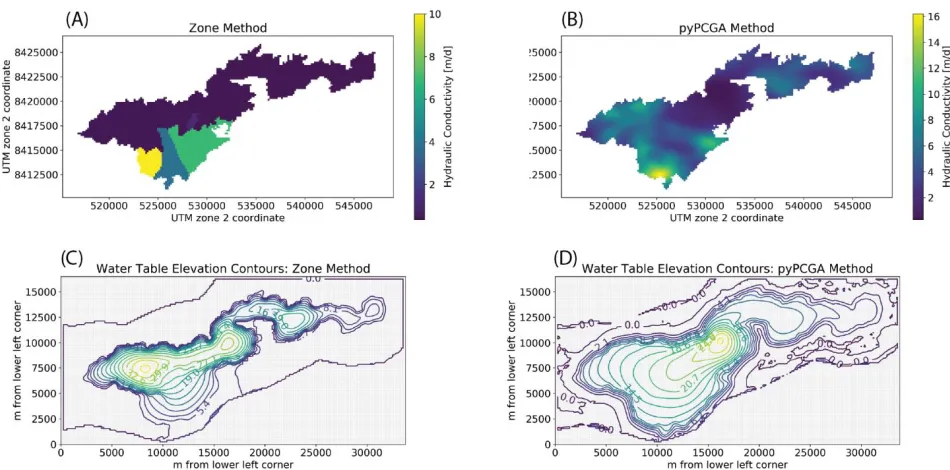
optimization packages such as pyPCGA (Lee et al., 2016). To optimize the Tutuila model, we have designed two different workflows to calibrate for spatially distributed K values using a zone based approach and a grid based method both of which minimize error between observed and simulated water levels. The zone based approach divides the island into different hydrogeologic zones based on a geologic map (Stearns, 1944) and a single K value for each zone is
parameterized for optimization using the scipy.optimize.minimize package (Figs. 10a and 10c). The grid based approach applies principal component geostatistical approach (Kitanidis and Lee, 2015) by applying the open-source pyPCGA Python package. This package provides a ready-built, computationally inexpensive inversion method to solve for large parameter sets, in this case each model cell, with low numbers of observations. Each method has different benefits and costs, and the same model can be run with both to provide managers with a sense of how initial assumptions and methods may affect the model output (Figs.10b and 10d).
The static water level observations used for calibration were collected from historical records and monitoring wells in the monitoring network. Historical observations are taken from all known driller’s logs and production well pump test logs conducted at the time of drilling. These “pre-development” water levels represent the most reliable, spatially distributed static water level
information for Tutuila, since no dedicated monitoring wells have been drilled on the island.
Historical water levels are lumped together with average water levels from the monitoring
network and these water levels are automatically updated as monitoring well instruments are
downloaded, and data is uploaded to GitHub. As new wells are drilled by ASPA, or as
production wells are taken offline and converted to monitoring wells, these data will be included
as well. Please note that the model results shown in the figures below are example
28
Figure 10: Examples of calibrated hydraulic conductivity (K) distributions and resulting water table elevation contours. A) shows zone-based K calibration based on simplified geologic units from Stearns (1944). B) shows grid-based K calibration developed using the pyPCGA optimization technique. C and D) water table elevation contours computed using the zone-based and the pyPCGA methods, respectively. Note that results are shown only for demonstration purposes as the model calibration remains, as of this writing, in an oversimplified state.
5. Discussion and Conclusions
The traditional approach to groundwater modeling has a number of significant drawbacks. It is expensive, it produces products with limited longevity, and it is technologically dated. Recent
advances in social-networking are spilling over into how we communicate professionally, how we work collaboratively, and how we approach data-science. Scientific endeavors, and especially computational tasks such as groundwater modeling, are well poised to take advantage of these new developments. Improvement in the sharability of information is
revolutionizing how we work with each other, and this allows for a new process-based paradigm that promotes the maintenance of long-standing project partnerships. The collaborative,
process-based approach is especially well suited to development of groundwater models on small islands such as Tutuila, where there is a critical management need for environmental
models, but limited resources to develop and maintain the scientific capacity to use them.
Groundwater modeling is a complex process and within the traditional paradigm, often takes
29
questions may become outdated, and newer more relevant questions may not be appropriate to
answer with a model designed for older objectives.
To create a low-cost and functional groundwater modeling solution in light of these challenges,
we developed a collaborative hydrologic modeling framework that integrates monitoring network
data, water budget modeling, and groundwater modeling into a seamless data-to-model
workflow. The workflow is made entirely open-source, reproducible, and dynamic by using tools
such as Jupyter Notebooks and GitHub. These tools manage the data-science infrastructure, so
the project team can focus on communication and development of models that are scientifically
relevant and useful for water resources management. The framework also leverages the
adaptability of the open-source, high-level Python environment. If a task cannot be performed
with the groundwater modeling package FloPy, then thousands of other freely available Python
modules covering a wide range of functions are available to be imported and integrated using
just a few lines of code. This functionality is probably the primary benefit of using FloPy for
groundwater model development, as it leverages the power of Python’s significant data analysis
and computer science library of readymade open-source packages, alongside a wealth of online
support, tutorials, and documentation. For example, in addition to automatically generating
plots, our model framework applies a KML writer to save all output figures in “.kml” format,
which allows users with no GIS experience to instantly open and interact with spatially distributed model data in end-user mapping platforms such as Google Earth
(https://www.google.com/earth). While we applied this framework to develop hydrologic models in American Samoa it could easily be adapted to other localities or other data-to-model
workflows.
5.1 Limitations of the Framework
The primary limitation of the collaborative modeling framework we propose here is the
significant investment needed from the participants. Process-based approaches by nature
30
relationship where neither party is obligated to maintain engagement, the strength of
collaboration relies on the cost to benefit ratio of maintaining the program for each organization. Therefore, in our program, we strive to ensure that the benefits of working together, such as improved access to resources, maintaining dynamic models, and improved understanding of results and uncertainties, outweigh the costs.
From a technical standpoint, generalization of the code is another limitation of the framework.
Since our backgrounds are in hydrology and not programing, the code used in this project is
primarily focused on meeting our and the stakeholder’s specific needs, rather than producing a
software product intended to generate similar results in different locations. Therefore, to apply
these workflows to other datasets will require variable degrees of modification depending on
their similarity in formatting and scale to the input datasets used in this workflow. Nonetheless,
to account for the lack of robustness built into the code itself, we have instead focused on
making our workbooks and workflows well annotated and easy to understand, so other potential
users can learn from these methods and develop their own through variable degrees of
modification.
5.2 Current and Future Management Applications
[r1]This case-study demonstrates a long-term, process-based groundwater modeling approach that
as of this writing, continues to evolve. As stakeholders continue to develop uses for data and
model results, and as our experience using these tools grows, we plan to continue developing
the framework to meet the management needs in American Samoa. Planned additions to the
monitoring network include additional streamflow stations and continued upgrades to weather
station infrastructure. Data will continue to be downloaded on a quarterly basis and streamflow
measurements for to rating curve updates remains ongoing. The water budget model will
automatically incorporate new monitoring data as it is updated quarterly, and we are currently
working directly with numerous stakeholders at agencies throughout American Samoa to
develop future land-use scenarios for the water budget model. These scenarios will be
incorporated with the future climate scenarios to provide multi-faceted predictions of impacts to
groundwater recharge under different possible futures.
The groundwater modeling component is, as stated before, ongoing with continued model
31
the transition zone. Collection of high-resolution salinity data is currently planned as part of ASPA’s system-wide operational-SCADA system upgrades, and as this data becomes available
we intend to improve the FloPy model by applying our existing calibration and validation
approaches, e.g. the scipy.optimize method and pyPCGA (Lee et al., 2016). In addition, we also
intend to explore and apply other open-source Python-based optimization modules such as
SALib (Herman, J., & Usher, 2017) and SPOTPY (Houska et al., 2015) to refine our existing
methods of sensitivity testing and model calibration. The ability to plug-in new tools to our
analysis pipeline as they are developed and as we become aware of them is one of the great
advantages to maintaining the workflow in the Python ecosystem. The groundwater model has
already, and will likely continue to expose data gaps, which can be prioritized in the future.
These include, developing additional monitoring well capacity and additional constraint on
mountain front recharge behavior in the Tafuna-Leone Plain area. Ultimately addressing the
issues of sustainable yield and salt-water intrusion remains as the primary goal of the
groundwater modeling component and we anticipate the tools developed here to be an
important part of laying the foundations for these efforts to improve the water resources
sustainability in American Samoa.
Acknowledgements
We would like to express our appreciation for the many individuals and agencies who made this
work possible by generously providing their time, expertise, and assistance with data collection
and field support. These people and agencies include: The American Samoa Power Authority,
especially Matt Erickson, Will Spitzenberg, and Utu Abe Malae; The American Samoa
Community College, especially Mark Schmaedick, Jameson Newtson, and Kelley
Anderson-Taggarino; the American Samoa EPA, especially Tim Bodell, the USGS, specifically Kolja
Rotzoll, Alan Mair, Scot Izuka, and Steve Westenbroek, and the University of Hawaii, especially
Aly El-Kadi, Henrietta Dulai, Craig Glenn, and Celia Smith. We would also like to thank Alex
Messina, formerly at San Diego State University. Author contributions: C.K.S and M.K.E.M
developed the collaborative research design, C.K.S performed all of the monitoring network and
water budget components and both C.K.S and M.K.E.M performed implementation of the
groundwater modeling component. C.K.S wrote the majority of the manuscript and M.K.E.M
32
the Water Resources Research Center, University of Hawaii at Manoa, Honolulu, Hawaii. SOEST publication #
Funding for this project was provided by the USGS Water Resources Research Institute
Program (WRRIP) [grant numbers 2015AS443B, 2015AS445B, & 2018AS488B] and NOAA’s
Pacific Regional Integrated Sciences and Assessments Program (Pacific RISA) [grant number
33
References
Argent, R. M., & Grayson, R. B. (2003). A modelling shell for participatory assessment and management of natural resources. Environmental Modelling & Software, 18(6), 541-551. AS-DOC - American Samoa Department of Commerce. (2009). Buildings layer for Tutuila Island. [Data file]. http://doc.as.gov/
ASPA - American Samoa Power Authority. (2013). Documentation of Wellhead Analysis, Tutuila Hydrogeological Analysis for the U.S. EPA Clean Water Act—State Revolving Fund ASPA Consolidated Grant for the benefit of the Territory of American Samoa. Report prepared for American Samoa Power Authority, Pago Pago, American Samoa. By Walters, M.O.
AWS Truepower (2014). Wind Resource Maps and Data of American Samoa: Final Report. Report prepared for the American Samoa Power Authority. https://www.asrec.net/wp-content/uploads/2016/03/Wind-Resource-Study_2014_DRAFT_2014-10-27-4378826.pdf
Bakker, M., Schaars, F., Hughes, J. D., Langevin, C. D., & Dausman, A. M. (2013).
Documentation of the seawater intrusion (SWI2) package for MODFLOW. US Geological
Survey Techniques and Methods, Book, 6.
Bakker, M., Post, V. +., Langevin, C. D., Hughes, J. D., White, J. T., Starn, J. J., & Fienen, M. N. (2016). Scripting MODFLOW model development using Python and FloPy. Groundwater, 54(5), 733-739.
Barfield, D. W. (2009). Collaborative groundwater model development. In World Environmental and Water Resources Congress 2009: Great Rivers (pp. 1-3).
Beall, A., Fiedler, F., Boll, J., & Cosens, B. (2011). Sustainable water resource management and participatory system dynamics. Case study: Developing the Palouse basin participatory model. Sustainability, 3(5), 720-742.
34
Borah, T., & Bhattacharjya, R. K. (2013). Solution of source identification problem by using GMS and MATLAB. ISH Journal of Hydraulic Engineering, 19(3), 297-304
Cummings, R. G., & McFarland, J. W. (1974). Groundwater management and salinity control. Water Resources Research, 10(5), 909-915.
Dabbish, L., Stuart, C., Tsay, J., & Herbsleb, J. (2012, February). Social coding in GitHub: transparency and collaboration in an open software repository. In Proceedings of the ACM 2012 conference on computer supported cooperative work (pp. 1277-1286). ACM.
Daly, C., J. Smith, M. Doggett, M. Halbleib, and W. Gibson. (2006). High-resolution climate maps for the Pacific basin islands, 1971–2000. Final Report. National Park Service, Pacific West Regional Office.
Engott, J. A., Johnson, A. G., Bassiouni, M., & Izuka, S. K. (2015). Spatially distributed
groundwater recharge for 2010 land cover estimated using a water-budget model for the island of O'ahu, Hawaii (No. 2015-5010). US Geological Survey.
Engott, J. A., Johnson, A. G., Bassiouni, M., Izuka, S. K., & Rotzoll, K. (2017). Spatially
distributed groundwater recharge for 2010 land cover estimated using a water-budget model for the Island of O ‘ahu, Hawai ‘i (No. 2015-5010). US Geological Survey.
Essawy, B. T., Goodall, J. L., Zell, W., Voce, D., Morsy, M. M., Sadler, J., ... & Malik, T. (2018). Integrating scientific cyberinfrastructures to improve reproducibility in computational hydrology: Example for HydroShare and GeoTrust. Environmental Modelling & Software, 105, 217-229.
Eyre, P., and G. Walker. (1991). Geology and ground-water resources of Tutuila American Samoa. Unpublished report in American Samoa Power Authority files.
35
Feo, A., Zanini, A., Petrella, E., & Celico, F. (2018). A Python script to compute isochrones for MODFLOW. Groundwater, 56(2), 343-349.
Flint, C. G., Jones, A. S., & Horsburgh, J. S. (2017). Data management dimensions of social water science: The iUTAH experience. JAWRA Journal of the American Water Resources Association, 53(5), 988-996.
Foglia, L., Borsi, I., Mehl, S., De Filippis, G., Cannata, M., Vasquez‐Suñe, E., ... & Rossetto, R. (2018). FREEWAT, a Free and Open Source, GIS‐Integrated, Hydrological Modeling
Platform. Groundwater, 56(4), 521-523.
Guo, W., & Langevin, C. D. (2002). User's guide to SEAWAT; a computer program for simulation of three-dimensional variable-density ground-water flow (No. 06-A7).
Harbaugh, A. W., Banta, E. R., Hill, M. C., & McDonald, M. G. (2000). MODFLOW-2000, The U. S. Geological Survey Modular Ground-Water Model-User Guide to Modularization Concepts and the Ground-Water Flow Process. Open-file Report. U. S. Geological Survey, (92), 134.
Herman, J., & Usher, W. (2017). SALib: an open-source Python library for sensitivity analysis.
Journal of Open Source Software, 2(9), 97. Doi. 10.21105/joss.00097
Houska, T., Kraft, P., Chamorro-Chavez, A. and Breuer, L. (2015). SPOTting Model Parameters
Using a Ready-Made Python Package, PLoS ONE, 10(12), e0145180,
doi:10.1371/journal.pone.0145180
Izuka, S.K. (1999). Summary of ground-water data for Tutuila and Aunuu, American Samoa, for October 1987 Through September 1997. U.S. Geological Survey, Pacific Islands Water Science Center, Open-File Report No. 99-252.
Izuka, S. K., Giambelluca, T. W., & Nullet, M. A. (2005). Potential Evapotranspiration on Tutuila, American Samoa. U.S. Geological Survey Scientific Investigations Report 2005-5200.
36
Izuka, S.K., J.A. Perreault, and T.K. Presley. (2007). Areas contributing recharge to wells in the Tafuna-Leone Plain, Tutuila, American Samoa. U.S. Geological Survey Scientific Investigations Report 2007-5167. [http://pubs.usgs.gov/sir/2007/5167/].
Fehr, J., Heiland, J., Himpe, C., & Saak, J. (2016). Best practices for replicability, reproducibility and reusability of computer-based experiments exemplified by model reduction software. arXiv preprint arXiv:1607.01191.
Kennedy, Jenks, and Chilton Consulting Engineers. (1987). Groundwater contamination study Tafuna-Leone Plain Tutuila Island. Final report for the Environmental Quality Commission, Office of the Governor, Tutuila, American Samoa. 168 p.
Kitanidis, P. K., & Lee, J. (2014). Principal Component Geostatistical Approach for large‐
dimensional inverse problems. Water resources research, 50(7), 5428-5443.
Kluyver, T., Ragan-Kelley, B., Pérez, F., Granger, B. E., Bussonnier, M., Frederic, J., ... & Ivanov, P. (2016, May). Jupyter Notebooks-a publishing format for reproducible computational workflows. In ELPUB (pp. 87-90).
Langevin, C.D., Thorne, D.T., Jr., Dausman, A.M., Sukop, M.C., and Guo, Weixing, (2008). SEAWAT Version 4—A computer program for simulation of multi-species solute and heat transport: U.S. Geological Survey Techniques and Methods, book 6, chap. A22, 39 p
Langsdale, S., Beall, A., Bourget, E., Hagen, E., Kudlas, S., Palmer, R., ... & Werick, W. (2013). Collaborative modeling for decision support in water resources: Principles and best practices. JAWRA Journal of the American Water Resources Association, 49(3), 629-638.
Lee, J., Yoon, H., Kitanidis, P. K., Werth, C. J., & Valocchi, A. J. (2016). Scalable subsurface inverse modeling of huge data sets with an application to tracer concentration breakthrough data from magnetic resonance imaging. Water Resources Research, 52(7), 5213-5231.
37
McDonald, M. G., Harbaugh, A. W., & original authors of MODFLOW. (2003). The history of MODFLOW. Groundwater, 41(2), 280-283.
McDougall, I. (1985). Age and evolution of the volcanoes of Tutuila, American Samoa. Pac. Sci. 39(4): 311–320.
Mendoza, G. A., & Prabhu, R. (2006). Participatory modeling and analysis for sustainable forest management: Overview of soft system dynamics models and applications. Forest Policy and Economics, 9(2), 179-196.
Meyer, R.A., Seamon, J.O., Fa’aumu, S., and Lalogafuafua, L. (2016). Classification and Mapping of Wildlife Habitats in American Samoa: An object-based approach using high
resolution orthoimagery and LIDAR remote sensing data. Report prepared for American Samoa Department of Marine and Wildlife Resources.
Moran, T. (2016). Projecting Forward: A framework for groundwater model development under the Sustainable Groundwater Management Act. Stanford Water in the West, Stanford Law School.
Nakamura, S., (1984). Soil survey of American Samoa. U.S. Department of Agriculture Soil Conservation Service, Pago Pago. 95 p.
Perez, F., & Granger, B. E. (2015). Project Jupyter: Computational narratives as the engine of collaborative data science. Retrieved September, 11(207), 108.
Perreault, J.A. (2010). Development of a water budget in a tropical setting accounting for mountain front recharge. Masters Thesis, University of Hawaii at Manoa. Honolulu, HI.
38
Shuler, C. K., El-Kadi, A.I., & Dulaiova, H. (2014, October). Hunting for High-Level Groundwater on Tutuila, American Samoa. In 2014 GSA Annual Meeting In Vancouver, British Columbia.
Shuler, C.K.; El-Kadi, A.I.; Dulai, H.; Glenn, C.R.; Fackrell, J. (2017). Source partitioning of anthropogenic groundwater nitrogen in a mixed-use landscape, Tutuila, American Samoa. Hydrogeol. J. (25), 2419–2434.
Shuler and El-Kadi, (2018a). WRRC-ASPA Hydrologic Monitoring Network Handbook. WRRC Special Report SR-2018-02, Water Resources Research Center University of Hawai‘i at Manoa, Honolulu, Hawai‘i 96822
Shuler and El-Kadi, (2018b). Groundwater Recharge for Tutuila, American Samoa Under Current and Projected Climate as Estimated with SWB2, a Soil Water Balance Model. WRRC Project Completion Report, Water Resources Research Center University of Hawai‘i at Manoa, Honolulu, Hawai‘i 96822
Shuler, C. K., Dulai, H., DeWees, R., Kirs, M., Glenn, C. R., & El‐Kadi, A. I. (2018). Isotopes, Microbes, and Turbidity: A Multi‐Tracer Approach to Understanding Recharge Dynamics and Groundwater Contamination in a Basaltic Island Aquifer. Groundwater Monitoring &
Remediation. 39(1), 20-35.
Shuler, C. K., & Mariner, K.E. (2019). cshuler/ASPA-UH_Integrated_Modeling_Framework. V1.0.2, Zenodo, doi: http://doi.org/10.5281/zenodo.3460214
Somers, J. (2018, April 5). The scientific paper is obsolete. The Atlantic. Retrieved from https://goo.gl/bJNXXy
Stack Overflow. (2018). Stack Overflow Developer Survey. [online] Available at:
39
Subramanian, V., Signell, R., Fernandes, F. P. A., & Hernandez, D. (2015, October). An end-to-end workflow for assessing sea surface temperature, salinity and water level predicted by coastal ocean models. In OCEANS 2015-MTS/IEEE Washington (pp. 1-5). IEEE.
Thornthwaite, C.W., and J.R. Mather. (1955). The water balance. Publications in Climatology (Laboratory of Climatology) 8(1): 1–86.
Tidwell, V. C., Passell, H. D., Conrad, S. H., & Thomas, R. P. (2004). System dynamics modeling for community-based water planning: Application to the Middle Rio Grande. Aquatic sciences, 66(4), 357-372.
U.S. EPA - United States Environmental Protection Agency (1987). On-Site Meteorological Program Guidance for Regulatory Modeling Applications, EPA-450/4-87-013 Office of Air Quality Planning and Standards, Research Triangle Parks, North Carolina 27711
Wang, Y. and Zhang, C. (2016). Project Final Report - 21st Century High-Resolution Climate Projections for Guam and American Samoa. Retrieved from:
https://www.sciencebase.gov/catalog/item/583331f6e4b046f05f211ae6
Westenbroek, S. M., Engott, J. A., Kelson, V. A., & Hunt, R. J. (2018). SWB Version 2.0—A Soil-Water-Balance Code for Estimating Net Infiltration and Other Water-Budget Components (No. 6-A59). US Geological Survey.
Wahl, K.L., Wahl, T.L., (1995). Determining the flow of Comal Springs at New Braunfels, Texas. In: Texas Water ’95. San Antonio, Texas, August 16–17, 1995, pp. 77–86.
White, J. T., Fienen, M. N., & Doherty, J. E. (2016). A python framework for environmental model uncertainty analysis. Environmental Modelling & Software, 85, 217-228.
Willis, R and Yeh W., (1987) Groundwater Systems Planning and Management, Prentice-Hall, Englewood Cliffs, New Jersey,
40
WMO - World Meteorological Organization (1983). Guide to Meteorological Instruments and Methods of Observation. World Meteorological Organization No. 8, 5th edition, Geneva Switzerland
Yin, D., Liu, Y., Padmanabhan, A., Terstriep, J., Rush, J., & Wang, S. (2017, July). A CyberGIS-Jupyter framework for geospatial analytics at scale. In Proceedings of the Practice and
Experience in Advanced Research Computing 2017 on Sustainability, Success and Impact (p. 18). ACM.
Young, R. A., & Bredehoeft, J. D. (1972). Digital computer simulation for solving management problems of conjunctive groundwater and surface water systems. Water Resources Research, 8(3), 533-556.
Zheng, C., & Wang, P. P. (1999). MT3DMS: a modular three-dimensional multispecies transport model for simulation of advection, dispersion, and chemical reactions of contaminants in