Design and Construction of Instrumentation System to
Study and model the Effects of Dense Fog on Radio Wave
Propagation at GSM Frequency.
Aremu O.A*P (1)
P
, Ayokunnu O.DP (2)
P
, Odepidan K.OP (3)
P
, Falade J.T P (4)
P
(1,2,3,4)
P
Department of Physics, The Polytechnic, Ibadan P.M.B 22, U.I Post office, Ibadan. Oyo State, Nigeria.
Correspondence: 31TU[email protected]U31T
Tel.: +234-803-241-3944.
Abstract
In this work, we have designed and constructed an Optical communication system (optical transmitter and receiver) capable of transmitting GSM frequencies via Laser diode at 900MHz and 1800MHz to study the effects of dense Fog on Radio wave signal. The measurement campaign took place in Ogbomoso (8°13′𝑁, 4°25′𝐸) and Iroko village, Ibadan(7°22′𝑁, 3°58′𝐸). The paper presents the experimental results on Radio wave signal propagation in dense Fog region. The measured data were statistically compared with some existing analytical and empirical Radio propagation models, namely: Kim model and Al-Naboulsi model. The comparison has been in terms of Sum of square error (SSE) and Root mean square error (RMSE). The results shows that 900MHz suffers less attenuation in dense Fog compared with 1800MHz with the attenuation mean values 97.63dB/km and 114.66dB/km respectively. The optical attenuation result is in good agreement with Kim and Al Nabousi model. The measured attenuation data has been used to propose a new model that predicts attenuation in terms of visibility and frequency.
Key words: Attenuation; Fog, Laser diode; Mean square
error; Radio wave; Visibility.
1. Introduction
The rising need of wireless broadband communication links has instigated the interest in Free Space Optical Communication technology. Since more than a decade, there is an increasing demand for high bandwidth transmission capabilities which is flexible, low costs and allow quick installation. Among other technologies, this has
attracted much attention for wireless optical point -to-point transmission which is also known as free space optics (FSO). As one consequence to this situation, many companies were founded in this time, offering free space optics equipment. Conference sessions dedicated to these topics like free-space laser communications technologies (SPIE photonics west), saw a huge extension and voices of the different manufacturers present arguments, why their special technology would perform best in typical ambient conditions. It is one deficit of the rapid development, that a major independent research network in this field is still missing, and new measurements are often related to a company’s interest.
The transmission of electromagnetic wave through the atmosphere is governed by the attenuation due to both scattering and absorption by all the atmospheric species present in the path of propagation [1]. Attenuation describes the loss of signal energy relative to free space propagation due to materials in the propagation path. Attenuation decreases the received signal power, which in turn decreases the detection range. The atmospheric path is categorized to horizontal path (constant pressure) and slant path (changed pressure) [2]. The absorption occurs by water vapour, carbon IV oxide, OR3R, NOR2R, NR2R, and OR2R, while the scattering is produced by gas molecules, dust, smoke, fog and rain [3]
The phenomenon of fog and mist is constituted of a huge quantity of small water droplets suspended in the air volume. It was admitted in Meteorology that there is fog when visibility is reduced to about 500m and the relative humidity of the air is brought to the saturation level around 98% [4]. All the optical characteristics of fog are related to the particle size distribution, which is the most important parameter
allowing us to compute the optical properties of a quantity of droplets. The size particle distribution is represented by analytical functions as modified gamma distribution for the Fog this is widely used to model the various types of fog and clouds (Mitchell, 2000).
𝑛(𝑟) = 𝑎𝑟𝛼𝑒−𝑏𝑟 (1)
In equation (1), n(r) gives the number of particles per unit volume and per increment unit of the particle radius and a,α and b are parameters which characterized the particle size distribution. Fog is the most detrimental attenuation factor among all atmospheric attenuating factors of free space optics (FSO). Fog attenuation measurement campaigns have shown that attenuation has peak values of 480dB/km under dense fog [5]. The prediction of fog attenuation can be helpful for analyzing the performance of free space optics links. The most accurate but complex calculation of attenuation for fog droplets is based on Mie scattering theory. However, it requires detailed information of fog parameters like particle size, refractive index, particle size distribution etc. this information may not be really available at a particular location of installation. The alternate way to predict specific attenuation is by using visibility data. There are models like Kruse, Kim and Al Naboulsi that predicts specific attenuation in terms of visibility.
𝜎(𝜆) =13𝑉�𝜆0𝜆�−𝑞 (2) Optical wireless communication links involve the transmission, absorption and scattering of the light due to the atmospheric conditions which under normal conditions, consists of a variety of different molecular species and small suspended particles called aerosols. This interaction produces of wide variety of optical phenomena: selective attenuation, scattering and scintillations lit [1, 6]. A selective absorption of radiations leads to the disappearing of the incident photon and an elevation of the temperature. The absorption coefficient depends on the type of gas molecules and on their concentration. Molecular absorption is a selective phenomenon which results in a spectral transmission of the atmosphere presenting transparent zones, called atmospheric transmission window and opaque zones, called blocking windows.
Aerosols scattering occurs when the particle size are of the same order of magnitude as the wavelength of
the transmitted wave. In optics, it is mainly due to mist and fog [4,7]. Attenuation is a function of frequency but also of the visibility related to the particle size distribution. This phenomenon constitutes the most restrictive factor to the deployment of wireless communication at long distance. The visibility is a concept defined for the need of meteorology as being the distance to an object at which the image contrast drops drastically to a certain percentage of the original contract of the object, equivalent to a certain transmission threshold τRTHR over the atmospheric path [8]. Two definitions for this threshold, τRTH Rexist: 2% which is used in the original equation (1) and 5%, which today is typically used at Airports to denote the runway visibility range RVR. Visibility is technically measured at the center of sensitivity for the human eye, at 550nm with a spectral band width of typically 250nm, the wavelength 550nm correspond to the maximum intensity of the solar spectrum and the visibility range sometimes also refers to as “see ability” is given by the Koschmieder law to:
𝑉 = ln (𝜏𝑇𝐻)
𝜆(550𝑛𝑚)
� (3)
The visibility measured according to this definition at meteorological stations or airports is the only parameter describing fog, available for many locations worldwide, in contract to more specific parameters such as drop size distribution or liquid water content required for Mie scattering theory. It characterizes the opacity or transparency of atmosphere estimated by a human observer [7]. It is measured by runway visual range (RVR), distance that a parallel luminous beam must travel through the atmosphere until its intensity (luminous flux) drops to about 0.05times its original value, [10]. It is measured using a Transmissometer or a diffusometer. Laser through atmosphere is mainly attenuated by absorption and scattering. Absorption by atmospheric gases, due to its quantum nature, is frequency dependent, and can be described by the so-called “atmospheric windows”. The 1550nm wavelength falls within the 1520- 1600nm window, making the absorption negligible. Particles in atmosphere also scatter incident beam of light in all directions. As the name implies, scattering only redistributes energy of the incident light rather than absorbing it. Different sizes of particles cause different types of scattering.
Based on the size of particles, scattering can be defined as follows: Rayleigh scattering occurs when particle size is much smaller than wavelength and at 1550nm wavelength; its effect is very small. Mie scattering applies to particles that have comparable size to wavelength, like water droplets in fog and haze. Non selective scattering applies to particle to sizes much greater than wavelength, such as raindrops. Mie theory may still be used to evaluate attenuation. Attenuation σ, of directed or specula light radiation in the atmosphere was predicted in Kruse formula [11] by:
𝜎(𝜆) =13𝑉�𝜆𝜆 0�
−𝑞
(4)
In equation (2), σ(λ) is the atmosphere attenuation or scattering coefficient as a function of wavelength; V is the visibility (in km); λ is the wavelength (in nm); λR0R is the visibility reference wavelength, the wavelength corresponding to the maximum intensity of the solar spectrum which is (550nm) and q is the size distribution of the scattering particles. In visible and near infrared up to about 2.5μm, equation (1) relates attenuation to visibility V (km) for a given wavelength (850 and 1550nm) for this work. For Kruse model [11]
1.6 if V > 50km
q = 1.3 if 6km <V< 50km, (5)
0.585𝑉13, if V < 6km.
Equation (3) implies that for any meteorological condition, there will be attenuation for higher wavelengths. The attenuation of 10μm is expected to be less than attenuation of shorter wavelengths. Kim rejected such wavelength dependent attenuation for low visibility in dense fog. The q variable in equation (2) for Kim model [11] is given by;
1.6 if V > 50km
1.3 if 6km < V < 50km
q= 0.16V+0.34 if 1km < V < 6km (6)
V-0.5 if 0.5km < V < 1km
0 if V < 0.5km
The Kruise equation (1) extends the problem of transmission and visibility to other wavelengths (approximately 0.5 to 2.5μm) especially in the infra-red [11].
The fog was analyzed as the destructive factor producing huge signal attenuation for considerable amount of time. The models Kruse and Kim predict fog specific attenuation using visibility. The visibility is defined as the distance as the distance where the image distinction drops to 2% of what it would be if the object were nearby instead. Image distinction drop to 5% is also considered for visibility definition. The visibility was measured at 550nm, the wavelength corresponding to the maximum intensity of the solar spectrum.
Laser diode was used because it can output higher power levels of coherent light from a smaller area, allowing for faster modulation and thus higher transport bandwidth designs. Free space laser communication has many advantages such as; no communication license is required, no cables need to be buried, no complex network of switches and amplifiers are needed, large information capacity and no agreements need to be made with landowners. Also, the availability of a coherent, monochromatic optical communication which, due to the very high frequency of the carrier (10P
14
P
Hz), would allow a very large amount of information to be transmitted.
Measurement
The specific attenuation at 900MHz and 1800MHz were measured in Ogbomoso and Iroko village on 17th day on January, 2016; 10P
th
P
February, 2016 and 13P
th
P
March, 2016. The first observation site is a town in Oyo state. The other site is located at Iroko village along Oyo-Ibadan expressway about 20km to Ibadan metropolis. Our measurement set up did consist of a locally constructed instrumentation system, optical transmitter and receiver which used a LASER beam as a carrier wave in free space. This optical communication instruments was designed for transmitting and receiving variations in signal strength. In addition, ambient temperature, relative humidity and visibility as a function of time were recorded. The experimental measurements were compared with an existing standard model and a new model is proposed.
Specification of instruments used and methodology.
Transmitting unit consists of the microphone, buffer amplifier, signal generator, signal modulator and laser driver. The receiving unit consists of Avalanche photodiode, digital to analogue converter, trans-impedance amplifier and speaker.
The transmitter sends a laser beam through the air plagued by dense Fog toward the receiver. The laser driver circuit directly modulates the intensity of semiconductor laser with the encoded digital signal. The Avalanche photo detector followed by a trans-impedance amplifier received the signal sent. The instrument calculates how much the beam is attenuated by the atmospheric phenomenon.
Fig.3(a): A snapshot of clear weather.
Fig.3(b): A snapshot of a weather plagued by Fog
Results and discussion
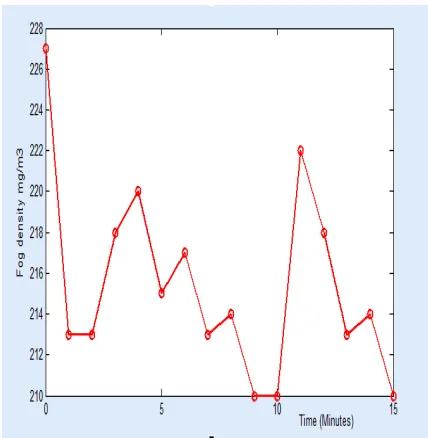
We have observed a small difference between the input analogue signal and the output signal. The difference is due to the effects of dense fog along the propagation of the signal. The signal attenuation measured at the two designated area are the same at a particular frequency. Hence, the mean signal for the two regions was determine. The measured data was plotted against the visibility, it is seen from figures 4 and 5 that low visibility data generally prevails because fog events appear and disappear steeply. GSM frequency 900MHz suffers less attenuation with mean attenuation 97.63dBmP
-1
P
while the frequency 1800MHz suffers much attenuation with mean value 114dBmP
-1
P
.
Fig. 4. Specific attenuation against visibility for
models and measured data at 900MHz
Fig. 5. Specific attenuation against visibility for models and measured data at 1800MHz.
Fig. 6. Mean signal attenuation at 900MHz and
1800MHz
Fig. 7. Graphical representation of humidity
measured against time.
Fig. 8: Graphical representation of fog density
against time.
Newly proposed model
We applied power law model 1 fitting by employing the non-linear least squares method and used the Algorithm in Trust-region with robust at off region. The model equation is given as follows for 900MHz. if 𝛼 is the specific attenuation in dB/km and v is the visibility in meters.
𝜶(𝒗) = 𝟗𝟕. 𝟖𝟏 × 𝒗−𝟎.𝟎𝟎𝟎𝟒𝟐𝟏𝟖
𝐶𝑜𝑒𝑓𝑓𝑖𝑐𝑖𝑒𝑛𝑡𝑠 (𝑤𝑖𝑡ℎ 95% 𝑐𝑜𝑛𝑓𝑖𝑑𝑒𝑛𝑐𝑒 𝑏𝑜𝑢𝑛𝑑𝑠)
The model proposed for 1800MHz frequency is as follows
𝜶(𝒗) = 𝟏𝟏𝟓 × 𝒗−𝟎.𝟎𝟎𝟎𝟔𝟔𝟗𝟑
𝐶𝑜𝑒𝑓𝑓𝑖𝑐𝑖𝑒𝑛𝑡𝑠 (𝑤𝑖𝑡ℎ 95% 𝑐𝑜𝑛𝑓𝑖𝑑𝑒𝑛𝑐𝑒 𝑏𝑜𝑢𝑛𝑑𝑠)
The goodness of fit is given by the following parameters in the table 1
Table 1: Goodness of fit parameters for field measurement.
Parameters 900MHz 1800MHz
SSE 0.0005011 0.002507
R-Square 0.9126 0.8672
Adjusted R-Square 0.9016 0.8506
RMSE 0.00794 0.0177
Fig.9. Curve fitting by the newly proposed model for attenuation measured at 900MHz
Fig.10. Curve fitting by the newly proposed model
for attenuation measured at 1800MHz
Conclusion
In this paper, we have designed and constructed an optical transmitter and receiver which were used to investigate the effects of dense Fog on Radio wave propagation at 900MHz and 1800MHz. The specific attenuation coefficients of the Laser beam through fog weather at GSM frequencies have significant effects on the radio wave signal. Our result is in good agreement with Al Naboulsi model.
It is apparent that optical signal attenuation is inversely proportional to visibility that is, when the visibility is high, the attenuation is lower. GSM frequency 900MHz suffers less attenuation with SSE 97.63dBmP
-1
P
while the frequency 1800MHz suffers much attenuation with SSE 114dBmP
-1
P
. The measured attenuation data has been used to propose a new model that predicts attenuation in terms of visibility and frequency in this region.
References
[1] Kim, I., Mc Arthur, B., Korevaar, E.(2001) “Comparison of laser beam propagation at 785 and 1625nm in Fog and Haze for opt. wireless communications”. In proc. SPIE,2001,vol.4214, p. 26-37
[2] Al Naboulsi,M., Sizun,H. and De
Fornel,E.(2004) “Fog attenuation prediction
for optical and infrared waves”. Optical
Engineering, vol. 43, no.2, p.319-329.
[3] Chimelis, V.(1982) “Extinction of COR2R
Laser radiation by Fog and Rain” applied
optics,vol. 21, no: 18.
[4] Gebhart, M., Leitgeb, E. Al Naboulsi, M.,
Sizun, H. (2004) “measurements of light
attenuation at different wavelengths in dense
Fog conditions for FSO applications. COST
270 short Term Scientific Mission7 report.
[5] Mitchell, D.L.(2000) “Parameterization of
the Mie extinction and Absorptions
coefficient of water clouds, Journal of
Atmospheric Science 57, p. 1311 – 1326.
[6] Flecker, B., Gebhart, M., Leitgeb,E., Sheikh, S., and Chlestil, C. (2006) “Results of attenuation measurements for Optical Wireless channel under dense Fog conditions regarding different wavelengths. In proc. SPIE, vol.6303.
[7] Kruse, P.W.(1962). “Element of Infrared
Technology: Generation, Transmission and
Detection”. New York: J.Willey and Sons.
[8] Leitgeb, E., Gebhart, M., Fasser, P.,
Bregenzer, J., Tanczos, J. (2003) “Impact of
atmospheric effects in free Space Optics
Transmission systems, Free Space Laser
Communication Technologies XV, Proc.
SPIE, vol. 4976-28.
[9] Monor, H., Arnon, S. (2003) “Performance
of an optical wireless system as a function of
wavelength, Applied Optics. 42(21),
4285-4294.
[10] Pan, J., Evans, M., Euler, T., Johnson, H.
(2002) “Free Space Optical
Communications: Opportunities and
challenges, a carrier’s perspectives,
Proc.SPIE, vol 4911.
[11] Bohren,C and Huffman, D. (1983)
“Absorption and scattering of light by small
particle”. John Wiley, New York.