Introducing a Framework for the Evaluation of Music Detection Tools
Paula Lopez-Otero, Laura Docio-Fernandez and Carmen Garcia-Mateo
Multimedia Technologies Group (GTM), AtlantTIC Research Centre, Universidade de Vigo EE de Telecomunicaci´on, Campus Universitario de Vigo, 36310 Vigo
{plopez,ldocio,carmen}@gts.uvigo.es
Abstract
The huge amount of multimedia information available nowadays makes its manual processing prohibitive, requiring tools for automatic labelling of these contents. This paper describes a framework for assessing a music detection tool; this framework consists of a database, composed of several hours of radio recordings that include different types of radio programmes, and a set of evaluation measures for evaluating the performance of a music detection tool in detail. A tool for automatically detecting music in audio streams, with application to music information retrieval tasks, is presented as well. The aim of this tool is to discard the audio excerpts that do not contain music in order to avoid their unnecessary processing. This tool applies fingerprinting to different acoustic features extracted from the audio signal in order to remove perceptual irrelevancies, and a support vector machine is trained for classifying these fingerprints in classes music and no-music. The validity of this tool is assessed in the proposed evaluation framework.
Keywords: music detection, fingerprinting, evaluation framework
1.
Introduction
During the last years there has been a fast growth of the available amount of multimedia (audio and audiovisual) documents. This multimedia information has to be labelled so users can automatically access the contents of their interest. These data used to be manually labelled, but the size of the documents and databases that are available nowadays makes this manual labelling prohibitive. Thus, the need for tools that automatically label and process multimedia documents has arisen. The amount of information that can be extracted from multimedia contents is huge. To cite some examples focusing in audio data one can obtain subtitles, information about the speakers (identity, age, gender, mood) or information about the background.
The recent growth of the music information retrieval (MIR) community has opened new horizons in the field of speech technologies, setting the focus not only in the speaker but also in the music, which is present in almost all kinds of multimedia documents. Thus, researchers are working in systems for identifying the song that is being played in an audio stream (Seyerlehner et al., 2007), musical genre detection for database labelling and music recommendation, radio and television monitoring for detecting contents that have copyright restrictions and thus require the payment of royalty fees, among other applications.
MIR tasks require the detection of audio excerpts where music is present, in order to avoid the unnecessary processing of speech or other sounds different than music, which are useless in this kind of tasks. Several approaches for music detection in audio contents have been developed with promising results, but there is a lack of standard datasets for this task, making it difficult to assess the actual performance of the proposed approaches. One can cite the “music-speech” corpus (Schreirer and Slaney, 1996) but, scoping the literature, experimental results show that this database is not challenging anymore. Researchers that work in music detection usually build their own datasets
for assessing their systems in two different ways: (1) short excerpts of speech and music are collected from different recordings; (2) continuous recordings of programmes are used. In this paper, a framework for assessing a music detection tool focused in MIR is described. On the one hand, a database that includes a collection of radio programmes of diverse types recorded from different stations was compiled and manually labelled. On the other hand, measures to assess the performance on the music detection task were also established.
A music detection tool is also described in this paper, and it is assessed in the proposed evaluation framework. This tool proposes the use of audio fingerprinting for music detection. The aim of the music detection task is not finding an exact match for a music excerpt, as happens in music identification, but finding out whether the excerpt looks like music or not. Thus, the ability of fingerprinting for removing perceptual irrelevancies motivates its use for this task (Haitsma and Kalker, 2002). A support vector machine (SVM) is used to train a model that classifies audio fingerprints into classes music and no-music.
The rest of the paper is organized as follows: Section 2 describes a framework for evaluating music detection tools; a fingerprint-based strategy for music detection is presented in Section 3; Section 4 shows the music detection results obtained with the proposed approach and evaluation framework; conclusions and future work can be found in Section 5.
2.
An evaluation framework for music
detection
This section describes a database developed for the music detection task and the labelling methodology, along with some metrics for assessing the performance of a music detection system.
2.1. Description of the database
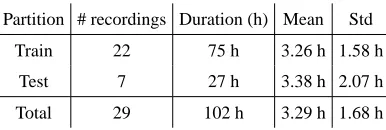
scenarios where any type of audio content may be present. In order to recreate a real situation, the database included in this framework consists of real radio programmes collected from different stations in different languages (specifically, Spanish and Galician). Different types of programmes were recorded, including variety shows, broadcast news, music programmes and cultural programmes. Specifically, 29 audio recordings have been collected. The audio present in these recordings is labelled as music and no-music, making a distinction between clean music (only music is playing) and background music (music is being played while people is speaking). The reason for doing this is because the detection of background music is a more difficult task than detecting clean music, and how a music detection tool deals with this type of information has to be carefully studied. The labelling of the audio recordings was performed by human annotators, and it has a resolution of one second. As a music detection tool requires training data for training models and/or tuning the system parameters, the database was split in a training dataset and a testing dataset. This latter dataset was used for assessing system performance. Table 1 shows the number of recordings, the whole duration, and the mean and standard deviation. The percentage of audio per class is summarized in Table 2: the percentage of non-music and music is shown, and the percentage of the two types of music information (clean or background music) is shown as well.
Partition # recordings Duration (h) Mean Std
Train 22 75 h 3.26 h 1.58 h
Test 7 27 h 3.38 h 2.07 h
Total 29 102 h 3.29 h 1.68 h
Table 1: Description of the database: duration of the partitions
Partition % no-music % music % clean music % bg music
Train 31% 69% 55% 14%
Test 30% 70% 60% 10%
Total 30% 70% 56.5% 13.5%
Table 2: Description of the database: percentage of audio per class
2.2. Evaluation metrics
There are several metrics that can be used for assessing a music detection system. A detection task can be seen as a classification task, where a set of examples has to be classified into two or more classes. In this case, the classes are music, background music and no-music, but the definition of example depends on the given framework. As mentioned in Section 1, music detection databases can be divided in two groups: those composed by excerpts that have to be classified as music or no-music, and those
composed by long recordings where the audio has to be segmented in music and no-music segments. The most suitable definition of example for the first type of database would be “audio excerpt”, while in the second type of database an example should be defined as a unit of time, smaller or bigger depending on the desired time resolution. In this framework, which can be included in the second type of databases, an example is defined as an excerpt of one second of audio. Thus, there is a label (music, background music or no-music) for each second of audio.
A description of several evaluation metrics can be found below:
• Accuracy. The accuracy of a system is defined as
Accuracy= # of correctly classified examples # of classified examples ×100
(1) This metric is good at describing the performance of a system if the number of examples of the different classes is balanced. For example, given an audio stream where 1% is music and 99% is no-music, classifying all the examples as no-music would result in an accuracy of 99%, but that does not mean that the performance of the system is almost perfect, as it is not detecting any examples of class music.
• Confusion matrix. A confusion matrix contains information about the number of examples of a class and how many of them were classified as each of the possible classes. The diagonal elements of a confusion matrix represent the number of examples of each class that were correctly classified, while the non-diagonal elements show the number of examples that were not correctly classified. This representation shows how each class is detected and, in case of errors, which class is being confused with which other class.
Four main performance measures can be extracted from a confusion matrix: (1) the true positive (TP) is the number of correctly classified instances of classci; (2) the true negative (TN) is the number of instances of classcj, j6=inot classified asci; (3) the false positive (FP) is the number of instances of class cj, j 6= i classified asci; and (4) the false negative (FN) is the number of instances of classciclassified ascj, j6=i.
Two evaluation measures for the music detection task can be obtained by combining the aforementioned performance measures that can be extracted from the confusion matrix:
– Mis-detected music (MISS): percentage of music
that has not been detected:
MISS= F N
F N+T P ×100 (2)
– False alarm music (FA): percentage of examples
of no-music that has been erroneously classified as music:
FA= F P
The three performance measures described above give enough information in order to evaluate the performance of a music detection system but, depending on the task, other performance measures might be considered. For example, when music detection is used as a previous step to a monitoring system for detecting contents with copyright restrictions, it does not matter the amount of music that is not detected as long as excerpts of all the songs being played in the recording are detected. Thus, a specific metric for this task can be defined:
Monitoring accuracy=# of detected songs
# of songs ×100 (4)
This metric requires the labelling of the different songs in the database.
3.
Fingerprint-based music detection tool
3.1. Motivation
An audio fingerprint is a condensed representation of an audio signal that keeps the relevant aspects of an audio excerpt. This condensed representation is often restricted to binary values.
Audio fingerprinting has been used in different MIR tasks for several reasons: (1) the storage requirements of fingerprints are relatively small, (2) the comparison of fingerprints is efficient due to the fact that perceptual irrelevancies have been removed, (3) searching on a fingerprints database is efficient because the searching space is smaller (Haitsma and Kalker, 2002). These reasons motivate the use of fingerprints for music detection: large databases can be represented by fingerprints, dramatically reducing the storage requirements; and the removal of perceptual irrelevancies can play a crucial role in the music detection task, as the aim is not looking for exact matches but deciding whether an example is music or not.
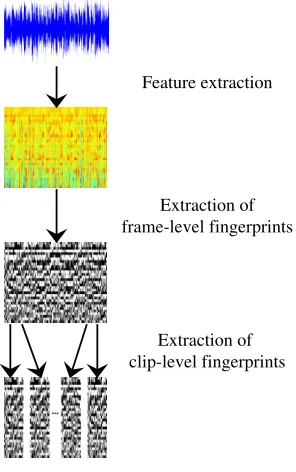
3.2. Fingerprint extraction
The fingerprints are obtained as described in Haitsma and Kalker (2002). There are three steps: first, acoustic features are extracted from the audio signal; after that, these features are turned into frame-level fingerprints by applying a convolution mask; and finally, consecutive frame-level fingerprints are grouped in order to create the clip-level fingerprint of a window of audio. This procedure is depicted in Figure 1.
3.2.1. Feature extraction
First, acoustic features are obtained from the audio signal. Different acoustic features are commonly used in the music detection task:
• Power spectral density: a fast Fourier transform (FFT) is computed for every frame, and the energy of the FFT is computed. Then, 33 non-overlapping frequency bands with logarithmic spacing ranging between 300Hz to 2000Hz are selected (Haitsma and Kalker, 2002).
• Mel-frequency cepstral coefficients (MFCCs) augmented with log-energy and first and second order derivatives (Young et al., 2006).
Figure 1: Fingerprint extraction procedure
• Chromagram: a chromagram is a sequence of 12-dimensional vectors that describe the relative energy of the 12 pitch classes of the western tonal scale (Ahonen, 2012).
The window length used for computing the different features must be carefully selected, as we need to capture the tonal components of the music in order to obtain a good characterization. The same happens with the frame rate, as the time resolution can also influence music detection results (Neves et al., 2009).
3.2.2. Frame-level fingerprints
The fingerprints corresponding to the acoustic features of each frame were obtained as described in Neves et al. (2009). A convolution mask is used to binarize the acoustic features, specifically a mask for finding negative slopes on the spectrogram in two consecutive frames is applied. Given a set of acoustic featuresS ∈ ℜI×J, where S
i,j is the feature corresponding to energy bandiand framej, the value Fi,j of the frame-level fingerprint corresponding to framejobtained after applying the convolution mask is
Fi,j=
1ifSi,j−Si,j+1+Si−1,j −Si−1,j+1>0
0ifSi,j−Si,j+1+Si−1,j −Si−1,j+1≤0
(5)
Other masks can be used instead of the one defined in Eq. 5, because depending on the size and shape of the convolution mask one can capture different characteristics of the audio features, such as spectral slopes or peaks.
3.2.3. Clip-level fingerprints
of computational load and data storage. Also, as many information retrieval approaches use fingerprints to represent the audio contents, the fingerprinting system for music detection is compatible with the next steps of the process, reducing the computational load of the whole system.
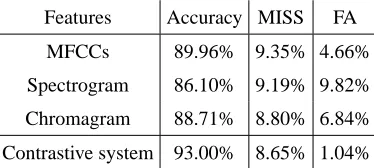
Different features were used for extracting the fingerprints, showing that the MFCCs obtained the best results in these music detection experiments. A good performance was obtained as well when using chromagrams, which allowed to represent the audio excerpts with less features than the MFCC representation. Other suitable features for fingerprinting representation will be explored in future work.
The classifier used in the fingerprinting system described in this paper was a support vector machine. Specifically, a toolkit for working with this type of classifiers was used, which handle binary data in the same way as any other numbers. In future work, the use of different classifiers will be explored, specially those that are particularly effective for working with binary data, increasing the efficiency of this music detection tool.
6.
Acknowledgements
This work has been supported by the European Regional Development Fund, the Galician Regional Government (CN2011/019, ‘Consolidation of Research Units: AtlantTIC Project’ CN2012/160) and the Spanish Government (FPI grant BES-2010-033358 and ‘SpeechTech4All Project’ TEC2012-38939-C03-01).
7.
References
T. Ahonen. 2012. Compression-based clustering of chromagram data: New method and representations. In Proceedings of the 9th International Symposium
on Computer Music Modeling and Retrieval, pages
474–481.
C.-C. Chang and C.-J. Lin. 2011. LIBSVM: A library for support vector machines. ACM Transactions
on Intelligent Systems and Technology, 2:27:1–27:27.
Software available at http://www.csie.ntu.
edu.tw/˜cjlin/libsvm.
J. Haitsma and T. Kalker. 2002. A highly robust audio fingerprinting system. In Proceedings of the
Third International Conference on Music Information Retrieval, pages 107–115.
C. Neves, A. Veiga, L. S´a, and F. Perdig˜ao. 2009. Audio fingerprinting system for broadcast streams. In
Proceedings of Conference on Telecommunications -ConfTele, volume 1, pages 481–484, Santa Maria da
Feira, Portugal.
D. Reynolds and R. Rose. 1995. Robust text-independent speaker identification using gaussian mixture speaker models. IEEE Transactions on Speech and Audio Processing, 3(1):72–83.
E. Schreirer and M. Slaney. 1996. The music-speech corpus. http://labrosa.ee.columbia.edu/ sounds/musp/scheislan.html.
K. Seyerlehner, G. Widmer, T. Pohle, and M. Sched. 2007. Automatic music detection in television productions. In
in. Proceedings of the 10th conference on digital audio effects.