Numerical and theoretical studies of bolted joints under harmonic shear displacement Jianhua Liu a, Huajiang Ouyang a, b, Lijun. Ma c, Chaoqian Zhang c, Minhao Zhu a,* a Tribology Research Institute, Traction Power State Key Laboratory, Southwest Jiaotong University, Chengdu 610031, China
b Department of Engineering,University of Liverpool, Liverpool L69 3GH, UK c
Qingdao Sifang Locomotive and Rolling Stock Co. Qingdao 266111
,ChinaAbstract
A three-dimensional finite element model used to simulate the bolted joint is created using ABAQUS package. The stress concentration factors at the roots of the thread are first studied with a preload of 38.4 kN. Under harmonic transverse shear displacement, not only the stress variations at ten specified points of the first thread but also contact conditions between the contacting surfaces are studied. By changing the preload value, relative displacement, the coefficient of friction between the two clamped plates successively and the loading frequency, their effects on the hysteresis loops of the transverse load versus the relative displacement of the joint are then analyzed. Finally the hysteresis loops are produced by the Masing model. It is found that due to the greatest stress concentration factor, fatigue failure will occur at the root of the first thread. With the increase of preload value, the amplitude of displacement and the coefficient of friction, frictional energy dissipation of the joint increases. Very good agreement is achieved between the hysteresis loops produced from the fourth-order Masing model and the detailed ABAQUS model and therefore the fourth-order Masing model can replace the time-consuming finite element model.
Keywords: Bolted joint; Transverse shear displacement; Finite element; Stress concentration factor; Hysteresis loop; Contact condition; Masing model
1 Introduction
Bolted joints have found wide spread use in many machines and structures. As basic fastening pieces, they have direct influences on the safety and reliability of the structural system. But in practice, delayed brittle fracture without obvious signs occurs at the first root of the thread and the
*Corresponding author. Tel.: +86 028 87600715; fax: +86 028 87600715.
transition from the bolt head to the shank of the bolt. This leads to serious consequences. Ibrahim et al. reviewed problems pertaining to structural dynamics with bolted joints. It was found that the axial-load distribution was so unequal that the serious stress concentration existed at the first thread which carried more than 30% of the total load and the first three threads carried about 70% of the total load . Zhao studied the stress concentration factors (SCF) at the roots of the thread by using the Virtual Contact Loading (VCL) method and finite element method (FEM). Fukuoka et al. and Yang et al. used finite element method to obtain the stress distribution in a bolt. The threads were taken as cantilever beams, and then the axial load distribution was obtained using theory of elasticity . Based on multi-stripe polarizer and recording micro-densitometer, Kenny et al. and Fessler et al. used the photoelastic stress-frozen technique to study the stress distributions both at the roots of the thread and on the screw flanks.
al. developed modified Iwan beam elements to simulate dynamics of beam structures with bolted joints. Oldfield et al. and Ouyang et al. used the finite element method and the experimental method to study the dynamic behavior of a bolted joint under harmonic loading. In addition, the hysteresis loops of the torque versus the relative angular displacement of the joint were produced by the Masing model and the Bouc-Wen model in their studies.
When studying dynamic characteristics of bolted joints, the stress distribution is always investigated to check whether bolts have sufficient strength. This is because once a bolt fails, the bolted joint fails and there is no need to study its dynamic characteristics. In this paper, a three-dimensional finite element model is created to simulate a bolted joint under harmonic shear displacement. In order to verify the reliability of the finite element model, the axial load distribution of the bolted joint under a preload of 38.4 kN is also studied by using an analytical method. The stress concentration factors at the roots of the thread and stress variations at ten specified points are studied. The contact condition between contacting surfaces are analyzed. The effects of the preload, the amplitude of displacement, the coefficient of friction between the two clamped plates, the loading frequency and the loading path on the dynamic response of bolted joints are investigated by means of a parametric study. In addition, the evolution of the shape of the hysteresis loop is studied. The response curve is reproduced by using the Masing model and is found to be in good agreement with that from the detailed FE model.
2 Description of finite element model
The threads are created precisely according to the ISO standard for M12×1.75 metric screw
threads. The helix angle was so small that its influence on the axial load and stress distribution
within bolted joints could be ignored . Accounting for the symmetrical characteristics of both
model and boundary condition, only one half of the structure is modeled (see Fig. 1(a)). The bolt
hole diameter of the two clamped plates is 13 mm and there is an initial gap between the bolt shaft
and the side wall of the plates. Seven threads are created for the bolt and six threads are used in
the model for the nut. Because the first three threads carry about 70% of the total load, the mesh in
this area is the finest (see Fig. 1(b)). There are a total of 149324 nodes and 129896 eight-node
considered for all materials involved in the bolted structure, For all materials, the modulus of
elasticity, E, is 210 GPa and Poisson’s ratio, , is 0.3. The damping of the material is not
considered in this analysis.
(a) Complete model (b) Enlarged view of the thread
Fig.1 Finite element model
In ABAQUS/Standard, contacting surfaces are first created, then contact pairs are defined, and
last the mechanical model is created to control the behavior of contacting surfaces. In the finite
element model, four contact pairs are defined: the contact between Plate 1 and the head of the bolt
(Contact I), the contact between the two clamped plates (Contact II), the contact between Plate 2
and the nut (Contact III), the contact between the threads (Contact IV). The finite sliding
formulation is used for Contact I and Contact II. However, considering the small-scale relative
motion of the contacting bodies for Contact III and Contact IV, the infinitesimal sliding
formulation is used to improve the efficiency of the analysis. The initial value of the friction
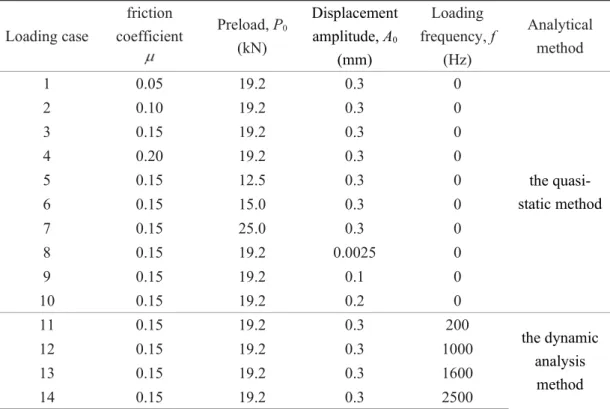
coefficient, , is 0.15. The FE simulations conducted are listed in Table 1.
A reference point named RP-1 is created at the center of Side I of Plate 1 (see Fig. 1(a)). Side I
is constrained with RP-1 by using coupling constraint. Coupling constraint is to make one or more
degrees of freedom of two bodies have the same value. In this model, it is only used in the x
direction. Both Side II and its opposite side of Plate 2 are fixed. To avoid singularity in the
numerical analysis when slip occurs between the two clamped plates, the first step is to fix Side I
and apply a small preload on the section that is the transition from the bolt head to the shank of the
bolt. The next step is used to release Plate 1. According to the standard for bolt preload, an initial
value of 19.2 kN is used in the third step. The first three steps are to create contact steadily and
created to simulate harmonic shear loading: loading in the negative direction to its maximum from
zero (namely, from x = 0 to the left in Fig. 1), unload to zero, loading in the positive direction to
its maximum, unload to zero; and loading in the negative direction to its maximum from zero.
Table 1 Finite element simulations
Loading case
friction
coefficient Preload, P0 (kN)
Displacement amplitude, A0
(mm)
Loading frequency, f
(Hz)
Analytical method
1 0.05 19.2 0.3 0
the quasi-static method
2 0.10 19.2 0.3 0
3 0.15 19.2 0.3 0
4 0.20 19.2 0.3 0
5 0.15 12.5 0.3 0
6 0.15 15.0 0.3 0
7 0.15 25.0 0.3 0
8 0.15 19.2 0.0025 0
9 0.15 19.2 0.1 0
10 0.15 19.2 0.2 0
11 0.15 19.2 0.3 200
the dynamic analysis
method
12 0.15 19.2 0.3 1000
13 0.15 19.2 0.3 1600
14 0.15 19.2 0.3 2500
After velocity reversal, the shear force at Contact II changes first quickly, and then slowly.
Therefore, the initial increment size for the fifth step and the seventh step is taken to be 0.02 and
that for other steps is 0.1 in the quasi-static method. The initial increment size and the maximum
of increment size for all steps in the dynamic analysis are one percent of the cycle . There is a reason why the simulation needs to be conducted under displacement control rather than load
control. It is difficult to calculate the value of threshold shear force resulting in macro slip
between contacting surfaces. It is therefore difficult to select a load value to simulate dynamic
characteristics of the bolt. If the applied load is less than the threshold shear force, micro slip
occurs between contacting surfaces, but there is no macro slip. Therefore, it cannot appropriately
simulate the dynamic characteristics. Conversely, if the applied load is greater than the threshold
shear force, there is macro slip. When macro slip occurs between all contact surfaces, the shear
load remains constant and it will not increase with the increase of displacement. So the shear force
cannot achieve the pre-set value of applied load unless the bolt gets into contact with the side wall
and computation stops.
3 Finite element results and discussion
3.1 Axial load distribution of thread
To verify the finite element model (FEM), numerical results are compared with analytical
results available in the published literature. The axial load distribution of the bolted joint was
investigated by Yamamoto . It can be expressed by the elastic deformation coefficients k of the bolt (index b) and nut (index n). The axial load at any section perpendicular to the axis of the bolt or nut is given by
(1)
where P0 is the bolt preload, L is the thread engagement length, y is the distance from the nut
bearing surface, Fy is the axial load at the section with a distance of y away from the nut bearing
surface, and is a constant defined as
(2)
Here, Ab and An are the equivalent cross-sectional areas of bolt and nut, Eb and En are the Young
modulus of bolt and nut, and is the helix angle of threads.
Hence, the axial load of ith pitch numbered from nut bearing surface is expressed by
(3)
Here, P is the thread pitch. is defined as the ratio of to , then
(4)
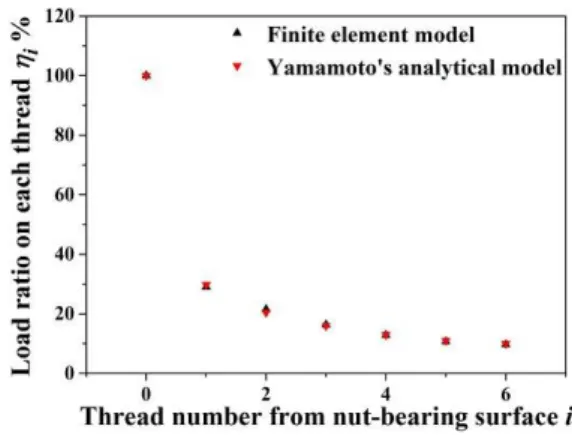
Fig.2 gives the axial-load distributions from the analytical method and the finite element
method. The finite element results show good agreement with Yamamoto’s analytical results. It is
about 2/3 of the total load.
Fig.2 Comparison of axial-load distributions from the analytical method and the FEM
3.2 Stress analysis of the bolt
Figure 3 shows the stress distribution of the bolt under a preload of 19.2 kN. The equivalent von Mises stresses at the first three roots of the thread are found to be far beyond those at other roots of the thread of the bolt. Under harmonic shear displacement, serious damage will occur by fretting wear of the contacting surfaces of the first three threads. The maximum stress value is 1091 MPa and it occurs at the first root of the thread. It is much larger than the yield stress of carbon steel.
Fig.3 Stress distribution on the threads
because the last thread is a free end, not bearing bolt pretension. The stress at the first root of the thread exceeds the yield stress of bolt material. Even if the stress does not exceed the yield limit, under harmonic loading, it is still prone to fatigue fracture.
Fig.4 The SCF distribution along the roots of the thread
In order to study the variation of the equivalent von Mises stress with time, one half of the first thread of the bolt shown in Fig.5 in to be studied in detail. Two paths, denoted by a and b, are defined in the figure. Path a is the bottom of the root of the first thread, and Path b is the edge of the contact zone for the root of the first thread. At the same time, five planes are created perpendicular to the circumferential direction of the bolt, and the angle between every two adjoining planes is 45 degrees. Consequently, there are ten intersection points (one on path a and one on path b on each plane), denoted by a1,a2, ,… a5 and b1,b2, ,… b5. The direction of
the harmonic displacement is parallel to the x-axis.
Fig.5 Definition of the two paths on the first thread
returns from the maximum (0.3 mm) or minimum (‒0.3 mm) to zero (step 5 or step 7), the stresses are not in uniform distribution. This illustrates that hysteresis phenomena maybe occur under harmonic shear displacement. When the transverse displacement reaches its maximum (step 4), the von Mises stress at Node a1 is increased least, while that at Node a5 is reduced least.
Conversely, when the transverse displacement reaches its minimum (step 6), the von Mises stress at Node a1 is reduced slightest and that at Node a5 is increased slightest. The variations of the von
Mises stress at the five nodes during the application of the harmonic shear displacement are shown in Figure 6 b). The stress amplitudes of Nodes a1 and a5 are almost identical with a value of 1600
MPa and larger than those of the other three nodes. Therefore, fatigue fracture would happen at Node a1 or Node a5. When the transverse displacement reaches ‒0.30mm from ‒0.18 mm, the von
Mises stresses at the five nodes remain constant, which indicated the shear load is equal to the friction force and that the bolt is in balance. Figure 7 shows the stress distributions along Path b and the variations of the stress at the five nodes during the first one and 1/4 loading cycles. Compared with figure 6, similar conclusions can be obtained. The stress amplitudes of Nodes b1
and b5 are larger than those of other three nodes, but smaller than those of Nodes a1 and a5.
Accordingly, under harmonic displacement, fatigue fracture is most likely to happen at the bottom of the first thread.
a) Variations of von Mises Stress b) Variations of von Mises Stress distribution with loading along path a of five nodes with loading cycles
3.3 Contact state analysis
Mindlin reported that there were stick and slip regions when micro slip occurred between contacting surfaces. The elastic deformations of two balls compressed towards each other in the presence of a tangential force and a torsional couple were first described in his work. In order to analyze the stick-slip conditions for Contact I and Contact II, function f, the ratio of the friction stress to the shear stress, is defined by
(5)
where is the friction coefficient between contacting surfaces, is the normal stress and is
the shear stress on the contact surface.
a) Variations of von Mises Stress b) Variations of von Mises Stress distribution with loading along path b of five nodes with loading cycles
Fig.7 Von Mises Stress of the edge of the contact area of the first root of the thread When f is larger than 1, this node experiences sticking. When f is equal to 1, this node undergoes slipping. Theoretically, it is impossible for f to become smaller than 1. Figure 8 shows the variations of the maximum and minimum of f (max(f) and min(f)) for Contact I and Contact II during the loading process. When the transverse displacement returns from its maximum to zero
(step 7), max(f) is greater than 1 and min(f) is equal to 1, which indicated that Contact I is in the
partial slip condition. When the transverse displacement is reducing from ‒0.18 mm to ‒0.30 mm,
max(f) and min(f) are equal to 1. It is clear that Contact I is under the gross slip condition, the bolt
is in balance and the shear load remains constant (Fig.8 a)). Similarly, when the transverse
Contact II is under the gross slip condition. After velocity reversal, Contact II gets into the partial slip state. When the transverse displacement is reducing from 0.30 mm to 0.279 mm, max(f) and min(f) are equal to 1, which indicated that Contact II is under the gross slip condition (Fig. 8 b)).
a) Contact I b) Contact II
Fig.8 Variations of the maximum and minimum of the ratio of the friction stress to the shear stress with loading history
3.4 The hysteresis loop
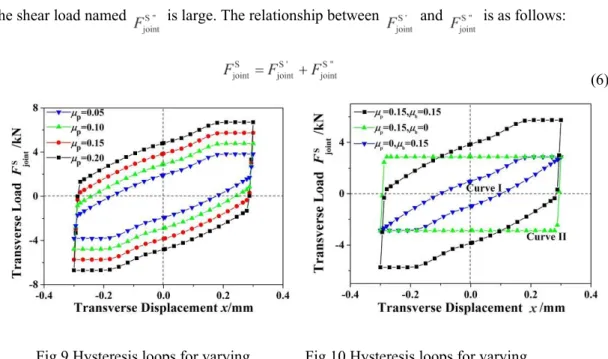
A bolted joint displays a hysteresis loop for the transverse load versus the relative displacement of the joint when subjected to harmonic shear displacement. Figure 9 shows the hysteresis loops for different friction coefficients between the two clamped plates. The energy dissipation and the maximum of the shear load increase with the increase of friction coefficient. When the relative transverse displacement between the clamped plates is zero, the shear load is not zero. To explain
this hysteresis phenomenon, the effects of friction coefficient for Contact I and Contact II ( and
) on the hysteretic curves are analysed (Figure 10). Curve I is the hysteresis loop of the joint
under the condition of neglecting the friction coefficient between the two clamped plates. If the
absolute value of is greater than or equal to 0.48 mm, Contact I is in the gross slip
condition. Curve II is the hysteresis loop of the joint under the condition of neglecting the friction
coefficient between Plate 1 and the head of the bolt. Similarly, if the absolute value of is
greater than or equal to 0.021mm, Contact II is in the gross slip condition, and the shear load (
) is a constant. If not, Contact II is in the partial slip condition. At the moment of velocity
reversal, the contact states for Contact I and Contact II transform from the gross slip condition to
the partial slip condition. Contact II goes into the gross slip condition before Contact I. After the
displacement reversal, the rate of change of the shear load denoted by is small, but that of
the shear load named is large. The relationship between and is as follows:
(6)
Fig.9 Hysteresis loops for varying Fig.10 Hysteresis loops for varying Coefficient of friction between the plates Coefficients of friction and
(P0=19.2kN, =0.15) (P0=19.2kN)
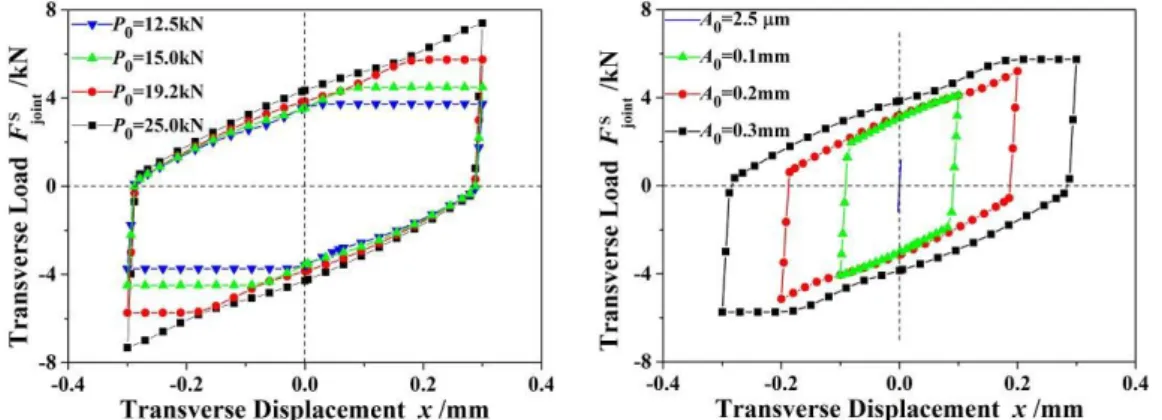
Figure 11 shows the hysteresis loops for different bolt preloads. When a preload of 12.5 kN is
used, the friction forces between contacting surfaces are small. If mm, Contact I and
Contact II are under the gross slip condition, and the shear load remains constant. With the
also increases. At the same time, the energy dissipation increases. When the preload reaches 25 kN, under harmonic shear displacement, Contact I stays in the partial slip condition. The shape of the hysteresis loop transforms from a parallel hexagon to a parallelogram.
Figure 12 shows the hysteresis loops for different amplitudes of the harmonic shear displacement applied to the bolt. When the displacement amplitude is 2.5 , Contact I and
Contact II stays in the partial slip condition and the hysteresis loop appears linear. With the
displacement amplitude increases, the gross slipping condition begins to occur between the two clamped plates (Contact II) and the hysteresis loop appears like a parallelogram. The energy
dissipation increases at the same time. When the displacement amplitude is 0.3mm, if
mm, then Contact I is under the gross slip condition. The hysteresis loop appears as
a parallel hexagon and the energy dissipation is further increased.
Fig.11 Hysteresis loops for various Fig.12 Hysteresis loops for various bolt preloads( = =0.15) amplitudes of applied displacement
(P0=19.2kN, = =0.15)
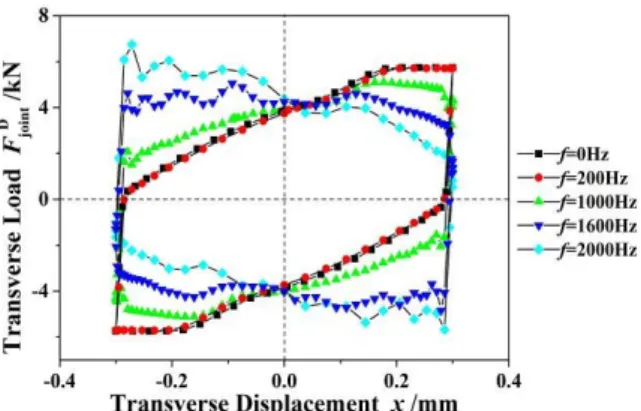
the harmonic shear displacement applied to the joint. When the frequency is 200 Hz, the maximum value of the inertial force is 0.037 kN. The shear load is mainly affected by the friction force and the hysteresis loop coincides with that calculated with the quasi-static method. The effect of the inertial force on the hysteresis loop increases with the increase of frequency.
Fig.13 Hysteresis loops for various frequencies of applied displacement (P0=19.2kN, = =0.15)
Figure 14 shows the hysteresis loops for different loading paths. At low frequency, the hysteresis loop for triangular wave loading shows good agreement with that for sinusoid wave loading; while at high frequency, the hysteresis loops for the previously mentioned loading paths are different. Consequently, at low frequency, the effect of loading path on the hysteresis loop is small; while at high frequency, the effect is remarkable.
Fig.14 Hysteresis loops for different loading paths (P0=19.2kN, = =0.15)
simplified model of the bolted joint should be very useful.
4 Masing Model
A Jenkins element is a spring and a Coulomb element connected in series. With a single Jenkins
element the joint only has two physical states, sticking and total slipping. Therefore, a single
Jenkins element cannot appropriately simulate the state of motion of bolted joints. In order to
simulate micro-slip, Gaul and co-workers made good use of Masing model to simulate a joint.
Masing model was further developed to describe the elasto-plastic behavior of metals . When
some of Jenkins elements are sticking and others are slipping, the model is in the partial slip
condition. While all the Jenkins elements are slipping, the model is in the gross slipping condition
(Fig. 15).
The total joint force is given by (adapted from Ref. )
(7)
The formulation represents a non-smooth function, so the dynamic model is nonlinear, where
(8) and ki(i=0,1,2,…,n) is the spring constant, Ci (i=1,2,3,…,n) is the threshold force of Coulomb
element ‘i’, x is the displacement of a Jenkins element, xrev is the displacement immediately prior
to velocity reversal. The dot over the dependent variable represents the derivative with respect to
time. Function is defined as
Fig.15 Masing Model
The parameters k0, ki, and Ci in the Masing model are used to fit the hysteresis curve. If
selecting an nth order model, 2n+1 equations are needed to solve these parameters. Using Masing model, Oldfield et al. and Ouyang et al. obtained the hysteresis loops of the torque versus the relative angular displacement of a bolt joint. In addition, the method for determining parameters k0, ki, and Ci was discussed in their investigation.
The solution procedure is as follows:
1. A hysteresis loop is firstly generated by the detailed finite element model. The loop, from one point of velocity reversal to another, is broken down into n+1 sections of apparently straight lines. At the point of the velocity reversal at the bottom of the loop, it is considered that no Jenkins element has reached its threshold force. Namely, all of the Jenkins elements are in sticking state. At each subsequent section, the contact state for a single Jenkins element transforms from sticking state to slipping state. At the last section, all of the Jenkins elements are in slipping state. Consequently, the following equations are obtained from Eq. (7) as
(10)
(11)
where fn is the functional expression of the nth (n=1, 2…) segment of the loop and grad fn is the
gradient of that segment.
3. Substituting the known spring constant into equations (10), the resistance and threshold forces of Coulomb elements are found.
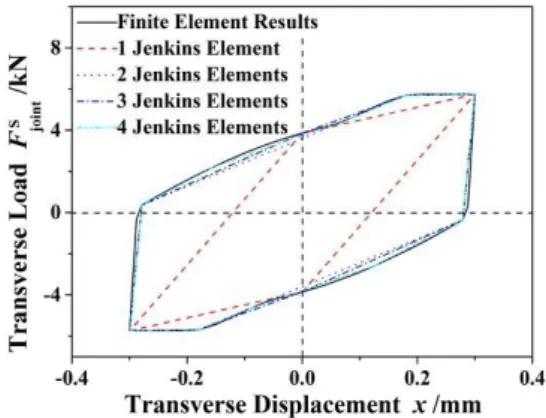
Figure 16 shows the hysteresis loops generated in the Masing model. One Jenkins element only provides a very coarse representation. However, selecting a fourth order model, the hysteresis loop almost overlaps with that predicted by the finite element method. Therefore, the response curve can be reproduced by using the fourth order Masing model.
Fig.16 Hysteresis loops generated using Jenkins Elements
5. Conclusions
The dynamic behavior of a bolted joint subjected to harmonic shear displacement is studied in this paper. The following conclusions can be made from the numerical results.
1. Under the bolt preload, the equivalent von Mises stress and the stress concentration factor at the first root of the thread are found to be largest, andthere is a risk of fatigue fracture.
state. Compared with the contact between the top plate and the head of the bolt, gross slipping between the two clamped plates will take place earlier. The shear load remains constant after the two contact pairs undergo gross slipping.
3. The threshold force leading to slip between the two clamped plates and the energy dissipation increase with the increase of friction coefficient between the clamped plates. Similarly, they become larger when preload increases. When preload reaches a certain value, the contact between the top plate and the head of the bolt is always in the partial slip state, and the shape of the hysteresis loop transforms from a parallel hexagon to a parallelogram. When shear displacement amplitude is so small that the two contact pairsdescribed earlier are always in the partial slip state, the hysteresis loop appears as a straight line. With increasing displacement amplitude, gross slipping firstly begins to occur between the two clamped plates, and then between the top plate and the head of the bolt. The hysteresis loop appears as a parallelogram, and then a parallel hexagon. Under low frequency, the effects of frequency and loading path are small, while under high frequency, they are remarkable.
4. The hysteresis loops of the bolted joint can be well reproduced by using a fourth order Masing model.
Acknowledgement
The authors gratefully acknowledge the financial support provided by China National Funds for Distinguished Young Scientists (No.51025519), and the Changjiang Scholarship and Innovation Team Development Plan (No.IRT1178).
Nomenclature
= transverse load calculated with quasi-static method and dynamic analysis method
f = frequency of the harmonic shear displacement
k0 = permanent spring constant
, = displacement and velocity of Jenkins element
= displacement immediately prior to velocity reversal
Ci = threshold force of Coulomb element ‘i’
y = distance from the nut bearing surface
Fy = axial load at the section with a distance of y away from the nut bearing surface
P0 = initial clamping force or preload
L = thread engagement length
Ab, An = equivalent cross-sectional areas of bolt and nut
Eb, En = Young modulus of bolt and nut
= helix angle of threads
p(i) = axial load of nth pitch numbered from nut bearing surface
P = thread pitch
= displacement of the moving plate
= normal pressure on the contact surface
= shear stress on the contact surface
= friction coefficient between the two clamped plates
= friction coefficient between the moving plate and the head of the bolt
References
1. Ibrahim RA and Pettit CL. Uncertainties and dynamic problems of bolted joints and othera fasteners. Journal of Sound and Vibration, 2005. 279(3-5): p. 857-936.
137-141.
3. Jiang H. Analysis of bolt failure and fatigue life of reciprocating compressor. Petrochem Ical Safety Technology, 2006. 22(6): p. 22-24.
4. Zhao H. Analysis of the load distribution in a bolt-nut connector. Computers & Structures, 1994. 53(6): p. 1465-1472.
5. Zhao H. Stress concentration factors within bolt–nut connectors under elasto-plastic deformation. International Journal of Fatigue, 1998. 20(9): p. 651-659.
6. Fukuoka T, Nomura M. Proposition of helical thread modeling with accurate geometry and finite element analysis. Journal of Pressure Vessel Technology, 2008. 130(1): p. 011204.
7. Yang G, Hong J, Zhu L, Li B, Xiong M, Wang F. Three-dimensional finite element analysis of the mechanical properties of helical thread connection. Chinese Journal of Mechanical Engineering,
2013. 26(3): p. 564-572.
8. Sopwith DG. The distribution of load in screw thread. Inst. Mech. Engrs. App1. Mech. Proc., 1948. 159: p. 373-383.
9. Yamamoto A. The theory and computation of threads connection. Tokoy: Yokendo, 1980.
10. Kenny B, Patterson EA. Load and stress distribution in screw threads. Experimental Mechanics, 1985. 25(3): p. 208-213.
11. Fessler H, Jobson PK. Stress in a bottoming stud assembly with chamfers at the ends of the threads. J. Strain Anal, 1983. 18: p. 15-22.
12. Beards CF. Damping in structural joints. The Shock and Vibration Digest, 1992. 24: p. 3-7.
13. Ungar EE. The status of engineering knowledge concerning the damping of built-up structures. Journal of Sound and Vibration, 1973. 26: p. 141-154.
14. Brown CB. Factors affecting the damping in a lap joint. American Society of Civil Engineers, Journal of Structures Division, 1968. 96: p. 1197-1217.
15. Nelson FC, Sullivan DF. Damping in joints of built-up structures. Environmental Technology 76, 22nd Annual Meeting, Institute of Environmental Science, 1976.
16. Hanks BR, Stephens DG. Mechanisms and scaling of damping in a practical structural joint. Shock and Vibration Bulletin, 1967. 36: p. 1-8.
17. Shin YS, Iverson JC, Kim KS. Experimental studies on damping characteristics of bolted joints for plates and shells. American Society of Mechanical Engineers, Journal of Pressure Vessel
18. Song S, Park C, Moran KP, Lee S. Contact area of bolted joint interface: analytical, finite element modeling and experimental study. ASME Winter Annual Meeting EEP, 1992. 3: p. 73-81.
19.Iwan WD. A distributed-element model for hysteresis and its steady-state dynamic response. Journal of Applied Mechanics, 1966. 33(4): p. 893-900.
20. Gual L, Nitsche R. The role of friction in mechanical joints. Applied Mechanics Review, 2001. 54: p. 93-106.
21.Ahmadian H, Jalali H. Generic element formulation for modelling bolted lap joints. Mechanical Systems and Signal Processing, 2007. 21(5): p. 2318-2334.
22.Jaumouillé V, Sinou JJ, Petitjean B. An adaptive harmonic balance method for predicting the nonlinear dynamic responses of mechanical systems—Application to bolted structures. Journal of Sound and Vibration, 2010. 329(19): p. 4048-4067.
23.Qin Z, Han Q, Chu F. Analytical model of bolted disk-drum joints and its application to dynamic analysis of jointed rotor. Proceedings of the Institution of Mechanical Engineers, Part
C: Journal of Mechanical. Engineering Science, doi: 10.1177/0954406213489084.
24.Luan Y, Guan ZQ, Liu S. A simplified nonlinear dynamic model for the analysis of pipe structures with bolted flange joints. Journal of Sound and Vibration, 2012. 331(2): p. 325-344.
25.Quinn DD. Modal analysis of jointed structures. Journal of Sound and Vibration, 2012. 331(1): p. 81-93.
26.Song Y, Hartwigsen DP, Mcfarland DM, Vakakis AF, Bergman LA. Simulation of dynamics of beam structures with bolted joints using adjusted Iwan beam elements. Journal of Sound and Vibration, 2004. 273: p. 249-276.
27.Oldfield MJ, Ouyang H, Mottershead JE. Simplified models of bolted joints under harmonic loading. Computers and Structures, 2005. 84(1-2): p. 25-33.
28.Ouyang H, Oldfield MJ, and Mottershead JE. Experimental and theoretical studies of a bolted joint excited by a torsional dynamic load. International Journal of Mechanical Sciences, 2006. 48(12): p.
1447-1455.
29.Yamamoto A. Theory and calculation of threaded fastener. Yokendo Ltd, Tokyo, 1970: p. 43. 30.Mindlin RD. Compliance of elastic bodies in contact. Journal of Applied Mechanics, 1949.
259-268.
Spannungen. Wissenschaftliche Veroffentlichungen aus dem Siemens-Konzern, 1923. 3: p.