Electro-elastic coupling modelling from multiple
wavelengths imaging microscopy
C. Flammier1,a,Y. Fedala2,3, F. Kanoufi3 , G. Tessier2, J.P. Roger2, F. Amiot1
1Insitut FEMTO-ST, CNRS-UMR 6174 / UFC / ENSMM / UTBM, 24 chemin de l’Epitaphe,
F-25030 Besançon, France
2Institut Langevin / ESPCI ParisTech / CNRS UMR 7587, Laboratoire d’Optique Physique, 10 rue
Vauquelin, F-75231 Paris Cedex 05, France
3PECSA, CNRS-UMR 7195 / ESPCI ParisTech, 10 rue Vauquelin, F-75231 Paris Cedex 05, France
Abstract. Due to their ability to interact with their environment, the interest in micro-cantilever sensors in biological or chemical applications is increasing. Moreover measurement of the sensor bending induced by molecular adsorption is improved by electrochemical actuation of the cantilever. This is why modelling the electro-elastic coupling is a key issue. Different methods are used to measure the bending induced by this electrochemical actuation. Among them, multiple wavelengths imaging microscopy provides full-field measurements. The local surface electrical charge density and the deformation field are obtained by decoupling wavelength-dependent and –independent contributions to the collected intensity. Based on a modelling of the electro-elastic coupling and on these full-field measurements, an identification method of the coupling parameters of the system is proposed herein.
1 Introduction
Molecule recognition in biology is widely performed with fluorescent or radioactive tags due to the low detection level they provide [1]. However their preparation and the interest molecules modification require costly and time consuming procedures [2]. An alternative way is to use micro-cantilever sensors. Indeed, objects miniaturization highly increases their surface over volume ratio and thus their ability to interact with their environment, therefore they present advantages for molecule detection. In fact, two detection modes are used, the dynamic and the static modes [3]. In dynamic mode operation, the resonance frequency of the micro-cantilever is monitored and allows for mass variation detection induced by molecular adsorption [4-5]. Nevertheless, dynamic measurements are not suited for operations in aqueous solution due to increased damping [3]. An alternative solution is proposed by [6].
Adsorption and environmental modifications also induce quasi-static bending of the micro cantilever. The optical lever technique allows to read the out of plane displacement at the cantilever tip. This is used to detect DNA molecules by hybridization [7]. However the displacement induced by adsorption is very low and difficult to measure.
a
e-mail : [email protected]
Using the micro-cantilever as a sensor and as an electrode in electrochemical environment provides an additional mechanism to probe the surface chemical composition. Furthermore its surface is under control of the electrode potential [8]. A lot of previous studies focus on redox reactions between electrolyte and solid electrode [9], but [10-11] report ways to identify adsorbed molecules without involvement of electrochemical reactions. However the exact mechanisms underlying the electro-elastic coupling when a molecule is adsorbed are described qualitatively and not quantitatively [10, 12]. Multiple wavelengths imaging microscopy provide both the local surface electrical charge density and the deformation field by decoupling wavelength-dependent and – independent (ie kinematic) contributions to the collected intensity [13].
The electro-elastic coupling model chosen herein describes the chemical part of the system free energy by a thin virtual layer ascribed to deform with the cantilever [14]. Equilibrium and kinematic compatibility conditions at the interface allow us to write equations driving the mechanical behaviour of the system. Enforcing the measured fields to satisfy these equations provides a linear system whose unknowns are the mechanical parameters describing the electro-elastic coupling.
The inverse problem is solved here by identifying equivalent mechanical parameters induced by the molecule adsorption onto the micro-cantilever and the stress field applied on its surface.
In this paper the experimental procedure is presented in a first part. Next a mechanical modelling and the inverse problem resolution are described. Finally, results are reported followed by a discussion.
2 Full-field measurements
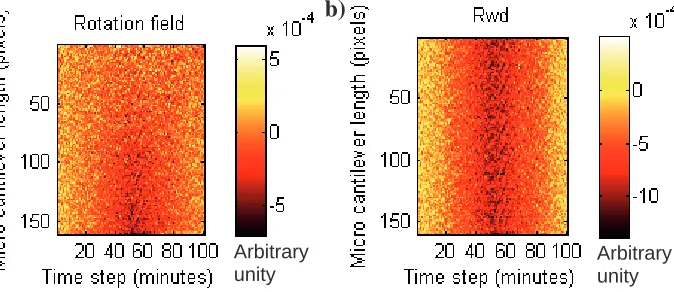
Micro-cantilevers (70 µm length, 20 µm wide and 0.84 µm thickness) that are made of 770 nm thick silica obtained by thermal oxidation of a silicon wafer and covered with a of 20 nm thick titanium layer and a 50 nm thick gold one are used. The gold layer is used as a working electrode in an electrochemical cell which also contains a platinum wire counter electrode and an Ag/AgCl reference electrode. Its potential is varied using a potentiostat. The induced chemical and mechanical effects are observed using a multiple wavelengths imaging microscopy [13]. Owing to their different wavelengths dependence, mechanical and chemical effects can be decoupled so that one obtains two fields: a rotation field r(x) (Fig. 1. a) describing the surface deformation and a wavelength-dependent contribution Rwd(x) (Fig. 1. b) which is assumed to linearly depend on the electrochemical
Fig. 1. Rotation field r(x) (a) and wavelength-dependent contribution Rwd(x) (b) obtained by multiple
wavelengths imaging microscopy.
Fig. 2. Electrochemical charge applied on the cantilever as a function of the time.
3 Identification procedure
3.1 Mechanical modelling
Assuming the cantilever under scrutiny is an Euler-Bernoulli beam, r(x)=
dx
dw
where w(x) is
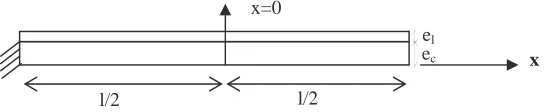
the out of plane displacement field of the cantilever. The mechanical effect induced by the chemical composition charge is described by a thin (virtual) layer (Fig. 3.) which is ascribed to deform
together with the underlying beam. Denoting el the virtual layer thickness,
l
e
e
is assumed to be very
a)
b)
Arbitrary unity Arbitrary
Fig. 3. Modelling of the layer on the cantilever.
l,ec, are the length and the thickness of the micro-cantilever, respectively.
The interfacial shear stress field is expanded onto a Legendre polynomial basis [14]:
¦
¸
¹
·
¨
©
§
K k k kl
x
P
x
02
)
(
W
W
(1)As there is no more load applied on the cantilever, the system is supposed to be at equilibrium, thus
0
.
)
(
0 2 / 2 /³
W
K
K
W
d
l
l
l
(2)
The equilibrium and the kinematic compatibility conditions at the interface read [17]:
)
(
.
x
b
dx
dN
lW
and
¸
¹
·
¨
©
§
¸
¹
·
¨
©
§
2
)
(
2
)
(
x
u
l
u
x
u
l
u
l l c c (3)Fig. 4. Modelling of the interfacial stresses.
For a given charge, they enforce the measured fields to satisfy:
K
[
[
W
K
K
K
K
K
Kd
d
l
P
E
e
E
e
I
E
d
R
F
d
d
w
d
e
K k x l l k k l l c c c c x l wd x l c¦ ³ ³
³
³
¸
¹
·
¨
©
§
¸¸¹
·
¨¨©
§
1 /2 /2 2 / 2 /
2
1
1
)
(
²
)
(
²
2
(4) withK
K
K
K
W
d
d
w
d
l
P
be
k
l l k c k 3 3 2 / 2 /2
1
1
2
³
¸
¹
·
¨
©
§
(5)where Ec, Ic ,b and El are the Young’s modulus, the moment of inertia of the cantilever, the width of
the cantilever’s cross section and the Young’s modulus of the virtual layer, respectively.
The product elEl, assumed equivalent to the mechanical spring constant of the virtual layer, and the
coefficientF are to be identified from solving these equations.
3.2 Inverse problem
In order to eliminate a part of the noise in the measured rotation field, it is expanded onto a Legendre polynomials basis:
¦
¸
¹
·
¨
©
§
K
k k k
l
x
P
r
x
r
0
2
)
(
(6)with the rk coefficients which are constants.
On one hand, the number of Legendre polynomial (K+1) has to be small enough to minimize noise. On the other hand, it has to be large enough to correctly describe the experimental data, this is why a compromise between data and noise has to be found. Singular values decomposition of the projection operator shows that the maximum number is K=80 here. In the sequel, it is chosen that the number of Legendre polynomials should not exceed 20.
Moreover this projection will be used for the calculation of 3
3
K
d
w
d
by differentiating twice the
Legendre polynomial basis.
¸
¹
·
¨
©
§
¦
l
x
P
dx
d
r
d
w
d
k K
k k
2
²
²
0 3 3
K
(7)
The product elEl is assumed to be a constant, ie it doesn’t depend neither on x coordinate nor on
charge. The coefficient F is assumed to be constant along x but to depend on the charge.
The equation (4) is solved simoultaneously for each pixel of coordinate x on the cantilever and for each charge. The equation (4) is recast as:
B
X
M
.
(8)With
»
»
»
»
»
»
»
»
»
¼
º
«
«
«
«
«
«
«
«
«
¬
ª
tf
tf
sum
m
m
sum
m
M
0
:
0
:
:
:
:
:
:
:
:
0
0
0
:
0
0
0
0
0
0
21 1
with
»
»
»
»
»
»
»
»
»
¼
º
«
«
«
«
«
«
«
«
«
¬
ª
³
³
³
K
K
K
K
K
K
d
R
d
R
d
R
m
l l wd x l wd l l wd t)
(
:
)
(
:
)
(
2 / 2 / 2 / 2 / 2 / and»
»
»
»
»
»
»
»
»
¼
º
«
«
«
«
«
«
«
«
«
¬
ª
¸
¹
·
¨
©
§
¸
¹
·
¨
©
§
¸
¹
·
¨
©
§
¦ ³ ³
¦ ³ ³
¦ ³ ³
K
[
[
W
K
[
[
W
K
[
[
W
K K Kd
d
l
P
d
d
l
P
d
d
l
P
sum
K k l l l k k K k x l l k k K k l l l k k t 1 2 / 2 / /2 1 /2 /2 12 /
2 / /2
2
:
2
:
2
(10) And»
»
»
»
»
»
»
»
»
¼
º
«
«
«
«
«
«
«
«
«
¬
ª
¸¸¹
·
¨¨©
§
l l c c c c f tE
e
E
e
I
E
Ft
F
F
X
1
1
:
:
1 and»
»
»
»
»
»
»
»
»
¼
º
«
«
«
«
«
«
«
«
«
¬
ª
tf tb
b
b
B
:
:
:
:
1 with»
»
»
»
»
»
»
»
»
¼
º
«
«
«
«
«
«
«
«
«
¬
ª
³
³
³
K
K
K
K
K
K
K
K
K
d
d
w
d
d
d
w
d
d
d
w
d
e
b
l l x l l l c t 2 / 2 / 2 / 2 / 2 /²
)
(
²
:
²
)
(
²
:
²
)
(
²
.
2
(11)Let us denote pf the pixel number along the cantilever and tf the number of time step. As pf=160 and
tf=100, the system has 16000 equations for 101 unknowns. Thus the system is overdetermined and is
solved in a least-square sense.
4 Results and discussions
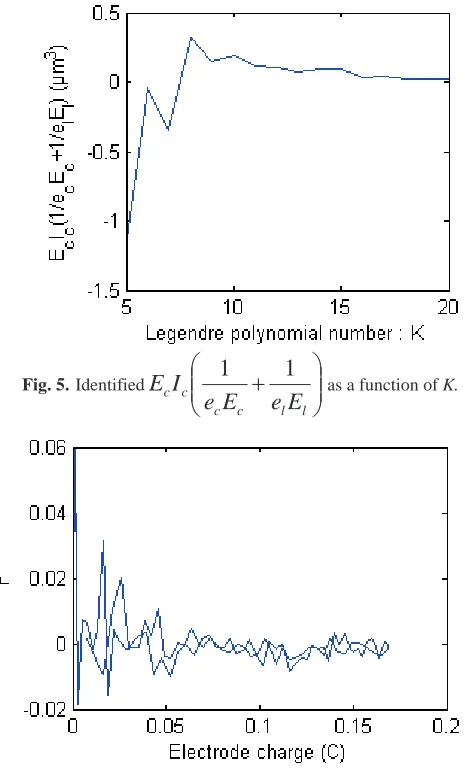
Equation (7) is solved in a least-square sense for K varying from 5 to 20 and provides
¸¸¹
·
¨¨©
§
l l c c c c
E
e
E
e
I
Fig. 5.Identified
¸¸¹
·
¨¨©
§
l l c c c c
E
e
E
e
I
E
1
1
as a function of K.Fig. 6. Identified F (dimensionless) as a function of the electrode charge for K=10.
Fig. 5. shows identified
¸¸¹
·
¨¨©
§
l l c c c c
E
e
E
e
I
E
1
1
as a function of K. The product thickness-Youngmodulus of the virtual layer (elEl) is found as a function of K with the Young modulus of the
micro-cantilever and Fig. 5.
A smallest K gives a negative term, probably because we have not enough information, but for values of Karound 10 results are consistent because they are positive.
Fig. 6. shows identified F as a function of the electrode for K=10 that is low. However, as the order of magnitude of the dimension of the Rwd field is not controlled it is difficult to conclude about it.
the underlying beam. The equivalent mechanical parameters induced by the molecule adsorption onto the micro-cantilever (product elEl and coefficient F) are found by solving an overdetermined
system.
Using an adequate number K of Legendre polynomial allows one to eliminate a part of the noise in the fields obtained by multiple wavelengths microscopy imaging. Assuming the stress applied along the micro-cantilever surface is homogeneous, the Stoney equation is often used to calculate it from measurements done with the optical lever technique [15-17]. However adsorption induced strain seems to deviate from the Stoney model [18-19]. This is supported by the fact that Kis greater than 2, so that the beam’s deflection cannot be modelled as a simple curvature.
The quality of the data should anyway be improved thereafter. Data obtained here are anyway qualitative, since the contact area between the gold electrodes and the electrolyte need to be controlled in order to get quantitative results. Therefore isolated gold cantilevers will be fabricated in clean room.
This project is supported by the French National Research Agency (ANR) in the frame of the research project named “µEcoliers”.
References
1. Z. Földes-Papp, U. Demel, G. P. Tilz, Journal of Immunological Methods, 260, (2002) 117-124. 2. D. H. Blohm, A. Guiseppi-Elie, Current Opinion in Biotechnology 12 (2001) 41-47.
3. K.M. Hansen, T. Thundat, Methods 37 (2005) 57-64. 4. T.P. Burg, S.R. Manalis, Appl. Phys. Lett.83, (2003) 13.
5. P. Bergese, E. Bontempi, M. Chiari, P. Colombi, F. Damin, L.E. Depero, G. Pirri, M. Zucca,
Applied Surface Science 253 (2007) 4226-4231. 6. T.P. Burg, S.R. Manalis, Appl. Phys. Lett. 83 (2003) 13
7. J.Fritz, M.K. Baller, H.P. Lang, H. Rothuizen, P. Vettiger, E. Meyer, H.J. Güntherodt, Ch. Gerber, J.K. Gimzerwki, Science 288 (2000) 316-318.
8. H. Ibach, C. E. Bach, M. Giesen, A. Grossmann, Surface Sciences 375 (1997) 107-119. 9. F. Quist, V. Tabard-Cossa, A. Badia, J. Phys. Chem. B, 107 (2003), 10691-10695. 10. D. Lee, T. Thundat, S. Jeon, Sensors and Actuators B 124 (2007) 143-146.
11. F. Amiot, F. Hild, F. Kanoufi, J.P. Roger, J. Phys. D: Appl. Phys. 40 (2007) 3314-3325. 12. F. Amiot, F. Kanoufi, F. Hild, J.P. Roger, Sensors and Actuators A 152 (2009) 88-95
13. N. Garraud, F. Amiot, F. Hild, J.P. Roger, G. Tessier, 2008 SEM XI International Conference and Exposition on Experimental and Applied Mechanics, Orlando.
14. F. Amiot, JoMMS (2) 9 (2007) 1787-1803.
15. L.Y. Beaulieu, M. Godin, O. Laroche, V. Tabard-Cossa, P. Grütter, Ultramicroscopy 107 (2007) 422-430.
16. Y. Huang, H. Liu, K. Li, Y. Chen, Q. Zhang, X. Wu, Sensors and Actuators A 148 (2008) 329-334.
17. V. Tabard-Cossa, M. Godin L.Y. Beaulieu, P. Grütter, Sensors and Actuators B 107 (2005) 233-241.
18. S. Jeon, T. Thundat, Appl. Phy. Lett. 85 (2004) 6.