C
a r d i f f
U N I V E R S I T Y P R I F Y S G O LCAERDY|§>
B INDING S E R V IC E S Tel +44 (0)29 2087 4949 F ax.+44 (0)29 2037 1921 E-Mail Bindery@ Cardiff.ac ukAPPLICATION OF SPIKING NEURAL
NETWORKS AND THE BEES ALGORITHM TO
CONTROL CHART PATTERN RECOGNITION
A thesis submitted to C ardiff University,
for the degree o f
Doctor o f Philosophy
by
Shahnorbanun Sahran, B.Science (Hons), MSc
M anufacturing Engineering Centre C ardiff University
United Kingdom
UMI Number: U584934
All rights reserved
INFORMATION TO ALL USERS
The quality of this reproduction is dependent upon the quality of the copy submitted. In the unlikely event that the author did not send a complete manuscript and there are missing pages, these will be noted. Also, if material had to be removed,
a note will indicate the deletion.
Dissertation Publishing
UMI U584934
Published by ProQuest LLC 2013. Copyright in the Dissertation held by the Author. Microform Edition © ProQuest LLC.
All rights reserved. This work is protected against unauthorized copying under Title 17, United States Code.
ProQuest LLC
789 East Eisenhower Parkway P.O. Box 1346
ABSTRACT
Statistical process control (SPC ) is a method for improving the quality o f products. Control charting plays a most important role in SPC. SPC control charts arc used for m onitoring and detecting unnatural process behaviour. Unnatural patterns in control charts indicate unnatural causes for variations. Control chart pattern recognition is therefore important in SPC. Past research shows that although certain types o f charts, such as the CUSUM chart, might have powerful detection ability, they lack robustness and do not function autom atically.
In recent years, neural netw ork techniques have been applied to automatic pattern recognition. Spiking Neural N etw orks (SNNs) belong to the third generation o f artificial neural netw orks, with spiking neurons as processing elements. In SNNs, time is an im portant feature for inform ation representation and processing. This thesis proposes the application o f SNN techniques to control chart pattern recognition. It is designed to present an analysis o f the existing learning algorithms o f SNN for pattern recognition and to explain how and w hy spiking neurons have more computational pow er in com parison to the previous generation o f neural networks.
This thesis focuses on the architecture and the learning procedure o f the network. Four new learning algorithm s are presented with their specific architecture: Spiking
Learning V ector Q uantisation (S-LV Q ), Enhanced-Spiking Learning V ector
Algorithm to optimise the LVQ pattern recognition networks. Overall, the aim o f the research is to develop a simple architecture for the proposed network as well as to develop a netw ork that is efficient for application to control chart pattern recognition. Experim ents show that the proposed architecture and the learning procedure give high pattern recognition accuracies.
DEDICATION
THIS W ORK IS EN TIRELY DEDICATED TO MY BELOVED FAMILY
TO MY HUSBAND: AZHAR MOHD KHALEL
who has greatly encouraged and supported me during my studies
TO MY CH ILD REN : M UHAM MAD FIRHAN AZHAR : LUKHM AN HAKIM AZHAR : NUR KHAISUMAH AZHAR : HILAL AZHAR
: UW AIS AZHAR who always brings jo y to my life
TO MY PARENTS: FATIM AH KHALIL KHAN & SAHRAN UTOH who always pray for successfulness for my life
TO MY PARENTS-IN-LAW : HABIBAH ISMAIL & MOHD KHALEL MOHD DAHAN
ACKNOW LEDG EM ENT
First, I thank ALLAH (M y Lord) the all high, the all great and merciful who made it possible for me to complete this work.
I am privileged to have Professor D.T.Pham as my supervisor. The high standard o f his research has always been an inspiration and a goal to me. I am deeply grateful to him for his consistent encouragem ent, invaluable guidance and strong support during the course o f this study. His thoughtful advice and constant support extended to me will alw ays be rem em bered. M ay ALLA H bless him and his family.
I wish to express my sincere thanks to the C ardiff University, especially the M anufacturing Engineering C entre (M EC) for the use o f the facilities to pursue this research.
I am also very grateful to all the members o f the MEC for their friendship and helps. Special thanks go to my fellow Ph.D. students Mr. Charles and the Bay Bees colony Mr. Afshin, Mr. Sameh, Mr. Ebubekir, Mr. Marco, Mr. Zaidi and Miss Jaynee for their useful discussion and sincere help whenever I needed them. My deeply thanks to my dear friend Dr. Zarina, Mrs. Siti Aishah, Dr. Zakaria, Mrs. Yuhanis, Mr. Massudi and Mr. Yahya for their sincere help regarding programming C++.
I would also like to thank all the members o f the M alaysian com m unity in C ardiff for their support and friendship. I am very grateful and acknowledge the substantial
Departm ent o f M alaysia. Sincere thanks are also to all the members o f staff o f the Faculty o f Inform ation Science and Technology especially the Departm ent o f Industrial C om puting, Universiti Kebangsaan M alaysia, who taught me and gave me the scientific base to continue my postgraduate studies.
I wish to express my heartfelt gratitude to my parents, Fatimah Khalil Khan and Sahran U toh for all the love and consistent support they have given me. I also want to express my warm est thanks to my parents-in-law, Habibah Ismail and M ohd Khalel M ohd Dahan for their love and support in my studies. I also want to thank my grandm other and cousins. Finally yet importantly, I wish to sincerely thank my husband, A zhar M ohd Khalel and my children, M uhammad Firhan, Lukhman Hakim, N ur Khaisumah, Hilal and Uwais for their love, patience, support and understanding.
DECLARATION
This work has not previously been accepted in substance for any degree and is not being concurrently subm itted in candidature for any degree.
S ig n e d .-rrfT.. J. .!'... (Shahnorbanun Sahran-Candidatc)
D a le... . / ? . / . ...
Statem ent 1
This thesis is the result o f my ow n investigation, except where otherwise stated. Other sources are acknow ledged by footnotes giving explicit references. A bibliography is appended.
S ig n ed .. . ...tC ....(Shahnorbanun Sahran-Candidate)
D ate ...
Statem ent 2
I hereby give my consent for my thesis, if accepted, to be available for photocopying and for inter-library loan and for the title and summary to be made available to outside organisations.
S ig n ed ... ,-rrrTT$. .Y ?.Srrrrrr./:... (Shahnorbanun Sahran-Candidate)
CONTENTS
A B ST R A C T jj DEDICATIO N iv A C K N O W L ED G E M EN T v D ECLARATIO N vii CO N TEN TS viiiLIST OF FIG URES xiv
LIST OF TA BLES xvii
A B BR E V IA T IO N S xviii C hapter 1. Introduction 1
1.1 M otivation 1
1.2 Research objectives 7
1.3 Thesis organisation 8
C hapter 2. A pproaches to Control Chart Pattern Recognition 10
2.1 Pattern Recognition 10
2.2 Pattern Recognition Learning Algorithm 11
2.2.1 U nsupervised Learning 13
2.2.2 Supervised Learning 13
2.3 Control Chart Pattern Recognition 15
2.3.1 Control chart patterns sim ulator 22
2.4 Current Trends in C ontrol Chart Pattern Recognition Research 25
2.4.1 Statistical or Traditional Based CCPR 26
2.4.2 Artificial Intelligence (AI) Based CCPR 27
2.4.2.1 Fuzzy sets 27
2.4.2.2 Expert Systems 28
2 .4 .2 .3 A rtificial N e u ral N etw o rk s 32
2.5 Spiking Neural N etw orks 33
2.5.1 Biological Background 33
2.5.2 Neuronal Coding Schem e 38
2.5.3 Rate Codes 38
2.5.3.1 Rate as an A verage over Time 39
2.5.3.2 Rate as a Spike Density (Average over
Several R epetitions o f the Experiment) 41
2.5.3.3 Rate as a Population Activity
(A verage over Several Neurons) 43
2.5.4 Tem poral C oding 43
2.5.4.1 Tim e-to-first-spike Coding 45
2.5.4.2 Phase Coding 48
2.5.4.3 Correlations and Synchrony 50
2.5.5 Spiking N euron M odel 50
2.6 O ptim isation A lgorithm 52
2.7 Summ ary 53
C hapter 3. Spiking Learning V ector Quantisation (S-LVQ ) 54
3.1 Prelim inaries 54
3.3 The LVQ A lgorithm 57
3.4 Learning Procedure in Standard LVQ N etw orks 58
3.5 Variants o f LVQ Learning Procedures 59
3.5.1 LVQ2 59
3.5.2 LVQ with a C onscience 63
3.5.3 LVQ-X 64
3.6 Discussion 67
3.7 Current Trends in Spiking Neural Networks Research 69
3.7.1 Typical Spiking Neural N etw orks Architecture 69
3.7.2 A Review o f Existing SNNs Learning Procedure 73
3.7.2.1 SNNs for Supervised Learning Procedure 73
3.7.2.1.1 Error Gradient Based Learning 74
Procedures
3.7.2.1.2 Hebbian-based Supervised 75
Learning procedures
3.1.2.2 SNNs for U nsupervised Learning Procedure 76
3.7.2.2.1 W eight-based Learning 76
3.7.2.2.2 Delay-based Learning 78
3.8 Discussion o f SNNs 81
3.9 M otivation for Research 83
3.10 Proposed S-LVQ A lgorithm 86
3.10.1 Network Structure 86
3.10.2 S-LVQ Learning Procedure 91
3.10.2.1 Boosting 93
3.11 Setting the W eights, Delays and Threshold 100
3.12 D a taS et 100
3.13 Empirical Evaluation o f S-LVQ 101
3.14 Com parison with LVQ and its Variants 103
3.15 The Effect o f Num ber o f Hidden Neurons on S-LVQ 103
3.16 Summ ary 106
C hapter 4. Enhanced S-LV Q Network (NS-LVQ) 107
4.1 Previous Work 107
4.2 M otivation for Research 109
4.3 NS-LV Q N etw orks A rchitecture 110
4.4 Setting the W eights, Delays and Threshold 114
4.5 Pre-Process W eights 117
4.6 NS-LVQ Learning Procedure 118
4.7 D a taS et 124
4.8 Empirical Evaluation o f NS-LVQ 125
4.9 Com parison with S-LVQ and Traditional N Ns 127
4.10 Learning Param eter ( T] ) 128
4.10.1 Static Learning Rate 128
4.10.2 A daptive Learning Rate 128
4.10.3 Static Vs Adaptive Learning Rate 132
Chapter 5. O ptim isation o f Spiking Neural Networks 134 Using the Bees Algorithm
5.1 Preliminaries 134
5.2 Intelligent Sw arm -based O ptimisation Algorithms (SOAs) 135
5.3 The Basic Bees A lgorithm 137
5.3.1 Honey Bees in N ature 137
5.3.2 Bees A lgorithm 139
5.3.3 Characteristics o f Bees Algorithm 139
5.4 Bees in Artificial N eural N etw ork 143
5.5 Evolution Strategy (ES) in SNNs 147
5.6 M otivation for Research 148
5.7 Spiking Neural N etw orks with Proposed Bees Algorithm 149
5.7.1 N etw orks Structure 149
5.7.2 Optim ising the N etw orks 150
5.7.3 Proposed Bees A lgorithm 153
5.7.4 Spiking N etw orks Training Procedure 157
5.7.5 The Proposed Bees Algorithm Parameters 158
5.8 D a taS et 158
5.9 Empirical Evaluation o f Spiking Networks with Proposed 160
Bees A lgorithm
5.9.1 Com parison with Spiking N etwork without 162
Bees Algorithm
Chapter 6 Conclusions and Future W ork 164 6.1 Contributions 165 6.2 Conclusions 169 6.3 Future Work 172 Appendix A 174 Appendix B 205 Appendix C 208 References 210
L IS T O F F IG U R E S
C hapter 2
Figure 2.1 : A framework for pattern recognition
Figure 2.2 : A typical control chart indicating the process is in statistical control
Figure 2.3 : A typical control chart indicating the process is out o f statistical control.
Figure 2.4 : Six main classes o f control charts.
Figure 2.5 : Main com ponents o f an expert system
Figure 2.6 : Action potential in the visual cortex o f a monkey
Figure 2.7 : Biological neuron
Figure 2.8 : Structure o f a nerve
Figure 2.9 ( a ): Definition o f the mean firing rate via a temporal average
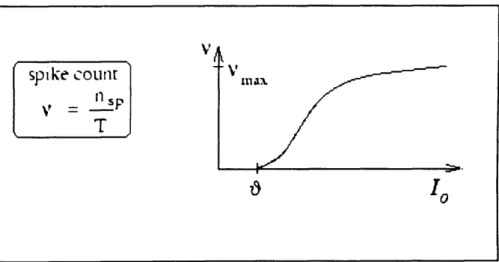
Figure 2.9 ( b ): Gain function, schematic. The output rate //is given as a function o f the total input
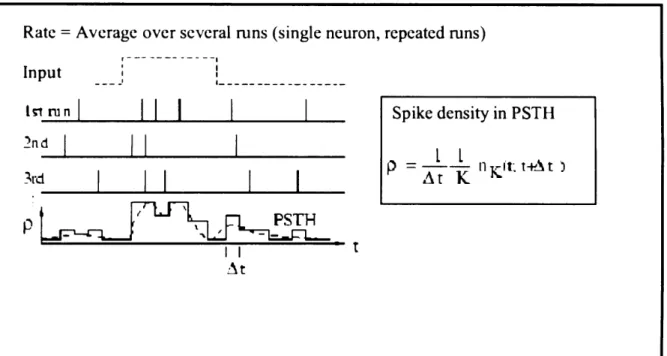
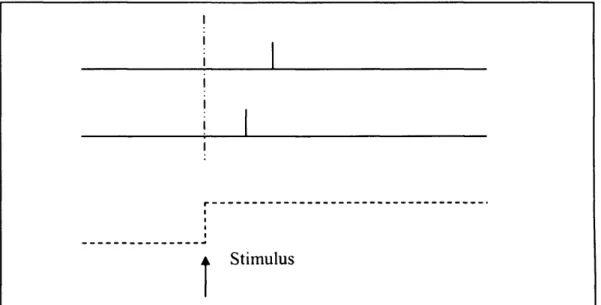
Figure 2.10 : D efinition o f the spike density in the Per-Stim ulus-Tim e Histogram (PSTH ) as an average over several runs o f the experiment
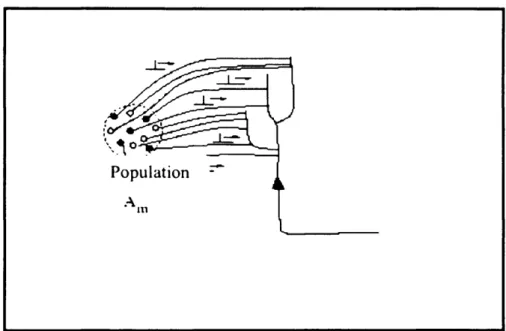
Figure 2.11 (a): A postsynaptic neuron receives spike input from the population m
with activity A m.
Figure 2 .1 1(b): The population activity is defined as the fraction o f neurons that are
active in a short interval [/, t + A /] divided by A t.
Figure 2.12 : Time to first spike
Figure 2.13 : Phase coding
Figure 2.14 : Correlation / synchrony coding
Figure 3.2 Figure 3.3 Figure 3.4 Figure 3.5 Figure 3.6 Figure 3.7 Figure 3.8 Figure 3.9 Figure 3.10 C hapter 4 Figure 4.1 Figure 4.2 Figure 4.3 Figure 4.4 Figure 4.5 Figure 4.6 Figure 4.7 Chapter 5 Figure 5.1 Figure.5.2 Figure 5.3
: Flowchart for LVQ procedure
: Geometric representation o f LVQ2 procedure : Feed forward spiking neural network
: The proposed S-LVQ network structure
: M ulti-synapse term inals for the S-LVQ spiking neural network : A pseudo-code description for S-LVQ Algorithm
: A graph show ing the result o f the different pattern rccognisers : The classification accuracy for different number o f hidden neurons : The im plem entation o f the proposed S-LVQ algorithm for control
chart pattern recognition
: A structure proposed for the NS-LVQ network : M ulti-synapse term inals for the NS-LVQ network : A pseudo-code description for pre-process weight : A pseudo-code description for NS-LVQ Algorithm : Exponential decay function
: Linear decay function
: Adaptive vs. static learning for classification accuracy
: Flowchart o f the Bees Algorithm
: Graphical illustration o f the Bees Algorithm
: Single synapse connection between two neurons for the proposed spiking neural netw ork with the Bees Algorithm
Figure 5.4 : Pseudo-code o f the proposed Bees Algorithm
Figure 5.5 : Graph illustrating the shrinking method for points that are near to the peak
L IST O F T A B L E S Chapter 3 Table 3.1 Table 3.2 Table 3.3 Table 3.4 Table 3.5 Table 3.6 C hapter 4 Table 4.1 Table 4.2 Table 4.3 Table 4.4 Table 4.5 C hapter 5 Table 5.1 Table 5.2 Table 5.3 Table 5.4 Table 5.5 Table 5.6
: Performance o f various LVQ pattern recognisers : Results o f handw ritten digit recognition
: Details o f the proposed S-LVQ network used for control charts : Representation o f the output categories
: Results o f different pattern recognisers applied to control chart data set.
: The effect o f the num ber o f hidden neuron
: Details o f the proposed NS-LVQ network used for control charts : Representation o f the output categories
: Results o f different pattern recognisers applied to control chart data set.
: Testing accuracy for different values o f static learning rate : C om parison o f training accuracy based on two
different types o f adaptive learning rate.
: The param eters o f the Bees Algorithm for LVQ, RBF and MLP for control chart pattern recognition
: Perform ance o f different pattern recognisers with Bees
: Details o f the proposed S-LVQ network used for control charts with the Bees A lgorithm
: Details o f the proposed NS-LVQ network used for control charts with the Bees Algorithm
: The param eters o f the proposed Bees A lgorithm : Results o f different pattern recognisers
ABBREVIATIONS
SPC : Statistical Process Control
DOE : Design o f Experim ent
AS : Acceptance Sam pling
AI : Artificial Intelligent
NN : Neural N etw ork
ANNs : Artificial N eural N etw orks
LVQ : Learning V ector Quantisation
S-LVQ : Spiking Learning V ector Quantisation
NS-LVQ : Enhanced- Spiking Learning Vector Quantisation
MLP : M ulti-Layer Perceptron
RBF : Radial Basis Function
ART : A daptive Resonance Theory
SOM : Self-O rganising Maps
KNN : k-N earest N eighbour
CCPR : Control Chart Pattern Recognition
ARL : A verage Run Length
CL : Centre Line
UCL : Upper Control Line
LCL : Lower Control Line
X chart : Control Chart for Individual
MR-chart : M oving Range Chart
X -chart : Average Chart
g -chart : Standard D eviation Chart
CUSUM : Cumulative Sum Chart
EWMA : Exponentially W eighted Moving Average ().
SNNs : Spiking Neural N etw orks
SRM : Spike Response Model
LIFN : Leakey Integrate and Fire Model
PSTH : Per-Stim ulus-Tim e Histogram
PSP : Post-Synaptic Potential
WTA : W inner-Takes-A ll
SOAs : Sw arm -Based Optim isation Algorithms
SI : Swarm Intelligence
ACO : Ant Colony O ptim isation
GA : Genetic A lgorithm
PSO : Particle Sw arm Optim isation
BA : Bees A lgorithm
CHAPTER 1
INTRODUCTION
1.1 M otivation
Quality and productivity arc tw o essential factors for survival in a global economy experiencing trem endous developm ents in information technology. The quality o f a product can be evaluated in several ways. It is often very important to differentiate these different dim ensions o f quality. Garvin (1987) provides an excellent discussion o f eight com ponents or dim ensions o f quality. These are as follows:
1) Performance- will the product do the intended job? 2) Reliability- how often does the product fail? 3) Durability- how long does the product last?
4) Serviceability- how easy is it to repair the product? 5) Aesthetics- what does the product look like? 6) Features- what does the product do?
7) Perceived quality- what is the reputation o f the company or its product?
8) Conform ance to Standards- is the product made exactly as the designer intended?
In this research, only the perform ance dimension will be addressed. Efficient process control is a key elem ent in the m aintenance and improvement o f quality and productivity.
There are three major areas in statistical methods for quality control and improvement:
1) Statistical Process Control (SPC); 2) Design o f Experim ent (DOE); 3) Acceptance Sampling (AS).
This research specifically focuses on SPC. Statistical Process Control is a traditional technique to improve the quality o f products, reduce rework, and scrap so that the quality and productivity expectations can be met. SPC primarily involves the im plem entation o f control charts, which are used to detect any change in a process that may affect the quality o f the output. Among the eight dimensions o f quality, the perform ance dim ension for control charts has been chosen as the focus. Control charts have been the most popular and w idely used charts in industry for providing the capability for pattern recognition o r pattern classification. Their applications have now moved far beyond m anufacturing into engineering, environmental science, biology, genetics, epidem iology, medicine, finance, and even law enforcem ent and athletics [Lai, 1995; M ontgom ery, 1997; Ryan 2000].
The first control charts were developed by Shewhart in the 1920s [Shewhart 1931], These simple Shew hart charts have dominated applications to date. Recently, control chart pattern recognition has received considerable attention in the literature, including applications to syntactic approaches, fuzzy-expert systems and artificial neural network models. T o d ay’s manufacturing enterprises need to adopt modem tools o f quality engineering to maintain and improve their com petitiveness in the
marketplace. One way to improve control chart procedures is to replace the SPC specialist with computers, which are able to mimic human-like intelligent behaviour. Although other improved control chart varieties give more powerful detection ability, such as the combined Shew hart-CU SU M scheme, they still have limitations. First, they still lack a pattern recognition capability [Guo and Dooley, 1993; Cheng 1995]. A review suggests that pattern recognition research has increased in importance as driven by the need for rapid interpretation and quick response to process deterioration within advanced m anufacturing environm ents [Hwang and Hubelc, 1993; Guh et al., 1999a]. Piplani and Hubele [Piplani and Hubele, 2001] noted that research into this
area is relatively young. Second, the needs for robustness o f control chart
perform ance to violations o f assum ptions in control charting is increasing as in realistic situations data are auto-correlated. Third, as manufacturing complexity and uncertainty increase, SPC procedures becom e more demanding. There is a shortage o f good SPC specialists as the skills required to implement proper control chart procedures develop over time, making use o f the accum ulated knowledge o f the processes involved. In addition, a specialist’s skills may vary from one machine, or plant, to another and involve human factors regarding learning ability, attitude and decision making aptitude. Fourth, the systems do not take effect automatically.
Recently, attention has focused on artificial intelligence (AI), a branch o f com puter science, which has shown great promise in dealing with difficult manufacturing problems. What makes AI techniques popular is their ability to learn from experience and to handle uncertain, imprecise (fuzzy) and complex information in a competitive environment that demands high quality. Among the available AI tools, neural networks is one o f those which has attracted the most attention from researchers and
practitioners for the solving o f many control chart issues such as pattern recognition. A clear definition o f artificial neural networks (ANNs) is given by Hecht-Nielsen, [Hecht-Niclscn ,1990] in Pandya & Macy [Pandya & Macy ,1995].
“A neural netw ork is a parallel, distributed information processing structure consisting o f processing elem ents (which can possess a local m emory and can carry out localized inform ation processing operations) interconnected via unidirectional signal channels called connections. Each processing element has a single output
ANNs enhance this work by capturing automatically more meaning from the limited num ber o f m easurem ents that originally were collected for traditional control charts. The desired characteristics o f a real-tim e SPC system in a highly automated and integrated m anufacturing environm ent are accurate representation o f the process without oversim plification and adaptability to new changes [Jacobs and Luke, 1993]. Previous researchers [Hwang, 1992; Pham and Oztemel, 1994; Cheng, 1997; Spoerre and V elasco, 2001] proposed ANNs as a potential solution to SPC pattern recognition problems.
A num ber o f researchers have dem onstrated the utility o f neural networks in identifying process non-random ness, such as shifts, cycles or trends, in quality control charts. Neural netw ork techniques have greatly extended and enhanced traditional approaches. One prom ising aspect o f neural network pattern recognition is that the system simultaneously can be trained to identify a variety o f unnatural patterns (Guh and Tannock 1999). The application o f ANN to SPC can also be beneficial when prior knowledge about the probability distribution o f the process data is unknown. ANN
has the ability to extract regularities in datasets w ithout any a priori assum ptions if the available data is enough for efficient training.
The new generation o f artificial neural networks has attracted research efforts from the dom ains o f artificial intelligence and pattern recognition because they offer the prospect o f describing much better the actual output o f a biological neuron. N etw orks o f spiking neurons (SNN s) are the third generation o f neural network models. The different generations o f AN N s based on neural network computational units can be defined as follows.
The first generation em ploys M cCulloch-Pitts neurons as computational units. These are also referred to as pcrceptrons or threshold-gates. They give rise to a variety o f neural netw ork m odels such as m ulti-layer pcrceptrons, Hopfield nets, and Boltzmann machines. A characteristic feature o f these models is that they can only give digital output. In fact, they are universal for computations with digital input and output, and every Boolean function can be com puted by some multi-layer perceptron with a single hidden layer.
The second generation is based on computational units that apply to a weighted sum (or polynomial) o f the inputs an “activation function” with a continuous set o f possible output values, such as the sigmoid function or the linear saturated function. Typical exam ples for netw orks from this second generation are feedforward and recurrent sigmoidal neural nets, as well as networks o f radial basis function units. The characteristic features o f these models are that they can compute arbitrary Boolean functions; furthermore, they can com pute certain Boolean functions with fewer gates than neural netw orks from the first generation. In addition, neural networks from this second generation are able to compute functions with analogue input and output. In
fact, they arc universal for analogue computations in the sense that any continuous function with a compact domain and range can be well approxim ated by a network o f this type with a single hidden layer. The second generation also support learning algorithms, which arc based on gradient descent, such as back propagation.
The third generation incorporates spiking neurons (or “integrate and fire neurons”) as com putational units. There exist a number o f variations o f this model, which are described and com pared in a recent survey [Gerstncr, 1995]. Spiking neuron models are high level models in w hich biological neurons are considered as homogeneous processing units. M odels for spiking neurons based on temporal coding are the Spike Response M odel (SRM ), and the Leakey Integrate and Fire Model (LIFN) [Maass, 1997a]. This research adapts the Spike Response Model (SRM) as the model [Bialek, Rieke, de Ruyter and W arland, 1991]. SNNs have a similar architecture to traditional neural networks. SNNs use spikes as the basis for information processing and are based on tem poral coding. The characteristic features o f SNNs are firstly that they are substantially more realistic as com pared w ith the previous two models. In particular, they describe m uch better the actual output o f a biological neuron, and hence they allow us to investigate on a theoretical level the possibilities for using time as a resource for com putation and comm unication. Secondly, the timing o f individual or single spikes plays the kcy-rolc in both computation and communication in SNNs. Thirdly, the output o f all the spiking neurons is spikes o f the same dimension. In other words, the output o f a spiking neuron consists o f the set o f points at the time when a neuron fires. Fourthly, the timing o f a single spike is considered, but not the dimension. Lastly, a spiking neuron can be viewed as a digital or analogue computational elem ent, depending on the type o f temporal coding that is used [Maass & Bishop, 2001].
1.2 Research O bjectives
The overall aim o f this research was to design and develop spiking neural network systems as a powerful pattern recognition tool for control chart data. These systems should be able to recognise patterns in control chart data in an efficient and effective way. M oreover, the system s should be reliable and with a simple architecture. Accordingly, they should be able to achieve superior performance in terms o f classification accuracy. To achieve the overall aim o f the research, the following objectives were set:
■ To perform a detailed analysis o f existing spiking neural network techniques
for classification learning, with particular emphasis on supervised learning, and to assess their appropriateness for control chart pattern recognition application.
■ To develop a sim ulator to create and to perform a detailed analysis o f spiking
neuron netw orks on control chart pattern recognition.
■ To improve the overall perform ance o f spiking neuron networks including:
> To improve the im plem entation o f existing learning algorithms that has been considered as significantly suitable for identified problems.
> To develop new learning algorithms that are com putationally efficient for control chart pattern recognition accuracy.
> To adopt a simple architecture such as learning vector quantization (LVQ) for spiking neuron networks.
> To develop an effective method o f training spiking neural networks using an optim isation algorithm.
1.3 Thesis Organisation
The rem ainder o f the thesis is organised as follows.
Chapter 2 defines the classification learning problem, presents a framework for viewing approaches to it, discussing in some detail spiking neuron networks algorithm s and review s other artificial neural networks approaches. Current trends and recent developm ents in spiking neural networks research are also presented.
C hapter 3 gives a detailed description o f previous work on learning vector quantisation and its application to control chart pattern recognition. This chapter also discusses the potential o f spiking neural networks as a pattern recogniser for control charts. A simple netw ork structure similar to that o f an LVQ network [Pham and Liu, 1995] is utilised. A ccordingly, a new learning algorithm, called spiking learning vector quantisation (S-LV Q ), is proposed for control chart pattern recognition. An empirical evaluation o f the proposed algorithm is also reported and discussed.
Chapter 4 is an enhancem ent o f the network presented in chapter 3. Based on the S- LVQ network, a simpler netw ork structure is proposed. This chapter describes a new method for establishing pre-process weight and its advantages are discussed. A study o f static and adaptive learning param eters is also presented. Finally, the chapter gives the results o f experim ents carried out to demonstrate the perform ance o f the proposed structure.
Chapter 5 proposes the use o f the Bees Algorithm, a new optim isation tool, for training spiking neural networks. The chapter presents a detailed description o f the algorithm and its application to the control chart pattern recognition problem.
Chapter 6 summarises the contributions and conclusions o f the thesis and proposes directions for further research.
CHAPTER 2
APPROACHES TO CONTROL CHART PATTERN RECOGNITION
2.1 Pattern Recognition
An informal definition for pattern recognition is telling things apart. Otherwise, pattern
recognition is the automatic transformation o f data X j (observation, features) into a set o f
symbols C j (classes). Pattern recognition (also known as pattern classification) is a field
within the area o f computer science and can be defined as “the act o f taking in raw data and taking an action based on the category o f the data” [Duda R.O et al, 2001]. In other words, pattern recognition is a process o f extracting information from an unknown data stream or signal and assigning it to one o f the prescribed classes or categories [Haykin, 1999]. It uses methods from statistics, machine learning and other areas. Typical applications are automatic speech recognition, classification o f text into several categories (e.g. spam or non-spam email messages), the automatic recognition o f handwritten postal codes on postal envelopes, or the automatic recognition o f images o f human faces. The last three examples form the subtopic image analysis o f pattern recognition that deals with digital images as input to pattern recognition systems. Pattern recognition techniques include Neural Networks, Hidden Markov Models, and Bayesian Networks. The fundamentals o f various aspects o f pattern recognition can be found in
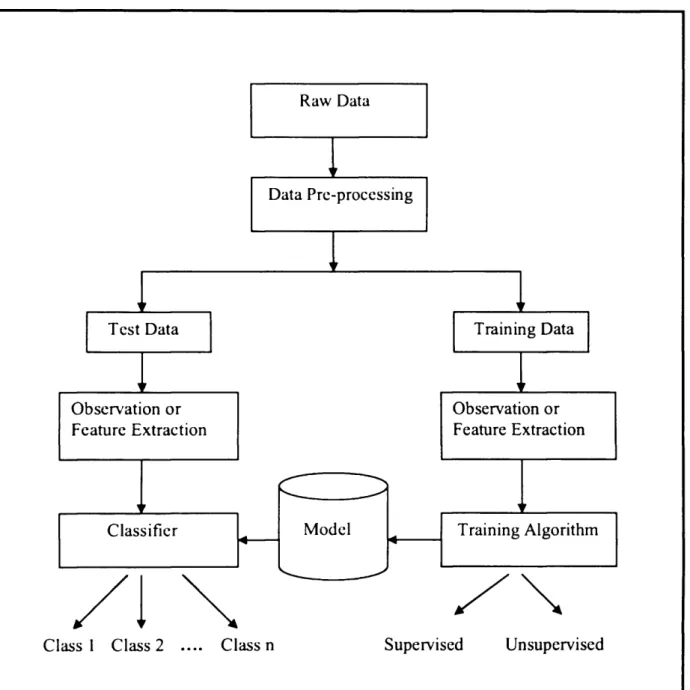
This chapter gives an overview o f pattern recognition approaches in general and o f control chart pattern recognition (CCPR) specifically. The chapter is organised as follows: section 2 formally defines the pattern recognition learning problem and presents a framework for viewing approaches to it. The framework is presented in Figure 2.1; section 3 describes in more detail control chart pattern recognition as this thesis is concentrated on control chart applications; section 4 reviews current trends and recent developments in control chart pattern recognition research; a review o f the spiking neural networks approach in which this thesis is most interested is presented in section 5; section 6 concludes the chapter with a summary o f some o f the key research issues in CCPR.
2.2 Pattern Recognition Learning Algorithm
Specifically, pattern recognition has three types o f learning algorithms. These are unsupervised, supervised and reinforcement learning algorithms. However, reinforcement learning can be regarded as a special form o f supervised learning. The detailed descriptions o f these learning algorithms will be given in the next subsection. Usually, any given type o f network architecture can be employed in any o f these three major learning algorithms. The next two subsections describe these three learning algorithms and identify the most suitable application for each algorithm.
Tcst Data Training Data Training Algorithm Raw Data Data Pre-processing Classifier Model Observation or Feature Extraction Observation or Feature Extraction
Class 1 Class 2 .... Class n Supervised Unsupervised
2.2.1 Unsupervised Learning
In classification learning, a learning algorithm is given a sample o f pre-classified examples from the problem domain called the training set. Each example is described by a vector o f attributes. An attribute is either nominal or continuous. The algorithm leams a model that is used to predict the class o f future examples.
Learning methods can be divided into supervised and unsupervised schemes based on whether or not a dedicated target function for prediction has been defined. In unsupcrvised methods, such a function is not available and the goal is grouping or clustering instances based on some similarity or distance measure. The unsupervised scheme is more suitable for application where there are insufficient examples.
2.2.2 Supervised Learning
In supervised learning, there is either a nominal or continuous-valued target function to be predicted. The former case is referred to as classification and the latter as regression or continuous prediction. In this thesis, only methods for supervised classification learning will be addressed.
If the examples in the training set are presented and used all at once, learning is said to be batch or off-line. If the examples are presented one at a time, and the concept definition evolves over time as successive examples are incorporated, learning is said to be
classification learning system is to produce a classifier that will assign previously-unseen examples (i.e., examples not in the training set) to the corresponding classes with high
accuracy. In other words, given a set o f example pairs (•r ’ 2/ ^ > V - ^ , the aim
is to find a function f in the allowed class o f functions that matches the examples and to
infer the mapping implied by the data.
The accuracy o f a classifier is defined as the probability that it will correctly classify a new, unlabelled example (i.e., examples in a test set). Ideally, given a complete description o f an example (i.e., the values o f all its attributes), its class should be determined unambiguously. However, in some instances, process data is available every second or every few minutes on hundreds o f process variables and product characteristics. Consequently, examples may appear with an erroneous class value, or with erroneous attribute values, or with both. These errors may stem from a diversity o f sources, including the limitations o f measuring instruments, and human error while typing examples into a computer. All o f these phenomena, referred to collectively as noise, limit the achievable accuracy in a pattern recognition or a pattern classification problem. The degree o f robustness o f a learning system with respect to noise is one o f its most important characteristics. It also occurs often in practice that the values o f certain attributes for certain example are simply not available. These are called missing values and again a practical control chart pattern recognition system must be able to handle them.
Generally, the applications that use the algorithm o f supervised learning are pattern recognition (also known as classification) and regression (also known as function approximation). The supervised learning paradigm is also applicable to sequential data (e.g., for speech and control chart recognition). This thesis concentrates on supervised learning algorithms.
2 J Control Chart Pattern Recognition
Many quality characteristics can be expressed in terms o f a numerical measurement. Examples include dimensions such as length or width, temperature, and volume. Such a quality characteristic that is measured on a numerical scale is called a variable. Control charts for variables are used extensively. The control charts for variable data are: control chart for individual (X); moving range chart (MR-chart); average chart (X -chart); range chart (R-chart); median chart; standard deviation chart (cr-chart); cumulative sum chart (CUSUM); exponentially weighted moving average (EWMA). Two o f the most commonly used control charts in industry for variable data are the X-bar charts and the range charts (R-charts). These two control charts were adopted in this study. The success o f quality improvement depends on two major factors:
1) The quality o f data available;
1 1 P 1V*/ CL O O ' © / \ _ .
/ \
7\
Y ' \ j \ i ^
x . I C ' T 9 \ OW
\ /*1
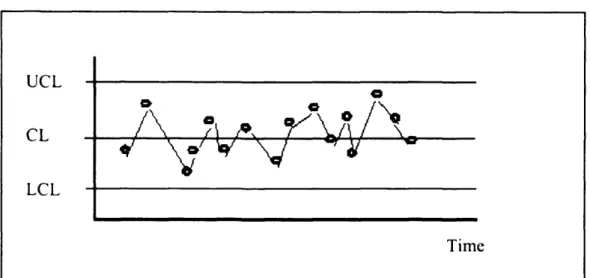
TimeFigure 2.2: A typical control chart; control chart indicates the process is in statistical control. UCL o o CL LCL Time
Figure 2.3: A typical control chart; control chart indicates the process is out o f statistical control.
Generally, control charts are a graphical display o f a quality characteristic that has been measured from a sample versus the sample number or time. The chart contains a centre line (CL) that represents the average value and the upper (UCL) and lower (LCL) lines allow variation limits (natural variation limits) o f the quality characteristic under consideration.
Figure 2.2 and Figure 2.3 show a typical control chart for a process in statistical control and a process out o f statistical control respectively.
These limits, usually taken as the mean value plus and minus three standard deviations, represent the boundaries o f the range for unavoidable (inherent) variations as follows:
UCL = /u + ^ = (1)
V/J
LCL = f u - -?= (2)
Three standard deviations are used because there is a high probability (99.73%) that a sample measurement will fall within this range if the process is in control (the quality characteristic is assumed to be normally distributed based on the central limit theorem). Proper construction and interpretation o f these charts is very important. Careful construction o f the charts and a capability analysis will determine the inherent variation o f a process which is in control and capable o f producing the products to meet customer specifications. After the charts have been constructed, they are employed for on-line process monitoring.
Control rules are used to detect out-of-control situations considering the very recent history o f a process. A bare X-bar chart only indicates when to look for disturbances. It does not indicate where to look for them, or what types o f disturbances are present. In order to avoid the occurrence o f such situations, instead o f waiting for them to happen and finding out afterwards, it is necessary to monitor the long term behaviour o f the process. This can be done by observing the patterns contained in the control charts for the process. It is important to detect the out-of-control situation as well as to recognise the shape o f an unnatural pattern. The nature o f control chart patterns can reveal any impending out-of-control situations.
Thus the problem o f monitoring a process to predict possible abnormalities reduces to that o f recognizing control chart patterns, which is the subject o f this research. Assumptions made for control chart performance are that the data is normally distributed and that the data is independent.
A control chart may indicate an out-of-control condition either when one or more points fall beyond the control limits or when the plotted points exhibit some non-random pattern o f behaviour. Certain types o f pattern may also indicate an out-of-control condition. For example, consider the control charts in Figure 2.3. Although all points fall within the control limits, the points do not indicate statistical control because their pattern is very non-random in appearance.
Such patterns may indicate a problem with the process, such as operator fatigue, raw material deliveries, and so forth. Although the process is not really out o f control, the yield may be improved by elimination or by reduction o f the sources o f variability causing those patterns.
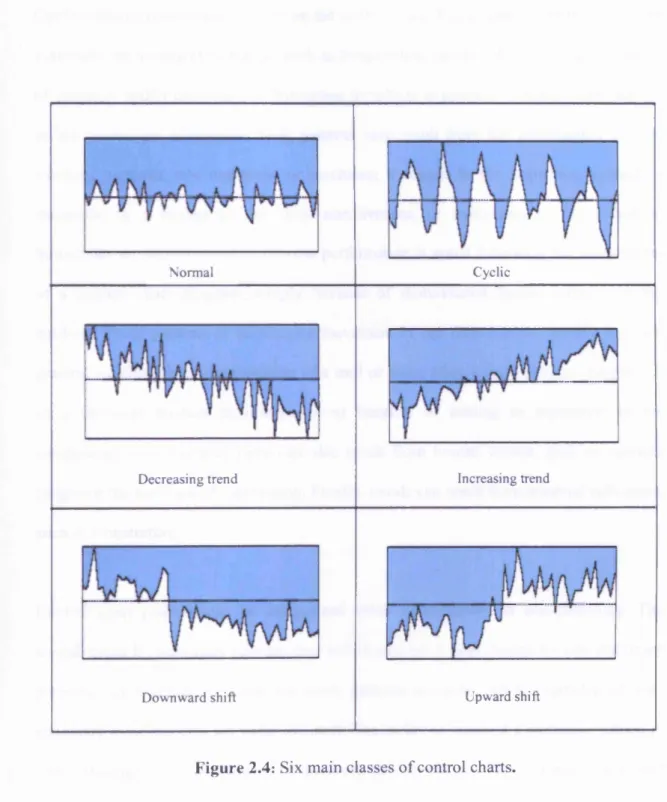
The problem is one o f pattern recognition. That is, o f recognizing systematic or non random patterns on the control chart and identifying the reason for this behaviour. In many cases, the pattern o f the plotted points will provide useful diagnostic information on the process, and this information can be used to make process modifications that reduce variability (the goal o f SPC). There are six main classes o f patterns in control charts, normal, cycle, upward trend, downward trend, upward shift, and downward shift, as illustrated in Figure 2.4.
Specifically, control chart pattern recognition is a process o f recognising an unknown CCP and assigning it to one o f the prescribed classes. CCP includes previous data, and does not rely merely on the last data. Normally, patterns o f the same category share common properties.
Normal Cyclic
Decreasing trend Increasing trend
Downward shift Upward shift
Cyclic patterns occasionally appear on the control chart. Cyclic patterns may result from systematic environmental changes such as temperature, operator fatigue, regular rotation o f operators and/or machines, or fluctuation in voltage or pressure or some other variable in the production equipment. Shift patterns may result from the introduction o f new workers, methods, raw materials, or machines; a change in the inspection method or standards; or a change in the skill, attentiveness, or motivation o f the operators. Sometimes an improvement in process performance is noted following the introduction o f a control chart program, simply because o f motivational factors influencing the workers. Trend patterns or continuous movement in one direction are usually due to a gradual wearing out or deterioration o f a tool or some other critical process component. In a chemical process they often occur because o f settling or separation o f the components o f a mixture. They can also result from human causes, such as operator fatigue or the presence o f supervision. Finally, trends can result from seasonal influences, such as temperature.
Control chart patterns can be categorised either as stationary or non-stationary. The overall mean for stationary patterns does not change but it does change for non-stationary patterns. An example o f mean stationary patterns is cyclic, while examples o f non- stationary mean patterns are trend and shift. The ability to interpret a particular pattern in terms o f assignable causes requires experience and knowledge o f the process. That is, one must not only know the statistical principles o f control charts, but also have a good understanding o f the process.
2.3.1 C o n tro l c h a rt p attern s <*i»nula t or
The following expression* \vefc Usc^ lo generate the different patterns for a control chart. This data set is used in this tb c *sis. The total number o f generated patterns is 1500. The training set employed 1002, and the testing set 498.
1. Normal patterns:
v(f) =
n + r(t)<f
(3)2. Cyclic patterns:
y(t) = /u
+
r( t ) f f
4(tS\n(2j]rJ/^)
^
3. Increasing or decreasing trends:
>’( / ) = Ji + r { f l o ± g t (5)
4. Upward or downward shifty:
y(t)
=
/
j+ r(i) <1
*
V
(
6
)
where
n = mean value o f the process v Uri:lb le being monitored
a = standard deviation o f the pr Oct,fiS
a = amplitude o f cyclic variations (t^k^n as 15 o r less)
g = magnitude o f the gradient o f the trend (taken as being in the range 0.2 to 0.5)
k = parameter determining tbc shi^ p o t i o n (k=0 before the shift position; k=l at the shift position and thereafter)
r = normally distributed rundot11 n u t t e r (betw een -3 and 3)
t = discrete time at which the pattern is sampled (taken as being within the range 0 to 59). T = period o f a cycle (taken as being in the range 4 to 12 sampling intervals).
v(t) = sample value at time t.
This pattern simulator is taken from Pham and Oztemel [Pham and Oztcmcl, 1994].
2 .3.2 Data pre-processing
In data pre-processing, the most important transformation techniques are 1) standardization; 2) zoning; 3) scaling and 4) using continuous (as opposed to binary) representation. In this thesis, before the data were presented to the networks, two steps o f data pre-processing were implemented: 1) scaling and 2) coding in spiking networks.
23.2.1 Scaling
Although the input data to any node can theoretically take any value, restricting it to fall within a fixed range produces more efficient training. Scaling is a transformation that is devised according to each individual application to modify the input data into a fixed range. The most important issue in scaling is the range o f output values dictated by the scaling transformation. Different types o f scaling transformation may operate over different ranges o f values [Zorriassatine and Tannock, 1998]. There are two advantages o f scaling described by Swinglcr [Swingler, 1996]. Firstly, it takes care o f the distribution o f the training data and the effect o f outliers, and secondly, it ensures that errors or variations o f different variables contribute the same proportion to the change in network
were sealed to fall as continuous values between 0 and 1. The actual data sets were scaled
values o fy(t). Scaling was performed using the following expression:
v(D = r(t) ~ •Vmin (7)
Tmax
y
minwhere
v = scaled pattern value (in the range 0 to 1)
Amin= minimum allowed value (taken as 35)
-Vmax= maximum allowed value (taken as 125)
This scaling method is taken from Pham and Oztemel [Pham and Oztemel, 1994] with some modification on the minimum and maximum allowed value.
23.2.2 Coding in Spiking Networks
In traditional neural networks, the essential information is encoded in the firing rates, which are averaged over time. Unlike the traditional neural networks, spiking neural networks use the timing o f single spikes generated by a neuron to encode information. The scheme o f coding used here is called temporal coding. It utilizes the timing o f individual spikes. More details concerning temporal coding are given in section 5. The scaled input data will then be mapped over a number o f time steps, referred to as the input time window. The coding resolution affects the performance o f the network. Increasing the number o f steps in the input time window will increase the precision. However, this will decrease the computational efficiency o f the model. The precision o f the temporal code should therefore be selected in such a way as to attain adequate
accuracy with optimal computational efficiency. In this thesis, experiments for control chart data set revealed that an input time window with 100 units is adequate. A simple linear mapping scheme is as follows:
Input time window = (100 - (100 * (scaled data))) unit.
2.4 Current Trends in Control Chart Pattern Recognition Research
Control chart pattern recognition research has been making significant progress in many directions. A review by Hwang and Hubele and also Guh [Hwang and Hubele, 1993; Guh et al., 1999a] noted that this area o f research has increased in importance, driven by the need for rapid interpretation and quick response to process deterioration within advanced manufacturing environments. Piplani and Hubele [Piplani and Hubele, 2001] claimed that research into this area is relatively young. This section examines two o f the most popular directions that have major impact on CCPR and discusses some current problems. The two directions are statistical or traditional based CCPR and automated and intelligent CCPR.
2.4.1 Statistical or Traditional Based CCPR
Generally, statistical based CCPR can be divided into four types: i) syntactic or structural matching, ii) template matching, iii) statistical testing, and iv) heuristic algorithm. Pham and Wani [Pham and Wani, 1997] applied heuristic techniques in their work on feature-
obtaining a good set o f heuristics is extremely laborious. Cheng [Cheng, 1989] proposed syntactic pattern recognition. Cheng and Hubele [Cheng and Hubele, 1996] proposed a mathematical pattern recognition algorithm drawn from syntactic (structural) and statistical (discriminate) approach. The problem is that the application o f such an algorithm would require trial and error experiments to define the parameters for the algorithm and their sensitivities to the patterns. Generally, traditional techniques for control chart pattern recognition rely on assumptions requiring prior process knowledge.
2.4.2 Artificial Intelligence (AI) Based CCPR
Recently, research issues have been closely related to advances in pattern recognition technology. AI in pattern recognition has attracted a lot o f research interest in time series data sequencing, especially in control chart problems. Artificial intelligence is a science that has defined its goal as concerned with designing intelligent computer systems, that is, making machines do things that would require intelligence if done by humans - understanding language, learning, reasoning, solving problems, and so on. Various AI techniques have been implemented for application in control chart pattern recognition including fuzzy sets, expert systems, and neural networks.
2.4.2.1 Fuzzy sets
The fuzzy set theory approach is a powerful means o f representing and handling uncertainty (imprecise information) and is particularly useful when an inexpensive
fuzzy rules provides a way o f exploiting the tolerance for imprecision to achieve tractability, robustness, and a low solution cost. Kahraman [Kahraman et al., 1995] reported the use o f triangular fuzzy numbers in the tests for unnatural SPC patterns. No results on the proposed method were given. Chang and Aw [Chang and Aw, 1996] developed a neural fuzzy control chart for detecting and classifying process mean shifts. Recently, Wang and Rowlands [Wang and Rowlands, 1999; 2000] explored the use o f fuzzy logic to represent zones in the control chart for detecting runs. Their results confirmed the feasibility o f the technique for control chart interpretation.
2.4.2.2 Expert Systems
An expert system is a system that employs human knowledge captured by a computer to solve problems that ordinarily require human expertise [Turban, 1995]. The heart o f expert systems is the domain knowledge (knowledge about a particular problem or situation). Therefore, expert systems are also referred to as knowledge-based systems. In an expert system, the domain knowledge is usually represented in two forms: it is either at the level o f know-how where underlying fundamentals are not detailed (shallow knowledge); or at a level where its theoretical and scientific fundamentals are deeply expressed (deep knowledge). There are several ways o f representing either type o f knowledge in an expert system. The three most popular methods are rules, frames, and semantic networks.
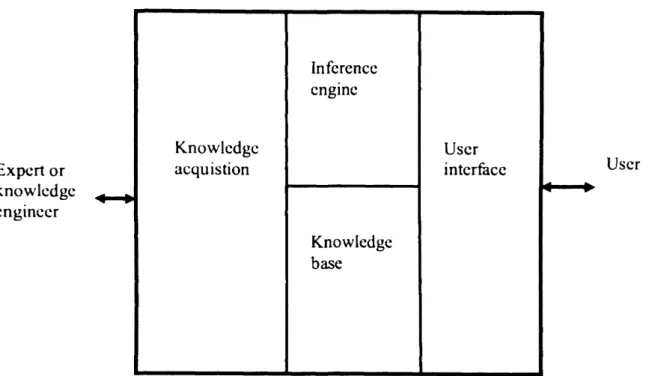
The four main components o f an expert system are:
(i) Knowledge base. This contains knowledge about the problem domain. It can
comprise rules, rule sets, frames, classes, and procedures.
(ii) Inference engine. This manipulates the stored knowledge to produce solutions
to problems. The inference engine in a rule-based expert system scans the knowledge base, selecting and applying appropriate rules. Inference can proceed in different ways according to different control procedures.
(iii) User interface or explanation module. This handles communication with the
user in a “natural” language. A set o f general facilities to be provided by a user interface module is documented by Zahedi [Zahedi, 1990].
(iv) Knowledge acquisition. This assists with the development o f the knowledge
base by facilitating the capture and encoding o f the domain knowledge. The main principles and strategies for knowledge acquisition may be found in Cullen and Bryman [Cullen and Bryman, 1988]. The main components o f an expert system are illustrated in Figure 2.5. Expert systems have been applied in SPC to automate control chart selection, construction, and analysis.
Some o f the traditional methods for CCPR have been implemented using the expert system technique. Swift [Swift, 1987] has described a knowledge-based control chart pattern recogniser. The system employs a statistical hypothesis and is designed for off line use. A drawback o f the system is that it assumes an in-control state always follows an out-of-control state whereas, in practice, once a process has gone out-of-control, it is unlikely to return to an in-control state without corrective intervention.
Similar systems have been reported for control chart pattern recognition using templates [Cheng, 1989; Cheng and Hubele, 1989] or control theory [Love and Simaan, 1989; Simaan and Love, 1990] instead o f statistical hypotheses. Pham and Oztcmel [Pham and Oztemel, 1992a] have described an on-line control chart pattern recogniser utilising heuristic rules and statistical hypothesis. Swift and Mize [Swift and Mize, 1995] used statistical significance tests as interpretative rules to determine the pattern variation. Generally, they reported promising results, and noted the feasibility o f the expert system for control chart pattern recognition.
Researchers have shown that expert systems are a powerful tool for knowledge gathering, knowledge retrieval, and decision making. Some drawbacks o f the system are its limited use for pattern recognition, particularly in a dynamic environment, and that it is time consuming to train the expert systems with all possible patterns. Furthermore, as mentioned above, expert systems require human experts to provide all the possible rules. This may create difficulty when recognising patterns that have not been encountered previously.
Expert or knowledge engineer Knowledge Inference engine User acquistion interface Knowledge base User
The inflexibility o f expert systems has limited their effectiveness in recognising control chart patterns, particularly within changing and dynamic manufacturing environments. Artificial neural networks were found to be a promising tool to overcome this limitation.
2.4.2 J Artificial Neural Networks
The pattern recognition and classification capabilities o f neural networks have been shown to be better than those o f traditional techniques [Lippmann, 1989]. Neural networks first appeared in the late 1980s. An artificial neural network is a massively parallel-distributed processor that has the ability to learn, recall, and generalise knowledge [Ilaykin, 1999]. A great deal o f research in neural networks for pattern recognition has focused on classification learning, the main aim o f which is to increase the accuracy o f correct classification. Neural network-based pattern recognisers perform identification and classification with minimum process knowledge, requiring only examples o f how different patterns are classified. Such pattern recognisers are able to generalise from given examples. This enables arbitrary patterns to be readily classified.
Sutton, Pham and Zhang [Sutton, 1992; Pham and Oztemel, 1994; Zhang et al., 1995] provide more detailed information regarding the application o f NNs to manufacturing in general. The principle reason for applying NNs to SPC is to automate SPC chart interpretation. Accurate representation o f the process without oversimplification, and adaptability to new changes, were among the features highlighted by Jacobs and Luke [Jacobs and Luke, 1993] as the desired characteristics o f a real-time SPC system within a
highly automated and integrated manufacturing environment. NNs can potentially satisfy these requirements.
Researchers have applied various examples o f NN architecture to pattern recognition. Existing popular NN architectures are: Multi-Layer Perception (MLP), Radial Basis Function (RBF), Learning Vector Quantization (LVQ), Adaptive Resonance Theory (ART), Auto-Associative NNS, and Kohonen Self-Organising Maps (SOM). As with NN architecture, there are also many rules for NN learning. Hwang and Hubele [Hwang and Hubelc, 1993a, 1993b] have applied NNs with Back-propagation architecture. They used the Average Run Length (ARL) as the performance criterion. Pham and Oztemel [Pham and Oztemel, 1993a, 1993b] applied BPN with a hybrid structure and used classification accuracy (%) as the performance criterion. In 1994, Pham and Oztemel [Pham and Oztemel, 1994] applied the structure o f LVQ-X. They used classification accuracy as the performance criterion. Hwang and Chong [Hwang and Chong, 1995] used ART1 mod architecture, but they used modified ARL as the performance criterion. Yang and Yang [Yang and Yang, 2002] proposed a new supervised LVQ for control charts based on a fuzzy-soft competitive learning network. They used classification accuracy as the performance criterion. Generally, all the researchers reported promising results. Among the existing NN architectures, LVQ structures have a very simple architecture. In this thesis, LVQ structures will be o f most interest and will be discussed in detail in Chapter 3.
2.5 Spiking Neural Networks
Experimental evidence from the past few years indicates that many biological neural systems use the timing o f single spikes (temporal coding) for very rapid speed information processing. It is considered that the timing o f the first spike contains most o f the relevant information needed for processing. As a result, very recently, researchers’ attention has shifted to spiking neurons. This research is concerned with spiking neuron networks as the ANN technique for control chart pattern recognition. Spiking neuron networks have a similar architecture to traditional neural networks, have spiking neurons as processing units, transmit information by spike (pulses), and use spikes as the basis for information processing.
Spiking neural networks are networks o f spiking neurons, which represent an entirely new generation o f artificial neurons. The next subsection introduces SNNs, including the biological background, coding scheme, and neuron models.
2.5.1 Biological Background
Research from the past hundred years has shown that the brain is comprised o f neurons. The most pertinent structures in neurons are axons, dendrites, the cell body, and synapses. The axons carry signals away from the cell body to other neurons. A neuron receives connections from thousands other neurons. Most o f these contacts take place on the neuron dendrites trees; however they can also exist on the soma or the axon o f the
neuron. The morphology o f the dendrites tree plays an important role in the integration o f the synaptic inputs and it influences the way the neuron processes information and computes [Mel, 1993]. The strengths o f the charges received by a neuron on its dendrites are added together through a nonlinear process o f spatial and temporal summation [Koch, 1999]. The dendrites receive stimuli and carry it to the cell body. The cell body is separated from the surrounding medium by a selectively permeable membrane. There is an electric potential which is also known as action potential associated with the concentration o f charged ions inside the cell. When the cell receives a signal, the signal may cause it to either increase or decrease the potential.
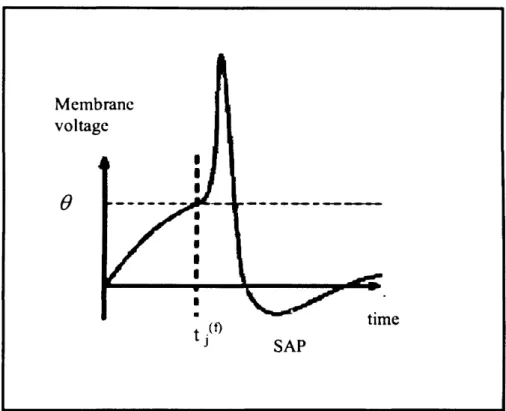
If the action potential exceeds a certain threshold, the neuron fires, sending signals to every other neuron to which it is connected through a synapse. Synapses play an important role in neuronal information processing. Immediately after a neuron fires, its potential is drastically lowered, which prevents it from repeatedly firing in some circumstances. Figure 2.6, Figure 2.7 and 2.8 show an action potential exceeding the threshold#, a biological neuron, and the structure o f a nerve respectively.
Membrane voltage
time SAP
dendrite
terminal
som a
Synaptic terminals: Bring signals from other neurons
Dendrites: Receive signals from other neurons
Cell body: Integrates signals; coordinates metabolic activities. Arrows indicates direction o f travel of action potential. Dendrites o f other neurons receive signals. Action potential starts here.
Myelin: Insulates the axon and speeds conduction Exposed areas of axon Synaptic terminals: Transmit signals to other neurons.
2.5.2 Neuronal Coding Scheme
The mammalian brain contains more than 1010 densely packed neurons that are connected to an intricate network. In every small volumes o f cortex, thousands o f spikes are emitted each millisecond. Generally, it is agreed that the information from one neuron to another is transmitted by an action potential. The action potential can travel along the neuronal fibres at a speed o f about forty meters per second. However, there are still a few questions that remain unanswered, such as what is the information contained in such a spatial-temporal pattern o f pulses, what is the code used by the neurons to transmit that information, and how might other neurons decode the signal. Therefore, there is a lot o f ongoing research with neuronal spikes and it has resulted in several coding schemes. Among the potential coding schemes are rate coding, temporal coding, and population coding. However, in this thesis only rate coding and temporal coding are discussed in order to make a comparison o f the coding logic for these two. The next section analyses the most widely accepted coding schemes, which are rate coding and temporal coding in traditional neural networks and spiking neural networks respectively.
2.5.3 Rate Codes
In a seminal contribution more than 75 years ago, Adrian showed that the firing rate o f stretch receptor neurons is related to the force being applied to the muscles [Adrian, 1926]. As a result, early neural network models interpreted the output o f artificial neurons as an abstraction o f the firing rate or rate coding in their biological counterparts. In a general way, rate coding is transferring information by means o f the firing rate o f a