UNITED ARAB EMIRATES
SELECTED ISSUES
This Selected Issues paper on the United Arab Emirates was prepared by a staff team of the International Monetary Fund. It is based on the information available at the time it was completed on June 11, 2014.
The publication policy for staff reports and other documents allows for the deletion of market-sensitive information.
Copies of this report are available to the public from International Monetary Fund Publication Services
PO Box 92780 Washington, D.C. 20090 Telephone: (202) 623-7430 Fax: (202) 623-7201 E-mail: [email protected] Web: http://www.imf.org
Price: $18.00 per printed copy
International Monetary Fund
Washington, D.C.
UNITED ARAB EMIRATES
SELECTED ISSUES
Approved By
A. KammerPrepared By T. Irwin and B. Shukurov
THE REAL ESTATE MARKET AND EXPO 2020 IN UAE: AVOIDING BUBBLES AND MACRO-INSTABILITY _____________________________________________________________________ 3
A. Introduction _____________________________________________________________________________ 3
B. Recent Developments in the Real Estate Market and Key Policy Measures _____________ 4
C. The Expo 2020 in Dubai: Impact and Key Lessons _______________________________________ 9
D. Conclusions ___________________________________________________________________________ 13
FIGURES
1. Price-to-Income Ratios __________________________________________________________________ 4
2. Price-to-Rent Ratios _____________________________________________________________________ 4
3. UAE Projets’ Value _______________________________________________________________________ 5
4. Residential Real Estate Price Index ______________________________________________________ 7
5. Dubai Real GDP Growth _______________________________________________________________ 10
6. Dubai Government Capital Spending _________________________________________________ 11
APPENDICES
1. Recent Developments in the UAE’s Real Estate ________________________________________ 14
2. Containing real estate booms: the case of Hong Kong ________________________________ 19
3. International Experience with Hosting Global Events __________________________________ 23
APPENDIX TABLES
1. Seller’s Stamp Duty (SSD) for Residential Properties __________________________________ 21
2. Buyer’s Stamp Duty (BSD) and Additional Buyer’s Stamp Duty (ABSD) for ____________ 22
CONTENTS
THE EFFICIENCY OF PUBLIC SPENDING _______________________________________________ 26
A. Overall Perception of Effectiveness ___________________________________________________ 26
B. Efficiency of Spending on Health and Education ______________________________________ 28
C. A Closer Look at the Efficiency of Public Investment __________________________________ 32
D. Efficiency Frontier Analysis ____________________________________________________________ 33
E. Public Investment Management Index ________________________________________________ 34
F. Project-Level Investment Analysis _____________________________________________________ 35
G. The Federal Government’s New Budget ______________________________________________ 39
H. Conclusions ___________________________________________________________________________ 44
BOX
1. Norway Governance Framework for Public Project Implementation __________________ 38
FIGURES
1. Selected Indicators Relevant to Efficiency of Public Spending ________________________ 27
2. Perceived Government Effectiveness and GDP Per Capita, 2013 ______________________ 28
3. UAE Public Spending and Selected Outcomes in Education and Health, 2012 ________ 29
4. Public Spending and Enrollment Rates in Secondary Schooling ______________________ 30
5. Potential Efficiency Gains in School Enrolment ________________________________________ 31
6. Global Competitiveness Indicators, 2013 ______________________________________________ 32
7. Public Capital Stocks and Quality of Overall Infrastructure, 2013 _____________________ 33
8. Measuring Efficiency: DEA and PFDH __________________________________________________ 34
9. Public Investment Management Index Stages _________________________________________ 35
10. Metro and Road Construction Cost Estimates _______________________________________ 37
11. Federal Spending by Function, 2011 _________________________________________________ 39
APPENDICES
1. DEA and PFDH_________________________________________________________________________ 46
2. Components of the Public Investment ________________________________________________ 47
APPENDIX FIGURE
1. Efficient Frontier Under DEA Concept _________________________________________________ 46
REFERENCES
28 May 2014
THE REAL ESTATE MARKET AND EXPO 2020 IN THE
UNITED ARAB EMIRATES: AVOIDING BUBBLES AND
MACRO-INSTABILITY
1The real estate sector in the United Arab Emirates, notably in the Emirate of Dubai, saw large correction in the context of the 2008/09 global financial crisis. A strong recovery in real estate prices has taken place since. In addition, newly announced megaprojects and investment in the run-up to the World Expo 2020 could exacerbate risks of potentially disruptive real estate correction, unless managed well. While the authorities have introduced some fiscal and macroprudential measures to contain real estate price growth and further bolster financial stability, cross-country experience suggests that additional measures may be needed if speculative demand affects real estate prices. The Expo 2020 is expected to bring substantial economic benefits to the economy, given Dubai’s well-established status as a hub of regional tourism and well-developed relevant infrastructure. Careful macroeconomic management and appropriate strategic planning measures will be essential to minimize cost overruns, avoid overheating, and mitigate the risk of a real estate bubble. These measures would include
preparing a sound feasibility study—in the context of the forthcoming master plan—linked to the post-event period, developing realistic demand projections, and financing the Expo and other large-scale projects in a fiscally prudent manner.
A. Introduction
1. A fast-paced recovery in some segments of the real estate sector in the United Arab Emirates, especially in the Dubai residential market, is benefitting economic growth, but has raised concerns of a potential real estate bubble. Several large megaprojects are expected to be executed in Dubai, mostly in the real estate and hospitality sectors. For the Expo 2020, the emirate is expected to spend up to US$18 billion,2 of which the authorities have reportedly committed US$8
billion in capital spending over the next several years. These megaprojects, if not implemented prudently, could exacerbate the risk of a disruptive real estate correction.
2. This note discusses the measures that could mitigate risks associated with the real estate cycle, the international experience with real estate booms and hosting large events such as World Expos, Olympic Games, and World Cup tournaments. Section II discusses the recent developments in the segments of the real estate market in Abu Dhabi and Dubai, focusing on changes in sales’ prices, rents, and supply in the market. In the absence of sufficient data to employ
1 Prepared by Bahrom Shukurov under the guidance of Harald Finger and with assistance from Peter Gruskin. 2 According to HSBC (March 2014).
valuation models, the note discusses price-to-income and price-to-rent ratios. The note also takes stock of measures the authorities have introduced recently to reduce the potential for speculative pressure in the real estate market and further strengthen the resilience of the banking system. It also discusses how other dynamic emerging markets dealt with rapid real estate price appreciation (Hong Kong, India, Korea, and Singapore). Section III discusses the impact of the Expo 2020 on Dubai’s economy, the experience of other countries hosting large events, and key lessons that could help in managing the Dubai Expo successfully from the macroeconomic point of view. Section IV concludes.
B. Recent Developments in the Real Estate Market and Key Policy
Measures
3. Following a real estate boom in 2002-08, the UAE’s real estate market was hit hard. Like in other countries, the real estate market in Dubai was adversely affected by the global economic crisis. Following steep price appreciation in the mid-2000s, Dubai saw significant price declines in the second half of 2008 and in 2009. The real estate market in Abu Dhabi also dropped, notably its residential segment, which came under pressure from the collapsed prices in Dubai’s real estate market. Residential property prices in Dubai fell until end-2011, while in Abu Dhabi price declines in the same segment continued in 2012.
4. The residential segment of the real estate market has recovered strongly, especially in Dubai. With the returned confidence in the real estate market, also helped by a successful bid for the Expo 2020, residential property prices in Dubai have been increasing at a fast pace, though the momentum appears to have slowed in recent months. The recovery in Abu Dhabi’s residential market started later than in Dubai. Similar trends can be seen in the residential market’s rents (see Annex 1).
5. Rising price-income and price-rent ratios can provide some guidance on valuation in the real estate market. Dubai’s price-income ratio has been rapidly accelerating and by end-2013 reached levels last seen in 2008, at the peak of the previous boom (Figure 1). By contrast, Abu Dhabi’s price-income ratio at end-2013 remained well below its peak in 2008. Figure 2 indicates that in both Abu Dhabi and Dubai, price-rent ratios have trended up (more so in Abu Dhabi).
0.0 0.2 0.4 0.6 0.8 1.0 1.2 1.4 0.0 0.2 0.4 0.6 0.8 1.0 1.2 1.4
Figure 1. Price-to-Income Ratios
Index, Jun 2008=100
Dubai Abu Dhabi
0.6 0.7 0.8 0.9 1.0 1.1 1.2 1.3 1.4 0.6 0.7 0.8 0.9 1.0 1.1 1.2 1.3 1.4
Figure 2. Price-to-Rent Ratios
Index, Jun 2008=100
6. Dubai is now more resilient to exogenous shocks than before the 2008 real estate collapse:3
The construction sector’s share in Dubai’s economy is much lower today than it was six years ago: about 8 percent in 2013 versus about 14 percent in 2008. Economic growth has become more broad-based compared to 2008, when construction was an important driver of growth. Figure 3 demonstrates how the total value of all projects in the United Arab Emirates declined from its peak six years ago. With a lower share of construction in the economy, the scale by which the sector would affect overall economic activity has also reduced.
The banking system is more sound and liquid than in 2008: then, the banking system was more vulnerable to global shocks because of the rapid increase in foreign liabilities (growing by about 90 percent annually in 2005–07 compared to an average 20 percent in 2012–13) and the
unsustainable credit growth (growth in total credit to the economy was more than 40 percent annually in 2005–08 compared to an average 7 percent in 2012–13).
Progress has been made in deleveraging, debt restructuring, and extending debt maturities. With the debt restructuring of Dubai Group in January ($10 billion), reportedly at a large NPV haircut for creditors, the last major restructuring from the 2008/9 crisis has been completed. In addition, $20 billion in Dubai government debt to the Central Bank of the United Arab Emirates (CBU) and Abu Dhabi, falling due this year, was rolled over at reduced interest rates. Nakheel has begun to prepay bank debt due in 2014. Dubai World has stepped up asset sales (sometimes to other GREs) to raise cash and repay debt under its debt restructuring agreement, though markets continue to monitor Dubai World’s capacity to make forthcoming repayments.
7. Despite the stronger resilience to exogenous shocks, improved market fundamentals, and returned confidence, potential large-scale speculative demand in the residential segment of Dubai’s real estate market could have strong negative impact. Sizable price increases may have inevitably invited some flipping activity, but so far it does not appear to be on the same scale as before the 2008 collapse, as anecdotal evidence suggests. Most new projects are currently being
3 For more details, see “Dubai Property – Why Things Look Differently Now, and Why There’s Little Room for
Complacency”, Citi (February 2014).
0 200 400 600 800 1000 1200 1400 0 200 400 600 800 1000 1200 1400
Mar-07 Mar-08 Mar-09 Mar-10 Mar-11 Mar-12 Mar-13
Figure 3. UAE Projects' Value (US$ billion)
launched by solid large-scale developers (before the 2008 collapse, more smaller-scale developers were involved), which plan to keep supply in line with expected demand; however, if demand becomes inflated by speculation, developers could again respond with expanding supply. Inflated demand and oversupply could then prove to be key ingredients for an eventual disruptive
correction.
8. Recognizing this risk, the authorities have introduced a number of measures to help reduce speculative demand.
The recent increase in real estate registration fees from 2 percent to 4 percent was an important step to curb flipping.
Developers are now required to have 100 percent ownership of their land and hold 20 percent of the construction cost in a special escrow account. Some developers have also introduced self-imposed measures for some projects, including banning resale of unfinished properties before 40 percent of the property’s value is paid.
All real estate transactions must be registered with the Dubai Land Department (Notary Public can no longer issue Power of Attorney for conducting a real estate transaction 4).
The CBU has introduced macroprudential regulations that could help further strengthen the resilience of the banking system and contain credit-financed speculative demand: (i) limiting loan-to-value (LTV) ratios for mortgages (to between 60 percent and 80 percent, depending on value and nationality; and 50 percent for off-plan properties); (ii) limiting borrowers’ debt-service-to-income (DTI) ratios to 50 percent, and (iii) restricting bank lending to Emirate governments and GREs (banks will not be able to lend more than 25 percent of their capital to a non-commercial GRE and more than 100 percent of their capital to all GREs and Emirate governments).
9. The Dubai authorities are completing a review of the off-plan transaction market, and will issue additional regulations, which could slow down real estate sector price growth, in the coming months. The introduction of an additional real estate fee for off-plan transactions is under consideration. In addition, the Dubai authorities are expected to introduce new, simpler, contract forms for real estate transactions, and to issue the Dubai real estate investor law that will protect the rights of buyers and sellers. To bring a comprehensive overview on price movements in the Dubai residential market, the development of a residential price index is being considered.
International experience
10. Hong Kong, Korea, and Singapore also experiencedrapid growth in residential sales prices, as does Dubai now. Figure
4 compares Dubai’s residential sales’ price index with that of Hong Kong, Korea, and Singapore. The latter countries experienced strong acceleration in sales prices from mid-2009: Singapore saw this acceleration until end-2010, and Hong Kong and Korea until mid- to end-2011. Since then, with the introduction of timely measures, residential sales prices have stabilized in Hong Kong and Singapore, while in Korea, real estate prices experienced volatility but were on a declining trend until mid-2013, and have stabilized since then.
11. These and some other countries can present useful knowledge in containing real estate price pressure and/or protecting their banking systems from the busts:
Main measures included the following (see Annex 2 for more details): (i) raising stamp duties (especially for properties re-sold within a short period of time); (ii) tightening LTV and DTI limits; (iii) introducing real estate exposure limits; ( (iv) raising risk weights on housing and consumer loans; (v) increasing general provisions; and (vi) increasing land supply.
The measures that appeared most effective in containing house price growth were often increases in the stamp duty (e.g., Singapore). LTV and DTI limits also seemed to be effective to some extent, albeit short-lived in many cases. More broadly, macroprudential measures, while helping to some extent to reduce price pressures in the real estate markets, were more effective in mitigating risks to the banking system, as was the main intention of some of the countries considered above (e.g. in India).
Both stamp duties and macroprudential measures were often tightened repeatedly as price pressures intensified, reflecting the fact that it is difficult ex ante to gauge the precise effect of such measures or the extent of price pressures in the real estate market.
0 20 40 60 80 100 120 140 160 0 20 40 60 80 100 120 140 160 Jun -0 8 Se p-08 De c-08 Ma r-09 Jun -0 9 Se p-09 De c-09 Ma r-10 Jun -1 0 Se p-10 De c-10 Ma r-11 Jun -1 1 Se p-11 De c-11 Ma r-12 Jun -1 2 Se p-12 De c-12 Ma r-13 Jun -1 3 Se p-13 De c-13 Ma r-14
Figure 4. Residential Real Estate Price Index (Jun. 2008=100)
Singapore (prime), JLL Hong Kong, JLL Dubai, Average 1/
Korea (overall real estate), Colliers Int.
Sources: Colliers International; JLL, National Bank of Abu Dhabi; Reidin; and IMF staff calculations.
1/ Average of Colliers International, National Bank of Abu Dhabi, and Reidin residential sales indices.
Policy recommendations
12. More measures from the real estate fee and macroprudential toolkits may need to be taken to contain speculative real estate demand and support stability in the banking system.
The empirical evidence on the effectiveness of these measures is mixed. Some countries were successful in preventing the boom by applying such measures (e.g., Singapore). Other countries could not stop the boom, but they strengthened their banking systems for the bust (e.g., Hong Kong, Korea, India).
Real estate transaction fees can be useful for real estate markets that are largely based on cash transactions, as is the case in the United Arab Emirates (an estimated 70-80 percent of all real estate transactions are done in cash, that is, out of the purchasers’ own resources or financed from abroad). A large general increase in transaction fees is not advisable because it would tend to discourage not only speculative but also real demand. Real estate transaction fees could be raised substantially for properties re-sold within a short time of purchase (as was done in Hong Kong and Singapore), and left unchanged for all other transactions. In addition, imposing differentiated fees for reselling off-plan properties, as currently under consideration, could help further discourage speculative demand without suppresing “healthy” growth. Real estate transaction fees can be considered an effective tool in containing speculative demand in the Untied Arab Emirates environment.
Limits on LTV and DTI can reduce the pressure on real estate prices by limiting credit-financed speculation, and reduce the degree of exposure of the banking sector, thereby protecting it from a potentially large correction. These measures have been introduced in the United Arab Emirates, but could be tightened more as per international experience (as discussed above), particularly if the pace of price increases remains very high and if real estate lending picks up more strongly. The effectiveness of the measures in addressing speculation, is limited, however, in countries like the United Arab Emirates, where real estate transactions are mostly conducted in cash. There are also implementation challenges that include potential circumvention practices: for LTV, e.g., extending personal loans to meet the required downpayment, and shifting risks to outside the regulatory coverage by expanding credit by non-banks; for DTI, not reporting all outstanding debt obligations.
Higher capital requirements/risk weights linked to real estate price dynamics could also help protect the banking system from a potentially large correction. Emirati banks could build buffers against losses during busts, if they hold more capital for real estate loans during booms. With the higher cost of credit, demand and real estate prices could be contained. This measure will not be fully effective if bank capital ratios are higher than the regulatory minimums (in the United Arab Emirates, banks’ capital levels are at 15–20 percent, while the regulatory minimum is at 12 percent), it would still likely raise the interest that banks charge for these exposures, because more capital would be tied up. In the same vein, although this measure will not be fully effective in stopping the boom if real estate transactions are mostly conducted in cash, higher risk weights
C. World Expo 2020 in Dubai: Impact and Key Lessons
13. Hosting a global-scale event may offer direct and indirect economic benefits. Among the direct benefits is infrastructure construction that leads to improved road and rail systems and thereby reduces transportation costs and improves productivity. Another direct benefit comes from increased spending from tourists visiting the event. Indirect benefits include strengthening the country’s image, which could lead to more tourists and businesses attracted to the country.5 14. Potential downside risks may also be present. These include possible distortions to macroeconomic stability, brought about by possible cost overruns. Higher-than-expected costs and potential oversupply of property are also important risks to consider. In addition, a buildup of debt could affect the stability of the financial sector and reduce the resilience of the overall economy to shocks.
Experience from Expos and other global events
15. International experience from global events such as World Expos, Olympic Games, and World Cup tournaments is mixed (see Annex 3). Historical evidence on the economic impact of hosting the World Expos suggests that in some countries the impact on growth was substantial, but cost overruns were large too; in other countries, the impact on growth was insignificant.
International experience from Olympic Games also point to a large risk of substantial cost overruns and public debt. Experience from some soccer World Cup tournaments suggests that the effects on the economy from tourism and consumption were small, while cost overruns were significant. In some countries that hosted global events, growth slowed down somewhat in the year after the event.
Potential impact on the Dubai economy
16. Preliminary estimates are that the Expo 2020 will boost Dubai’s economic growth, create jobs, and support bank lending in the medium term:6
The main impact in the short and long term would come from reinforcing the trend of returning confidence to the economy.
Supported by the Expo and increased investor confidence accompanying the event, growth is expected at 5.5 percent on average in 2014–19 and 8 percent in 2020, the year of the event (Figure 5). Without the Expo, growth would average about 5 percent in 2014–20. With the Expo to be located near Jebel Ali, relatively close to Abu Dhabi, positive effects on growth are also expected in Abu Dhabi
during the Expo period (other emirates are also expected to gain from the event). Tourism, trade, transport, travel,
construction, and the financial sector are envisaged to be the drivers of growth. Additional infrastructure can bring benefits in terms of higher productivity as improved transport facilities would increase the turnover of
passengers and freight. The Expo can also result in strengthened human capital with skills gained from managing a mega event. In 2021, following the Expo, growth is expected to decline from the 2020 peak, broadly in line with international experience. The decline would constitute a return to its long-term sustained growth of about 5-6 percent annually.
The Dubai Expo Committee estimates that 25 million people will attend the Expo between October 2020 and April 2021. According to the report by Oxford Economics, commissioned by the Expo bid committee, the number of jobs created in the economy by hosting the World Expo would be 277,000. About 250,000 would be created during 2014–21 and the rest in the following three years. Out of the total number of jobs, 40 percent are expected to be created in the tourism sector (hotels, restaurants), 30 percent in transport and logistics, retail and business services, and the rest in construction.
6 See “Dubai – Gearing Up for 2020,” Barclays, November 2013; and “Expo 2020: Icing on the Cake,” Emirates NBD,
November 2013. 3.5 4.0 4.5 5.0 5.5 6.0 6.5 3.5 4.0 4.5 5.0 5.5 6.0 6.5 2014 2015 2016 2017 2018 2019
Figure 5. Dubai Real GDP Growth (Percent)
With Expo 2020 Without Expo 2020
The Expo is also expected to create lending opportunities for banks, which are envisaged to benefit from lending to the government (although lending to the government is now subject to the recently introduced concentration limits). In addition, lending is also anticipated to increase from improved sentiment and confidence that the Expo is likely to generate. 17. Government capital expenditure is projected to double by 2019 on account of Expo-related spending, but fiscal balances are still expected to be in surplus:
The authorities are expected to spend USD 8 billion for the Expo-related preparations, including extending Dubai’s metro and road infrastructure. Under the staff’s scenario, one fifth of this amount would be
disbursed by end-2016 and the rest in 2017–19 (Figure 6). The scenario also assumes a slight increase in government revenues—customs fees, income taxes, and non-tax revenues such as fees and charges—on the back of buoyant economic activity that is anticipated with Expo 2020. Fees and charges are also expected to increase
(also in 2014 on account of a recently introduced increase in real estate fees).
Dubai’s fiscal surpluses are projected to be smaller than without the Expo. This is based on the assumption that current spending growth will not be directly affected by Expo-related activities. In case government revenues increase more slowly than projected, there could be fiscal deficits in some years.
18. GREs and the private sector are also expected to finance Expo-related and other large-scale activities, which could spur a risk of overheating and an increase in already high debt.
Risk of excess acceleration of projects. Estimates are that there would be USD 10 billion of GRE and private sector spending to cover Expo-related costs (HSBC), but total investment may exceed this estimate. The Expo, with its anticipated spike in demand, could accelerate the implementation of Dubai megaprojects.
Risk of overheating and construction cost inflation.The extra demand generated in the infrastructure sector could spur risks of overheating and pressures on supply chains, driving up the cost of raw materials, and fueling real estate risks. The risk of the rising cost of raw materials is especially acute, given that another global-scale event, the FIFA World Cup, will take place in neighboring Qatar in 2022.
0.0 0.5 1.0 1.5 2.0 2.5 3.0 3.5 4.0 0.0 0.5 1.0 1.5 2.0 2.5 3.0 3.5 4.0 2014 2015 2016 2017 2018 2019
Figure 6. Dubai Government Capital Spending (Percent of Dubai GDP)
With Expo 2020 Without Expo 2020
Financial sector and debt-related risks. In case GREs bear large-scale financial risks related to the implementation of these projects, and particularly if the implementation of planned megaprojects accelerates in the advent of the Expo, this could undermine the deleveraging of GREs and, ultimately, their financial health. With banks significantly exposed to GRE risk, this could ultimately also affect financial stability.
Key lessons for Dubai
19. With its well-established status as a hub for regional tourism and well-developed related infrastructure, Dubai can benefit substantially from hosting the Expo 2020, but careful macroeconomic management and appropriate strategic planning are essential:
Whether the economy benefits significantly from the Expo depends on a fiscally responsible and sustainable manner of financing related spending, which should be carefully managed and be part of Dubai’s economic development strategy. GREs’ borrowing to finance Expo-related and other large-scale activities should therefore be contained to avoid a renewed buildup of contingent liabilities, while the continued proactive focus of impaired GREs on upcoming debt maturities should be encouraged.
The government will need to ensure that investment projects continue to be implemented in line with projected demand. This could be done by putting in place a mechanism for top-down assessment of planned supply versus demand.
In the context of the authorities’ forthcoming Expo master plan, a sound feasibility study needs to be prepared that would clearly state the allocation of resources throughout the planning and construction periods and maintaining cash flow during operations.7 This feasibility study should also have a clear vision for the post-event period—specifying the intended use of the Expo territory/buildings and other infrastructure after the event. This would help mitigate risks of excess infrastructure and tourist accommodation oversupply after the event, by better matching the level of development to the scale of the Expo. Appropriate monitoring and evaluation systems are needed to ensure timely assessments of
the process and, if required, applications of corrective measures.
Iinternational experience points to a risk of cost overruns and financial losses in hosting global events and thus suggests that a continued focus on strengthening Dubai’s public finances is warranted, with a view to increasing the emirate’s financial resilience to such potential shocks.
D. Conclusions
20. The strong recovery in the real estate market in Dubai requires close monitoring and further measures to discourage speculative demand. The residential and hospitality segments have seen buoyant growth (although the momentum seems to have slowed in recent months), while growth in the commercial segments (excluding hospitality) has been slower. Dubai’s economy is now more resilient to exogenous shocks; however, speculation in the residential segment of the Dubai’s real estate market may still return at a significant scale. A number of measures that are expected to help reduce flipping activity have already been introduced. More measures from the macroprudential and fiscal toolkit for containing real estate booms may be needed, particularly if signs of flipping activity emerge strongly.
21. Hosting a global-scale event may offer direct and indirect economic benefits, but it can also present risks. With its established status as a hub of regional tourism and well-developed infrastructure, the economy of Dubai (and of the United Arab Emirates) economy can benefit substantially from hosting the Expo 2020. Careful macroeconomic management and appropriate strategic planning measures will be essential to minimize cost overruns, avoid
overheating, and limit real estate risks. These measures include preparing a sound feasibility study linked to the post-event period, developing realistic demand projections, financing the Expo and other project-related spending in a fiscally sustainable manner, and continuing to strengthen Dubai’s public finances to increase buffers for possible cost overruns and losses.
Appendix 1. Recent Developments in the United Arab
Emirates’ Real Estate Market
The residential segment of the real estate market has recovered strongly in Dubai. With the return of confidence to the real estate market, helped by a successful bid for Expo 2020, residential property prices in Dubai have been increasing at a fast pace. Growth in sales’ prices in Dubai’s residential segment reached double digits y-o-y starting from the second half of 2012 and accelerated substantially at more than 20 percent y-o-y between the second half of 2013 and the beginning of 2014 (Figures 1, 2). 1 While the momentum of price increases appears to have slowed somewhat in recent months, sales prices nonetheless increased 27 percent y-o-y in May 2014 (according to Dubai Land Department data). The index that averages indices of Dubai’s residential sales’ prices from various sources suggests that prices have not yet reached their peak level.
1 Several different sources were used for analyzing price developments in Abu Dhabi and Dubai’s residential
segments (sales and rents): Colliers International, Dubai Land Department, JLL, National Bank of Abu Dhabi (NBAD) and Reidin. -60 -40 -20 0 20 40 60 -60 -40 -20 0 20 40 60 Jul -0 9 Se p-09 No v-09 Ja n-1 0 Ma r-10 Ma y-10 Jul -1 0 Se p-10 No v-10 Ja n-1 1 Ma r-11 Ma y-11 Jul -1 1 Se p-11 No v-11 Ja n-1 2 Ma r-12 Ma y-1 2 Jul -1 2 Se p-12 No v-12 Ja n-1 3 Ma r-13 Ma y-13 Jul -1 3 Se p-13 No v-13 Ja n-1 4 Ma r-14 Ma y-14
Figure 1. Dubai Residential Real Estate Sales' Price Growth
(Y-o-y percent change)
Reidin NBAD
Colliers International Dubai Land Department (appartments sales' transactions) 0 20 40 60 80 100 120 140 160 180 0 20 40 60 80 100 120 140 160 180 Ju n-0 8 Se p-08 De c-08 Ma r-09 Ju n-0 9 Se p-09 De c-09 Ma r-10 Ju n-1 0 Se p-10 De c-10 Ma r-11 Ju n-1 1 Se p-11 De c-11 Ma r-12 Ju n-1 2 Se p-12 De c-12 Ma r-13 Ju n-1 3 Se p-13 De c-13 Ma r-14
Figure 2. Dubai Residential Real Estate Sales Price Index
(Jun. 2008=100)
Reidin NBAD
Colliers International
Average Residentail Sales Price Index 1/
The transaction size and value in the overall real estate market, including residential and commercial segments, were growing quickly during 2012–13. According to the Dubai Land Department, the value of all transactions in
the Dubai real estate market increased by about 72 percent on average in 2013 (Figure 3), driven by a rise of 50 percent in the volume of transactions . The average transaction value is still well below levels seen at the last peak: in 2008, the average transaction value was AED 5.6 million, while in 2013 it amounted to AED 2.5 million. Transactions in the residential market (both value and volume) increased substantially in September/October 2013, and then slowed down, possibly reflecting in part the increase in property registration fees from 2 percent to 4 percent.
The recovery in Abu Dhabi’s residential market started later than in Dubai. Sales prices started to grow in the beginning of 2013: growth reached about 20 percent in December 2013 y-o-y and stayed at this level through March 2014 (with the price level below its peak levels, Figures 4, 5).2 This strong growth has been supported by strong economic fundamentals (including high levels of job security and confidence).
2 According to the index that averages the indices from JLL, NBAD, and Reidin.
0 1 2 3 4 5 6 7 8 0 2 4 6 8 10 12 14 16 18 Ma r-08 Jun-08 Se p-08 De c-08 Ma r-09 Jun-09 Se p-09 De c-09 Ma r-10 Jun-10 Se p-10 De c-10 Ma r-11 Jun-11 Se p-11 De c-11 Ma r-12 Jun-12 Se p-12 De c-12 Ma r-13 Jun-13 Se p-13 De c-13 Th ou sa nd s
Figure 3. Dubai Real Estate Market Transactions, 2008–13
Transactions' volume (RHS)
Transactions' value, AED bln
Sources: Dubai Land Department.
-60 -40 -20 0 20 40 60 -60 -40 -20 0 20 40 60 De c-09 Ma r-10 Jun-10 Sep -1 0 De c-10 Ma r-11 Jun-11 Sep -1 1 De c-11 Ma r-12 Jun-12 Sep -1 2 De c-12 Ma r-13 Jun-13 Sep -1 3 De c-13 Ma r-14 Reidin NBAD JLL
Figure 4. Abu Dhabi Residential Real Estate Sales' Price Growth (Y-o-y percent change)
0 20 40 60 80 100 120 0 20 40 60 80 100 120 De c-08 Ma r-09 Jun-09 Se p-09 De c-09 Ma r-10 Jun-10 Se p-10 De c-10 Ma r-11 Jun-11 Se p-11 De c-11 Ma r-12 Jun-12 Se p-12 De c-12 Ma r-13 Jun-13 Se p-13 De c-13 Ma r-14
Figure 5. Abu Dhabi Residential Real Estate Sales' Price (Dec. 2008=100)
Reidin NBAD JLL
Average Index 1/
Sources: Colliers International; JLL, National Bank of Abu Dhabi; Reidin; and IMF staff calculations. 1/ Average of JLL, National Bank of Abu Dhabi, and Reidin residential sales indices.
Similar trends can be seen in residential rents. In Dubai, rental growth in the residential segment was increasing from end-2012, reaching from 24 percent y-o-y according to Reidin to 33 percent according to NBAD in March 2014 (rents are, so far, below their 2008 peak, Figures 6, 7). According to the Dubai Land Department, a pick-up in residential rent prices in some areas of Dubai has been significantly slower (Figure 8).3 The rental yield has been slowly declining, because of higher growth
in sales prices compared to rent prices. A recent regulation that was issued to allow landlords in Dubai to increase rents by up to 20 percent, if rents are below the market value of that area by 11 percent, constitutes a loosening of previous rent ceiling regulation and could lead to accelerating rents in some areas.4 In Abu Dhabi, rents in the residential segment started growing only in the
second half of 2013. In March 2014, rent prices increased between 4 percent y-o-y (Reidin) and 12 percent (JLL) (Figures 9, 10). As a result of the slower growth, rents in Abu Dhabi remain well below their peak levels. The rental yield has been broadly stable. The recent removal of the 5 percent rent, cap together with the new requirement for public sector employees to reside in Abu Dhabi, is expected to put upward pressure on rents.
3 Rent prices cover three-bedroom apartments in Bur Dubai and Deira.
-50 -40 -30 -20 -10 0 10 20 30 40 -50 -40 -30 -20 -10 0 10 20 30 40 Se p-0 9 Dec -0 9 Ma r-10 Jun-10 Se p-1 0 Dec -1 0 Ma r-11 Jun-11 Se p-1 1 Dec -1 1 Ma r-12 Jun-12 Se p-1 2 Dec -1 2 Ma r-13 Jun-13 Se p-1 3 Dec -1 3 Ma r-14 NBAD Reidin
Figure 6. Dubai Residential Real Estate Rents' Price Growth
(Y-o-y percent change)
0 1 2 3 4 5 6 7 8 9 10 0 20 40 60 80 100 120 Dec -0 8 Ma r-09 Jun-09 Se p-0 9 Dec -0 9 Ma r-10 Jun-10 Se p-1 0 Dec -1 0 Ma r-11 Jun-11 Se p-1 1 Dec -1 1 Ma r-12 Jun-12 Se p-1 2 Dec -1 2 Ma r-13 Jun-13 Se p-1 3 Dec -1 3 Ma r-14 Reidin, Dec 2008=100 NBAD, Dec 2008=100 Average index, Dec=100 1/
Residentail Rental Yield, in percent (RHS) 2/
0 50 100 150 200 250 300 350 400 0 50 100 150 200 250 300 350 400 Au g-08 Au g-09 Ja n-10 Au g-10 Ja n-11 Ma y-11 Se p-11 Ja n-12 Ju n-12 Ja n-13 Ma y-13 Se p-13 Ja n-14
Figure 8. Dubai Real Estate Rents (AED per Sq. Ft.)
3-bedroom appartments in Deira 3-bedroom appartments in Bur Dubai Retail (main roads) in Bur Dubai Offices in Bur Dubai
-50 -40 -30 -20 -10 0 10 20 30 40 -50 -40 -30 -20 -10 0 10 20 30 40 Dec -0 9 Ma r-10 Jun-10 Se p-1 0 Dec -1 0 Ma r-11 Jun-11 Se p-1 1 Dec -1 1 Ma r-12 Jun-12 Se p-1 2 Dec -1 2 Ma r-13 Jun-13 Se p-1 3 Dec -1 3 Ma r-14 Reidin JLL
Figure 9. Abu Dhabi Residential Real Estate
0 1 2 3 4 5 6 7 8 9 10 0 20 40 60 80 100 120 Dec -0 8 Ma r-09 Jun-09 Se p-0 9 Dec -0 9 Ma r-10 Jun-10 Se p-1 0 Dec -1 0 Ma r-11 Jun-11 Se p-1 1 Dec -1 1 Ma r-12 Jun-12 Se p-1 2 Dec -1 2 Ma r-13 Jun-13 Se p-1 3 Dec -1 3 Ma r-14 Reidin, Dec 2008=100 JLL (two-bedrooms), Dec 2008=100 Residentail Rental Yield, in percent (RHS) 3/
Figure 10. Abu Dhabi Residential Real Estate Rents
Sources: National Bank of Abu Dhabi; Dubai Land Department; JLL; Reidin; and IMF staff calculations. 1/ Average of National Bank of Abu Dhabi and Reidin residential rental indices.
2/ Rental yield is calculated using data from National Bank of Abu Dhabi and Reidin. 3/ Rental yield is calculated using data from JLL and Reidin.
The commercial segment has also been recovering in Dubai, and more modestly in Abu Dhabi (Figures 11, 12).5
The buoyant retail and hotels segments have seen lower vacancy rates in Q4 2013 (12 percent and 20 percent, respectively). Rents in the retail sector were broadly stable in 2013. Average daily hotel rates increased by about 5 percent in 2013, supported by a 11 percent increase in tourists visiting Dubai (the number is estimated to have exceeded 11 million).6 In the office segment,
rental growth has been slower and the vacancy rate remained high at 29 percent—the existing supply remains large, while demand comes mostly from prime locations. The supply in these segments is projected to increase modestly in the coming years (also on account of the Expo 2020 preparations).
In Abu Dhabi, rental growth in the commercial segments has been more sluggish because large oversupply still exceeds the growing but still limited demand. The vacancy rate in the office segment increased to 39 percent in Q4 2013, and office rents in prime locations have been stable.7 The vacancy rate in the hotel segment declined slightly by end-2013, but still remain high at 33 percent. Average daily rates declined by 2 percent. The retail segment has fared better, helped by strong demand from the resident population, with the vacancy rate at 2 percent and rents stable. Large expected supply in 2014 may put some downward pressure on rents in the commercial segments.
5 For more details see JLL reports.
6 According to the press release of the Department of Tourism and Commerce Marketing in Dubai. 7 Office rents in secondary locations declined by 9 percent in 2013.
0 5 10 15 20 25 0 5 10 15 20 25 2011 2012 2013 2014 2015 Office Residental Retail Hotel
Figure 11. Dubai: Real Estate Supply (Annual percent change)
0 5 10 15 20 25 0 5 10 15 20 25 2011 2012 2013 2014 2015 Office Residental Retail Hotel
Figure 12. Abu Dhabi: Real Estate Supply (Annual percent change)
Appendix 2. Containing real estate booms: the cases of Hong
Kong, India, Korea, and Singapore
1Hong Kong (1990s)
In Hong Kong, two periods are worth examining: the 1990s and 2000s.
In the 1990s, real estate prices were rising, accelerating by 1993; mortgage loans increased substantially in terms of GDP. In 1991, the LTV limit was reduced from 80 percent to 70 percent. As price growth increased, additional measures were introduced in 1994: real estate exposure limits of 40 percent of total loan portfolio and a ceiling of 15 percent per annum on mortgage lending growth. In 1997, the LTV limit was reduced to 60 percent for luxury residences. The exposure limit of 40 percent was abolished in July 1998, after the market plunged.
Hong Kong (2000s)
After the boom-bust between 1995 and 2003, real estate prices were growing modestly until 2007, but then growth accelerated. During the 2008 world economic crisis, prices dropped significantly, but then quickly recovered. Since September 2009, several measures have been made to tighten loan eligibility criteria. The maximum LTV for properties with a value of HK$20 million or more was reduced to from 70 percent to 60 percent. In August 2010, the limit was extended to properties valued at or above HK$12 million and to non-primary residence loans by the placement of a loan cap of HK$7.2 million on mortgages subject to the 70 percent LTV guideline. Also, the DSTI limit was standardized at 50 percent from the previous 'range' of 50–60 percent. The stamp duty was raised from 3.75 percent to 4.25 percent on transactions above HK$20 million. In August 2010, the government announced plans to increase land supply. In November 2010, to further discourage speculators, stamp duty was increased to 15 percent for properties re-sold within six months of purchase and LTV limits were tightened to 50–70 percent, depending on the type of properties—from below HKD 8 million to above HKD 12 million. Growth in prices continued until late 2011 and have stabilized since then. While the stamp duty increase led to some decline in price growth, there is not much evidence that the measures overall were very effective in containing price growth, which was rising again after some short-term declines resulting from interventions. However, the Hong Kong experience suggests that macro-prudential measures in the early 2000s appeared to be effective in mitigating risks to the banking system.
1 Source: “How to Deal with Real Estate Booms: Lessons from Country Experiences”, C. Crowe, G. Dell’ Ariccia, D. Igan,
India
In India, a real estate boom developed on the back of strong economic growth and soaring construction. Demand was still stronger than supply because infrastructure was still inedaqaute, while planning and land-use laws were ineffecient. Residential property prices increased by more than 20 percent from 2002 to 2005, while commercial rents saw even steeper hikes. Housing loans and consumer credit increased substantially. The following measures were introduced. Risk weights on housing and consumer loans were increased as follows: to 50 percent both in October 2004, and to 75 percent for housing loans, to 125 percent for consumer credit and commercial real estate exposure in July 2005. General provisions for standard assets were increased across the board from 0.25 percent to 0.4 percent in October 2005 (further increased to 1 percent in April 2006 and to 2 percent in January 2007) and the risk weight on commercial real estate exposure was further increased to 150 percent in May 2006. In 2007, risk weights and general provisions on exposure to systemically important non-deposit-taking financial companies were increased from 100 percent to 125 percent and from 0.4 percent to 2 percent, respectively. Cash reserve requirements were increased gradually from 4.5 percent to 6 percent by 2007. In
November 2010, additional measures included a mandatory ceiling of 80 percent on LTVs for residential real estate loans and an increase in the risk weights of housing loans above Rs.75 lakh to 125 percent (irrespective of the LTV). The authorities’ main intention was to prepare the banking system for bust, rather than to attempt stopping the boom. Following the bust, the banking system appeared to be generally sound indeed.
Korea
In Korea, following the Asian crisis, expansionary policies resulted in a credit boom that went to bust in 2003. House prices increased by about 30 percent in real terms between 2001 and 2003. Another period of house price increases occurred between 2005 and 2007 (prices grew by 15 percent). Maximum LTV limits were introduced in 2002 and maximum DTI limits in 2005. LTV limits were lowered in speculative areas twice in 2003, first to 50 percent and then to 40 percent down from 60 percent. The LTV reduction was expanded to loans made by non-bank
intermediaries bringing the ratio from 60–70 percent to 50 percent. DTI limits in speculative areas were reduced to 40 percent. LTV limits were reduced in 2009 in non-speculative areas as well. DTI limits were tightened twice in 2007 and 2009. The LTV and DTI limits seemed to be effective, but the impact did not appear to last long; therefore, the measures had to be tightened repeatedly. Because the limits were already very low, limited room remained for further interventions. Also, calibrating these tools proved difficult: the DTI tightening appeared to to be too strong
Singapore
In Singapore, real estate cycles have also been significant. House prices increased by 45 percent in real terms between 2004 and 2008. During the 2008 global economic crisis, prices declined only modestly, by 4 percent. Following the crisis, house prices rose more than 30 percent by mid-2010, and have stabilized since then. The authorities’ measures included LTV limits that were repeatedly reduced (differentiating between individuals and non-individuals): LTV limit was initially reduced from 90 percent to 80 percent, then to 70 percent for second and subsequent mortgages, and then to 60 percent for individuals with one or more outstanding housing loans at the time of the new purchase and to 50 percent for purchases that are not individuals. A seller's stamp duty on all residential land and properties sold within one year of purchase was introduced in February 2010, and later in the year the holding period for stamp duty was extended to three years. In January 2011, Seller's Stamp Duty was increased and the holding period for its
imposition was raised from three to four years; in January 2013, Additional Buyer’s Stamp Duty was raised for all types of buyers except citizens purchasing their first property (Tables 1, 2). The supply of properties was increased and the completion time of build-to-order apartments was shortened. The measures seemed to be effective; property sales and price growth declined. At the same time, prices for single-family houses continued to rise, indicating the likely continuation of speculative activity.
Table 1. Seller’s Stamp Duty (SSD) for Residential Properties
Date of purchase
Holding period
Rates
14 January 2011 to
present
Within 1 year
16%
1 to 2 years
12%
2 to 3 years
8%
3 to 4 years
4%
More than 4 years
0
Table 2. Buyer’s Stamp Duty (BSD) and Additional Buyer’s Stamp Duty (ABSD) for Residential Properties in Singapore
Profile of buyer ABSD rates
Dec 2011 - Jan 2013
ABSD rates Jan 2013 to present Foreigner and entity buying any
residential property 10% 15%
Singapore Permanent Resident
buying 1st residential property 0 5%
Singapore Permanent Resident buying 2nd and subsequent residential property
3% 10%
Singapore Citizen buying 1st
residential property 0% 0%
Singapore Citizen buying 2nd
residential property 0% 7%
Singapore Citizen buying 3rd and
subsequent residential property 3% 10%
Source: Inland Revenue Authority of Singapore.
Appendix 3. International Experience with Hosting Global
Events
Historical evidence on the economic impact of hosting World Expos is mixed:
Expo 2010 in Shanghai generated up to USD 10 billion, and the impact on growth was substantial; however, cost overruns were extensive, with the final cost of holding the fair at about USD 50 billion, higher than Beijing’s spending on the 2008 Olympics. The event also left an overhang of empty buildings that were subsequently demolished.
In Hannover 2000, impact on the city’s growth was insignificant because investments were mostly focused on the fair itself (the infrastructure was already well developed). Only about half of the expected 40 million visitors attended, resulting in losses of USD600 million.
The 2005 Aichi Expo in Japan was attended by 22 million visitors, but generated only USD122 million.
Some World Expos left a highly positive legacy, which was little in direct economic terms, but indirectly benefitted the countries and their populations. The examples include the Eiffel Tower in Paris (1889); the Palace of Fine Arts in San Francisco (1915); a city park in Spokane, Washington (1974); the Science City research and development park in Tsukuba, Japan (1985); and the South Bank Parklands in Brisbane, Australia (1988).
International experience from the Olympic Games also points to a large risk of substantial cost overruns and public debt:1
In the 1976 Olympic Games in Montreal, the projected cost of the event was USD 124 million, but the actual cost was much higher, leaving Montreal with a debt of USD 2.8 billion (it took many years to repay the debt).
Los Angeles generated surplus during the Olympics in 1984 because the city did not spend much on construction. Moreover, the bulk of financing was borne by the private sector, an experience that was difficult to repeat in subsequent games.
The Barcelona Olympics in 1992 resulted in a USD 4 billion debt for the central government, and an additional USD 2.1 billion debt for the local governments.
The 1998 Nagano Games in Japan also left the various levels of the government USD 11 billion in debts because of higher spending.
1 See “Is It Worth It?” Finance and Development, March 2010; and “The economic impact of the Olympic Games”,
The 2004 Olympic Games in Athens had initial cost estimates of USD 1.6 billion. Actual cost reached 10 times that amount.
Beijing projected costs of USD 1.6 billion for the Olympics in 2008, but the final cost reached USD 40 billion.
The 2014 Games in Sochi, Russia, were budgeted at USD 12 billion; the preliminary cost as of October 2013 was USD 51 billion, with most of the amount financed by the public sector.
Experience from some soccer World Cups suggests that the effects on the economy from tourism and consumption can be small, with significant cost overruns taking place:
For the 1996 FIFA World Cup in France, ex ante reports had expected 500,000 tourists for the event; in fact, no increase was registered in the overall level of tourists compared to a
previous year. As a result, retail sales and consumption did not increase substantially during the event.
Economic benefits from the 2002 FIFA World Cup in South Korea were lower than expected. For the 2006 FIFA World Cup in Germany, ex-ante studies had pointed to an increase of
340,000 tourists (some studies had even indicated more than 3 million tourists); the final number was less than 100,000. As in France, retail sales and consumption in Germany did not increase sizably.
In South Africa, the 2010 FIFA World Cup was hosted with a cost substantially larger than initially planned.
In some countries that hosted global events, growth slowed down somewhat in the year after the event; in other countries growth remain unchanged (Figure 1).
By the time Barcelona was approaching the Olympics in 1992, public consumption and investment slowed. In 1993, these aggregates contracted, falling below their trends; although, the contraction was also driven by a wider economic slowdown in Europe at that time. In the aftermath of the 2000 Expo in Hannover, growth in Germany slowed, which was also driven by an exogenous factor: in 2001, economic growth slowed globally. Growth in Greece’s economy slowed after the 2004 Olympics, but was still higher than its trend. After the 2010 Expo in Shanghai, growth decelerated, also on account of unwinding fiscal stimulus and other measures aimed at cooling the housing sector.
Following the Nagano Olympics in 1998, growth was almost flat and lower than its trend, while after the 2005 Expo in Aichi, growth increased slightly, rising to a level above the trend. In 2007, the year after the FIFA World Cup, growth was almost unchanged, though above its trend. Growth in China after the 2008 Olympics, and in South Africa after the 2010 FIFA World
Figure 1. Deviations from Trend Real GDP Growth and Total Investment in the Year Following the Event
-10 -5 0 5 10 15 20 25 30 35 1980 1986 1992 1998 2004 2010 Spain (1992 Olympics) Real GDP growth Investment as percent of GDP -5 0 5 10 15 20 25 30 35 1980 1986 1992 1998 2004 2010
South Africa (2010 FIFA Cup) Real GDP growth Investment as percent of GDP Source: IMF. -10 -5 0 5 10 15 20 25 30 35 1980 1986 1992 1998 2004 2010
Japan (1998 Olympics and 2005 Expo)
Real GDP growth Investment as percent of GDP -10 -5 0 5 10 15 20 25 30 1980 1986 1992 1998 2004 2010 Real GDP growth Investment as percent of GDP
Germany (2000 Expo and 2006 FIFA Cup)
-10 -5 0 5 10 15 20 25 30 1980 1986 1992 1998 2004 2010 Greece (2004 Olympics) Real GDP growth Investment as percent of GDP 0 10 20 30 40 50 60 1980 1986 1992 1998 2004 2010
China (2008 Olympics and 2010 Expo)
Real GDP growth Investment as percent of GDP
THE EFFICIENCY OF PUBLIC SPENDING IN THE UNITED
ARAB EMIRATES
1
1. In 2014, the federal and emirate governments will together spend about
AED 350 billion, or about one quarter of the United Arab Emirates’ GDP. The spending will promote important goals such as “equal opportunity and access to first-rate education” and “long and healthy lives” for all Emiratis (United Arab Emirates’ Vision 2021). The efficiency with which this money is spent will help determine the extent to which these goals are met. Assessing and, where possible, improving the efficiency of the spending is thus of great importance.
2. This paper examines the efficiency of the United Arab Emirates’ public spending. It starts by looking at survey-based indicators of the effectiveness of government spending, and then compares outcomes such as life expectancy and school test scores with the amount that Emirati governments spend on health and education. Drawing on a regional study, it then looks in more depth at the efficiency of public investment, by (i) comparing the quality of infrastructure with spending on public works, (ii) examining scores on the Public Investment Management Index, and (iii) presenting data on the cost of constructing roads and metros. Because budgeting determines how public resources are used, the paper turns finally to an examination of the federal government’s new approach to budgeting, which aims to improve the efficiency of spending by establishing a three-year cycle, classifying spending into programs and services, and tracking performance indicators.
3. Budgeting and assessments of the efficiency of public spending confront important measurement problems. The objectives of government spending are often multidimensional and hard to specify precisely. In addition, the achievement of the government’s objectives depends on factors outside the government’s control. These problems mean that governments must allocate spending in the budget on the basis of highly imperfect information. They also make any
assessment of the efficiency of public spending necessarily provisional.
A. Overall Perception of Effectiveness
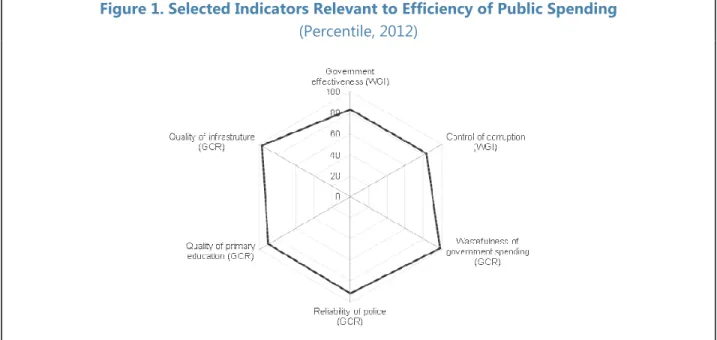
4. Surveys show that governments in the United Arab Emirates are generally perceived as effective (Figure 1). Some of the World Bank’s Worldwide Governance Indicators, which are based mainly on surveys, are relevant to the effectiveness of government spending. The 2012 results ranked the United Arab Emirates 35th and 36th, respectively, out of 215 economies for government effectiveness and the control of corruption.2 Transparency International’s 2013 Corruption
Perceptions Index also ranks the United Arab Emirates well (26th out of 177 economies). Several
1Prepared by Tim Irwin and Bahrom Shukurov under the guidance of Harald Finger and with assistance from Peter
Gruskin.
other, mainly survey-based results come from the World Economic Forum’s Global Competitiveness Report 2013–14 (World Economic Forum, 2013). This gives the United Arab Emirates high rankings for the absence of wastefulness of government spending (third best in a sample of 148 economies). The reliability of the police is rated 12th best, and quality of primary education 19th best. As detailed below, the United Arab Emirates’ infrastructure is rated fourth best in the world.
Figure 1. Selected Indicators Relevant to Efficiency of Public Spending
(Percentile, 2012)
Source: World Bank’s Governance indicators (WGI) and Global Competitiveness Report, 2013/14 (GCR).
5. Stronger evidence of efficiency requires comparisons of outcomes with spending.
Survey participants may have a good idea of the quality of government services, but they generally do not know how much the services cost to produce. High-income countries can usually provide better services whether or not they are efficient. The United Arab Emirates’ score on government effectiveness, for instance, is high relative to those of most other countries, but not especially high given the country’s per capita income (Figure 2). To evaluate efficiency, it is necessary to compare indicators of quality with information on spending.
Figure 2. Perceived Government Effectiveness and GDP Per Capita, 2013
B. Efficiency of Spending on Health and Education
6. On the face of it, public spending on education is low but efficient. A common measure of the outcome of education spending comes from Program for International Student Assessment (PISA) tests of students’ ability in reading, science, and mathematics. In the United Arab Emirates, PISA scores are a little below average. But the United Arab Emirates appears to spend very little per capita on education compared to other countries of similar incomes, and no country that spends as little as the United Arab Emirates has higher PISA scores (Figure 3, panel (a)). In this sense, the data suggest prima facie (we consider some qualifications below) that Emirati governments are efficient in producing educational outcomes, but they also raise the question of whether the United Arab Emirates is spending too little on education.
7. Public spending on health, by contrast, is relative high, but seems less efficient. The data suggest that, relative to other countries, UAE governments’ spending on health is much higher than is their spending on education. Here, however, the data suggest that there is room for
improved efficiency. Panel (b) of Figure 3 shows that, in several countries, people expect to live longer than in the United Arab Emirates even though their governments spend less.
A F G A G O A I A A L B UAE A R G A R M A T G AUS A U T A Z E B D I B E L B E N B F A B G D B G R BHR B H S B I H BLR B L Z B O L B R A BRB BRN B T N B W A C A F CAN CHE C H L C H N C I V C M R C O D C O G C O L C O M C P V C R I CYP C Z E D E U D J I D M A DNK D O M D Z A E C U E G Y E R I ESP E S T E T H FIN F J I F R A F S M GAB G B R G E O G H A G I N G M B G N B GNQ G R C G R D G T M G U Y H K G H N D H R V H T I H U N I D N I N D I R L IRN I R Q S L ISR ITA J A M J O R J P N K A Z K E N K G Z K H MK I R K N A K O R KWT L A O L B N L B R LBY L C A L K A L S O L T U LUX L V A M A R M D A M D G M D V M E X M K D M L I M L T M M R M N E M N G M O Z M R T M U S M W I MYS N A M N E R N G A N I C N L D NOR N P L NZL OMN P A K P A N P E R P H L P L W P N G POL P R T P R Y QAT R O M R U S R W A SAU S D N S E N SGP S L B S L E S L VS R B S S D S T P S U R S V K S V N S W E S W Z S Y C T C D T G O THA T J K TKM T L S O N T T O T U N T U R T U V W N T Z A U G A U K R U R Y USA U Z B V C T VEN V N M V U T W S M Y E M Z A F Z M B Z W E MHL -2.5 -2.0 -1.5 -1.0 -0.5 0.0 0.5 1.0 1.5 2.0 2.5 0 20,000 40,000 60,000 80,000 100,000 120,000
Sources: World Bank Worldwide Governance Indicators; IMF. GDP per capita (in U.S. dollars)
G ov er nm en t E ffe ct iv en es s
Figure 3. United Arab Emirates: Public Spending and Selected Outcomes in Education and Health, 2012
8. These initial comparisons are, however, far from conclusive. First, the achievement of the governments’ objectives cannot be satisfactorily summarized by a single indicator such as test scores or life expectancy. Education, for instance, is about more than teaching students to read, understand science, and solve mathematical problems. Second, the extent to which the
governments’ objectives are met depends on more than just the efficiency of public spending. Longevity, for instance, may depend on private as well as public spending on health care, and on diets, exercise, climate, and so on. For these reasons, the apparent room for improvement in the efficiency of health spending in the United Arab Emirates suggested by Figure 3(b) (above) could be an illusion. Likewise, public spending on education may be low in the United Arab Emirates per capita because many residents are immigrant workers without school-age children. Finally, there may be errors in the measurement of spending and outcomes and cross-country differences in definitions. The United Arab Emirates is only just beginning to measure consolidated government spending and classifying that spending by function, so its data need to be viewed with particular caution. In particular, some spending on education may not be classified as such.3
3The classification of the United Arab Emirates’spending by function assigns a very large share to “general public
services” (IMF, 2014, pp. 518–19), a category that may include some spending on education.
g p g
Sources: OECD for PISA scores. Public spending on education in the UAE is for 2011 and is taken from the Government Finance Statistics Yearbook 2013 (IMF, 2014, p. 519). For the UAE, the purchasing-power-parity exchange rate is the same as the actual exchange rate, according to the World Bank (http://data.worldbank.org/indicator/PA.NUS.PPPC.RF). Note: The PISA scores are unweighted average of 2012 mean scores
UAE 350 400 450 500 550 0 2000 4000 6000 8000 10000 12000 14000 PI SA sc or e
Per capita public spending on education in dollars at purchasing-power parity (a) Education UAE 40 45 50 55 60 65 70 75 80 85 0 1000 2000 3000 4000 Li fe ex pe ct an cy in ye ar s
Per capita public spending on health in dollars at purchasing-power parity
9. It is possible to mitigate some of the problems with simple comparisons. Health spending, for instance, can be compared not with life expectancy but with a measure developed by the World Health Organization of health-adjusted life expectancy (see Grigoli and Kapsoli, 2013). Substituting this measure for simple life expectancy in Figure 3(a) above also suggests that spending in the United Arab Emirates has room for improvement in efficiency. It is also possible to compare spending not with outcomes such as ability to read and solve mathematical problems, but with outputs, such as numbers of students taught. Outcomes are what ultimately matters, but outputs are what are under the government’s control. Grigoli (2014) considers spending on secondary education and secondary-school enrolments in emerging and developing economies. His data imply that public spending on secondary education per student (in contrast to total education spending per capita as shown in Figure 3(b) above) is relatively high. His results suggest that Emirati governments are more efficient in the production of schooling than most, but that more students could still be educated without increasing spending if the United Arab Emirates were fully efficient (Figures 4 and 5). As these issues suggest, a satisfactory assessment of the efficiency of spending requires an examination of the problem from many angles, including detailed public-expenditure reviews which are beyond the scope of this study.
Figure 4. Public Spending and Enrollment Rates in Secondary Schooling
UAE 0 10 20 30 40 50 60 70 80 90 100 0 1000 2000 3000 4000 5000 6000 7000 8000 Se co nd ar y-sc ho ol en ro lm en t r at e
Public spending on secondary schooling per student in PPP dollars Source: Grigoli (2014, figure 6).
Figure 5. Potential Efficiency Gains in School Enrolment
(Percentage)
0 10 20 30 40 50 60 70
Antigua & Barbuda Argentina Armenia Bahrain DominicaGrenada Kuwait Lithuania Mongolia Poland Qatar Serbia Seychelles Dominican Republic Barbados Fiji Hungary Bulgaria Latvia Jamaica Georgia CroatiaJordan St. Kitts & Nevis Chile Moldova Thailand Brazil Bolivia St. Lucia Tonga Romania Peru Indonesia Venezuela, Rep. Bol. UAE Turkey Cape Verde Uruguay Vanuatu St.Vincent & Grenadines Oman Malaysia Samoa Colombia Botswana Saudi Arabia Mauritius Tunisia Trinidad & Tobago Mexico Panama Algeria Philippines Paraguay Belize South AfricaEl Salvador Syria Bangladesh Equatorial Guinea Ecuador Ghana Nicaragua Namibia Kenya Bhutan Guatemala SwazilandLaos Morocco Malawi Mali Senegal Togo Djibouti Madagascar Eritrea Mauritania Côte d'IvoireBenin Lesotho Cambodia Burundi Uganda Burkina Faso Central African Rep. Niger Mozambique
Africa Europe
Middle East and Central Asia Asia and Pacific
Western hemisphere
C. A Closer Look at the Efficiency of Public Investment
410. As noted above, the perceived quality of United Arab Emirates’ infrastructure is high.
According to the World Economic Forum’s Global Competitiveness Indicator’s 2013/14, the United Arab Emirates’ ports are the fourth best in the world, its air transport the third best, and its roads the best. In terms of overall infrastructure quality, the United Arab Emirates compares favorably to advanced countries such as Finland, Germany, Singapore, and Switzerland, and its public capital stock is high (Figures 6, 7).
Figure 6. Global Competitiveness Indicators, 2013
(1=minimum, 7=maximum)
4 This section is based on Albino-War and others (forthcoming).
5.0 5.2 5.4 5.6 5.8 6.0 6.2 6.4 6.6 6.8 Overall Infrastructure 5.0 5.2 5.4 5.6 5.8 6.0 6.2 6.4 6.6 6.8 Roads 0.0 1.0 2.0 3.0 4.0 5.0 6.0 7.0 8.0 Port infrastructure 0.0 1.0 2.0 3.0 4.0 5.0 6.0 7.0
Figure 7. Public Capital Stocks and Quality of Overall Infrastructure, 2013
D. Efficiency Frontier Analysis
11. The efficiency of public investment can be assessed using two techniques that measure how well countries transform inputs (money) into outputs (infrastructure). Specifically,
efficiency can be measured using a Data Envelopment Analysis (DEA) and a Partial Free Disposal Hull (PFDH). The main difference between these approaches is that the DEA compares each country against a fixed country sample, whereas the PFDH makes the comparison against repeated randomized subsamples, thus reducing sensitivity to outliers (See Appendix 1 for details). In the analysis reported here, output (the quality of infrastructure) was approximated using the
infrastructure subcomponent of the Global Competitiveness Indicators, while inputs were measured as the real public capital stock per capita in PPP terms, taken from the Penn World Table. GDP per capita is included as a control variable. In addition, PFDH analysis was conducted to limit sensitivity to outliers. In both cases, a higher score implies greater efficiency.
AZE UAE KAZ SAU BHR QAT OMN KWT IRN DZA YEM LBY CIV CMR TCD GAB AGO SGP LTU NOR GRC BIH CAN MEX COL ECU TTO VEN 1.0 2.0 3.0 4.0 5.0 6.0 7.0 0 10,000 20,000 30,000 40,000 50,000 60,000 In fr as tr uc tur e q ua lit y, 1 -7 (b es t)
Real public capital stock per capita (PPP)