R E S E A R C H
Open Access
MicroRNA-572 expression in multiple sclerosis
patients with different patterns of clinical
progression
Roberta Mancuso
1*, Ambra Hernis
1, Simone Agostini
1, Marco Rovaris
1, Domenico Caputo
1and Mario Clerici
1,2Abstract
Background:Demyelination and failure of remyelination are core mechanisms in the pathogenesis of multiple sclerosis (MS); the factor(s) modulating these processes are still mostly unknown. MicroRNA 572 (miR-572) is deregulated in MS and is suggested to targets neural cell adhesion molecule (NCAM), a glycoprotein involved in CNS reparative mechanisms. The aim of this study is to analyze miR-572 in patients with different clinical phenotypes of MS.
Methods:qPCR quantification of miR-572 isolated from serum was performed in 16 primary progressive (PP), 15 secondary progressive (SP), 31 relapsing remitting (RR) MS patients and 15 sex-and age-matched healthy controls. Results:miR-572 expression was reduced overall in MS patients (p < 0.05) compared to HC; this miRNA was significantly upregulated in SPMS and in RRMS during disease relapse, whereas it was downregulated in PPMS and in quiescent phases of RRMS. miR-572 expression correlated with EDSS scores (RSp= 0.491; p < 0.05) independently of the clinical phenotype. The results suggest that this miRNA might be a tool that helps distinguishing between PPMS and SPMS and between relapsing and remitting phases in RRMS.
Conclusions:Evaluation of miR-572 may serve as a non-invasive biomarker for remyelination.
Keywords:microRNA, Multiple Sclerosis, NCAM, Remyelination, Disability, Serum
Background
Multiple Sclerosis (MS) is an inflammatory neurodegen-erative disorder of the central nervous system (CNS) of unknown etiology characterized by a high degree of het-erogeneity with respect to clinical manifestations and re-sponse to treatment. The pathological process common to all forms of this disease is the inadequate repair of myelin damage in CNS, a complex and yet mostly un-clear process that becomes increasingly evident as MS progresses [1]. Many reasons, including the inadequate recruitment of oligodendrocytes precursor cells (OPC) and an impairment in the processes leading OPC to dif-ferentiate into oligodendrocytes, can hamper the remye-lination process. The accumulation of myelin alterations leads to axonal degeneration; this appears early in dis-ease, but becomes prominent in the progressive form of
MS [2,3], leading to further axonal and neuronal loss and progression of disability.
Transient remyelination [4] and at least a partial res-toration of conduction velocity [5] is seen in MS, pro-cesses that can protect axons from injury and determine the temporary remission of disease in RRMS [6].The ef-ficacy of the remyelination process varies widely in dif-ferent patients and in difdif-ferent phases of the disease. Thus, although remyelination is frequently more effi-cient in the early stage of MS [4], extensive remyelina-tion has been sometimes observed in chronic patients [7], even if this phenomenon is usually rare or absent in late chronic disease [8]. The degree of remyelination also differs in the diverse clinical phenotypes of MS. Thus, a more complete remyelination is known to occur in the brain of primary progressive (PPMS) compared to sec-ondary progressive (SPMS) patients [9], a finding that might explain the relative preservation of cognitive func-tion in PPMS patients [10].
* Correspondence:[email protected]
1Don C. Gnocchi Foundation–ONLUS, P.zza Morandi, 3, 20100 Milano, Italy
Full list of author information is available at the end of the article
Although the molecular mechanisms responsible for remyelination are still mostly unclear, the neural cell ad-hesion molecule (NCAM or CD56) is suspected to play an important role in this process, as this protein, that belongs to the immunoglobulin super-family, is linked to CNS reparative mechanism [11]. NCAM is an integral membrane glycoprotein in neuronal and glial cells and it promotes adhesion between cells through interacting with homologous molecules on adjacent cells. Notably, binding of NCAM to polysialic acid (PSA-NCAM) de-creases cell adhesion, inducing structural remodeling in brain during the development of the nervous system [12] and contributing to the formation of axonal net-works [13]. In the adult nervous system NCAM is expressed in limited brain areas, where it is involved in neuronal sprouting and synaptic remodeling [14], while PSA-NCAM acts as a negative signal of myelination [15]. Defective myelin compaction was observed in NCAM deficient mice [16], and deletion of chromosome coding sequence for NCAM in children has been associ-ated with delayed myelination [17]. Finally, NCAM is differentially expressed in active or chronic MS lesions [18], and abnormal levels of soluble NCAM (NCAMs) were suggested to be associated with the progression of disability in MS [19,20].
Data stemming from a computational approach (TargetScan) showed that NCAM is a possible target for microRNA (miRNA) 572, a miRNA that was re-cently observed to be deregulated in MS [21]. As is the case with miRNAs, the result of the miR-572/ NCAM interaction would be the modulation of NCAM activity, and this would correlate with the de-gree of remyelination. We evaluated the levels of this miRNA in serum of a group of MS patients with dif-ferent clinical forms, analyzing possible correlations with progression of disease and clinical characteristics.
Methods
Patients and samples collection
Thirty-one chronic progressive (16 primary progressive
–PPMS–and 15 secondary progressive –SPMS) and 31 relapsing remitting (RRMS) patients as well as 15 age-and sex-matched healthy controls (HC) were enrolled
for the study after signing an informed consent approved by the Ethics Committee of the Don C. Gnocchi Foun-dation-ONLUS in Milano, Italy. Among the RRMS pa-tients, 15 were undergoing clinical relapse of the disease whereas the other 16 were in a clinically stable phase without areas of enhancement at the time of enrolment, as demonstrated by magnetic resonance imaging (MRI) with gadolinium.
All the patients were diagnosed according to the re-vised McDonald criteria [22] and did not receive any treatment for at least two months before the blood with-drawal. RRMS patients in whom clinical relapse was ob-served underwent blood collection before the first glucocorticoid infusion. Demographic and clinical char-acteristics of all the subjects enrolled are shown in Table 1. Serum samples were obtained from whole blood at the end of clotting time (60 minutes) by centrifuga-tion (3400g× 10 minutes).
miRNA target prediction
TargetScan (http://www.targetscan.org/), and MiRanda (http://www.microrna.org/microrna/home.do) bioinfor-matic tools were utilized to determine miRNA potential target mRNAs.
miRNA isolation and cDNA retrotranscription
miRNA isolation from serum was performed with a col-umn based kit (miRNeasy Mini kit, Qiagen GmbH, Hilden, Germany) according to the manufacturer’s specific proto-col. Notably, as the yield of RNA from small volume serum samples was below the limit of quantitation by spectrophotometry, prior to miRNA extraction, 1 μg of carrier RNA (MS2 RNA, Roche Life Science, Mannheim, Germany) and 5 μl of non-human (C. elegans) synthetic miR-39 (C.el.-miR-39) (5 nM) were added to 200 μl of serum after denaturation with Qiazol Lysis Reagent. Total RNA was eluted in 30μl.
[image:2.595.56.539.634.714.2]The inclusion of the synthetic miRNA was necessary for adjusting for differences in efficiency of RNA recov-ery between samples. Four μl of RNA was utilized for retro-transcription reactions (in a final volume of 20μl), performed in triplicate using the universal cDNA
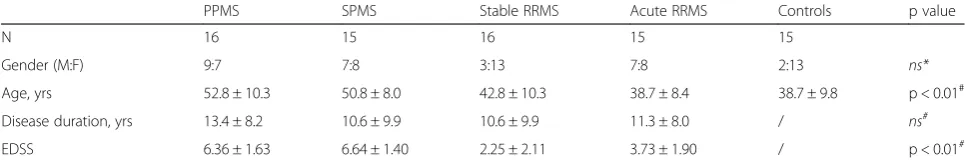
Table 1Demographic and clinical characteristics of the individuals enrolled in the study
PPMS SPMS Stable RRMS Acute RRMS Controls p value
N 16 15 16 15 15
Gender (M:F) 9:7 7:8 3:13 7:8 2:13 ns*
Age, yrs 52.8 ± 10.3 50.8 ± 8.0 42.8 ± 10.3 38.7 ± 8.4 38.7 ± 9.8 p < 0.01#
Disease duration, yrs 13.4 ± 8.2 10.6 ± 9.9 10.6 ± 9.9 11.3 ± 8.0 / ns#
EDSS 6.36 ± 1.63 6.64 ± 1.40 2.25 ± 2.11 3.73 ± 1.90 / p < 0.01#
synthesis kit (miRCURY LNA™Universal cDNA synthe-sis kit, Exiqon Inc., Vedbaek, Denmark). Efficiency of cDNA synthesis and absence of qPCR inhibitors were monitored for all the samples by addition of the syn-thetic control template (RNA spike-in, Exiqon Inc.). To avoid variation due to sample differences and handling, all the variables involved in the procedure were kept consistent throughout the study.
miRNA selection and quantitative PCR assay
The study focused on a specific miRNA (miR-572) previ-ously identified as being upregulated in plasma of MS patients [21]. A specific LNA™-individual microRNAs assay (Exiqon Inc.) was utilized to detect in sera the miRNA target (hsa-miR-572; cat. 204696), reference miRNAs, and the haemolysis control (hsa-miR-16; cat. 204409) according to the manufacturer’s instructions. A set of 3 endogenous miRNAs was selected as candidate reference genes to normalize the data: miR-103 (Exiqon, cat. 204063), -191 (Exiqon, cat. 204306), −423 (Exiqon, cat. 204593). A synthetic C.el. miR-39 (Exiqon, cat. 203952) was also used to normalize the results.
Briefly, qPCR amplification was performed on real time PCR system (Step One, Applied Biosystem, Foster City, CA) in 10 μl of reaction mix containing SYBR GREEN master mix (Exiqon Inc.), specific primer set for each miRNA and 4 μl of cDNA. Each cDNA tem-plate was tested in triplicate by qPCR. Negative controls, without rt-template controls, and no-template controls were included in each session. An additional step in the qPCR analysis was performed to evaluate the specificity of the amplification products by generating a melting curve for each reaction.
Data processing and statistical analysis
Manual baseline and threshold were set manually on the instrument for the evaluation of row Cq value for each sample. Because of the scarcity of miRNA in serum, Cq = 38 was set as the cut-off.
The NormFinder algorithm was used to calculate the expression stabilities of the candidate reference genes. NormFinder calculates the stabilities of candidate refer-ence genes based on the intra- and inter-group varia-tions. A lower stability value indicates a more stably expressed gene [23].
Relative quantification was determined by the com-parative delta-Cq method using the more stable refer-ence miRNA (ref ) indicated by NormFinder for median normalization procedure: (Raw Cq value - [(ref miRNA average Cq of the given sample) - (ref miRNA median Cq value)]; fold expression levels (2-ΔΔCq) were calcu-lated as described [24]; fold change < 0.5 was indicative of down-regulation and > 2 of up-regulation. Absence of qPCR inhibition for haemolysis was verified monitoring
the stability of Cq of miR-16, commonly found in red blood cells.
Statistical analyses were accomplished using commer-cial software (MedCalc®, version 11.5.0.0).
Demographic and clinical quantitative data, reported as mean and standard deviation, were analyzed by one-way analysis of variance (ANOVA). The others quantita-tive variable, not normally distributed, are expressed as median and 95% confidence interval (CI). Logarithmic transformation was applied to miR-572 relative expres-sion fold, and Kruskal-Wallis was used to compare value among groups, whereas Mann Whitney test was used to determine the significance between two groups. Spear-man’s rank correlation coefficient was used in the correl-ation analysis between miR-572 and clinical variables. p values < 0.05 were considered statistically significant. Re-ceiver operating characteristics analysis (ROC) and area under curve (AUC) were used to evaluate the potential of miRNA as biomarker (see Additional file 1).
Results
Selection of candidate reference genes
C.el miR-39 was selected for normalization because NormFinder ranked it as the most stably expressed gene, followed by miR-103, miR-423, and miR-191.
Moreover, normalization with two other miRNAs (miR-103, miR-423) was performed to confirm the ana-lysis obtained withC.elmiR-39.
miR-572 expression levels in MS patients and in HC The expression levels of circulating miR-572 were evalu-ated in MS patients with different clinical disease pheno-types as well as in HC. Demographic and clinical details showed that disease duration was comparable for all groups, although patients’age was significantly higher in progressive than in RRMS (Table 1).
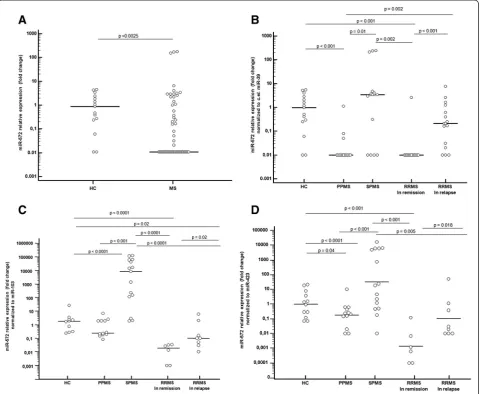
Results showed that the serum concentration of miR-572 was significantly down regulated in the overall group of MS patients (median fold: 0.01; 95% CI: 0.01-0.05) compared to HC (0.98; 0.26-2.63, p = 0.0025) (Figure 1, Panel A).
miR-572 expression levels in MS patients with different disease phenotype
RRMS patients undergoing a disease relapse (0.21; 0.02-1.03) in comparison to those RRMS patients evaluated during remission (p < 0.001) (Figure 1, Panel B). In Figure 1, panels C represents miR-572 expression after normalization with miR-103; results in panel D are normalized with miR-423.
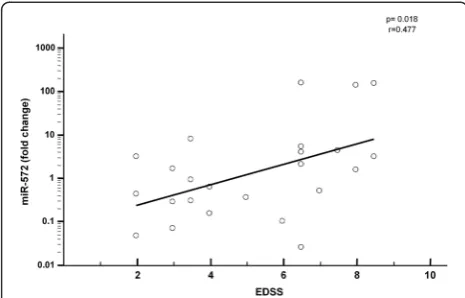
Correlations between miR-572 serum concentrations and clinical parameters
The Kurtzke Expanded Disability Status Scale (EDSS) is a widely accepted method of quantifying disability in MS; possible correlations between EDSS scores and miR-572 serum concentrations were analyzed. Consider-ing the overall MS population, a significant positive cor-relation independently from the clinical phenotype was
observed between relative expression of miR-572 in serum and EDSS disability score (Rs= 0.477; p = 0.018)
(Figure 2); in contrast with these results, disease duration was not associated with miR-572 serum concentration.
Discussion
[image:4.595.59.540.90.484.2]maturation of the nervous system [27], and more re-cently also suggested to play a role in neurodegenerative diseases. In fact many evidences showed the influence of NCAM in neurite outgrowth [28], synaptic plasticity [29] and CNS repair and remyelination [30].
Results showed that miR-572 was down-regulated in the MS patients compared to HC subjects, a phenomenon already evidenced in previous analyses on other miRNAs [26,31]; interestingly, a modulation of miR-572 was ob-served upon clustering of MS patients in accordance with clinical course. Thus, comparisons between groups showed that serum levels of miR-572 were markedly differ-ent when the primary and secondary forms of progressive MS were compared, with significant increase in SPMS and significant decrease in PPMS. Similarly, in RRMS patients a significant increase of serum concentrations of miR-572 was observed in relapsing compared to remitting patients.
It is known that a major challenge for the analysis of circulatory miRNA is data normalization, a crucial point for an objective evaluation of their expression level and to avoid the introduction of systematic bias in the ana-lysis. The strategy we adopted was to use a synthetic spike-in oligonucleotide, as reported by several other pa-pers [32,33]. Thus, C. el miR-39 was selected as refer-ence because indicated as the best candidate by Normfinder software. To further confirm our results two other miRNA (miR-103, miR-423) were used singu-larly to normalize the data; the three methods led to the same results.
Plasma levels of miR-572 were previously reported to be increased in MS patients [21]. The discrepancy be-tween these and our results can be explained consider-ing that the data reported by Siegel et al. stem from analyses performed in a very small group (n = 4) of MS patients that were not clinically classified. Moreover, sig-nificant variation in specificity among different qPCR platform/methods is a well known problem as less
abundant miRNAs can escape detection with technolo-gies such as microarray, cloning and hybridization [34]. Thus, the choice of the method used (qPCR array vs. in-dividual qPCR with LNA™-primers), or of different bio-logical samples (serum vs. plasma) as well as the clinical course of analyzed patients can explain these discrepancies. Different studies have investigated whether serum con-centration of soluble NCAM (NCAMs) could be used as a biomarker in human pathology [35]. Particularly, in MS the low levels of NCAMs detected in the cerebro-spinal fluid (CSF) suggest that this molecule could con-tribute to the decreased CNS repair observed in this disease [36,37]. Notably, recent data showed the pres-ence of a negative correlation between EDSS scores and CSF NCAMs levels, and demonstrated that the concen-tration of NCAMs decreases with disease progression [19]. On the contrary, increasing CSF NCAMs levels are observed in RRMS patients after treatment of the acute phase with corticosteroids [36], paralleling the progres-sive clinical improvement seen after the cessation of re-lapses, and indicating a possible relation with myelin repair mechanism.
[image:5.595.56.289.89.238.2]Understanding the mechanism(s) responsible for the modulation of NCAM thus could shed light on the pathogenesis of MS and, possibly, open novel thera-peutic avenues for this disease. In the attempt to clarify this issue we analyzed serum levels of miR-572, a miRNA that is suggested by computational approaches to bind NCAM and, thus, regulates its activity. Results herein are the first in which circulating levels of miR-572 are analyzed in a large group of MS patients sub-divided according to the disease course. Because an increase of miRNA is mostly associated with expres-sion and activity reduction of the target protein [38], the correlation between serum levels of miR-572 and MS clinical phenotypes allows the speculation that the observed changes in miR-572 may result in different degrees of myelin repair activity. This hypothesis is supported by the fact that the concentration of miR-572 was significantly reduced (hence NCAM activity was likely significantly increased) in PPMS patients, in whom a more complete remyelination is known to occur [9]. Further support to this possibility stems from the observation that initiation of steroids in RRMS patients with disease relapses resulted in the reduction of serum concentration of miR-572 (our data) and a parallel increase of NCAMs in CSF [36]. Finally, a positive correlation was observed between serum miR-572 levels and disability score in MS pa-tients; these results are specular to the recently re-ported inverse correlation detected in MS between NCAMs in CSF and EDSS scores [19]. An important weakness of the study is the limited number of ana-lyzed patients; this could have influenced the results. Figure 2Correlation between miR-572 and disability in MS patients.
Further analyses with a larger cohort will be necessary to confirm these preliminary data and to validate experimentally the miR-572/NCAM target interaction and modulation.
Conclusions
Our results suggest that miR-572 could be one of the regulatory factors involved in the remyelination process and raise the possibility that the changes in miR-572 expression seen in MS patients with different patterns of disease may play a role in such process and could be used as a biomarker.
Additional file
Additional file 1:Figure S1. Receiver operating characteristic analysis of miR-572 for discriminating between MS and HC.To evaluate the potential of miRNA as biomarkers, receiver operating characteristics analysis (ROC) and area under curve (AUC) were performed. Results showed that serum levels of miR-572 have a predictive value in distinguishing MS from HC (AUC: 0.741; 95% CI: 0.623-0.834; p= 0.0003) and PPMS from SPMS (AUC: 0.765; 95% CI: 0.544-0.915; p=0.0067).Moreover serum miR-572 concentrations could clearly distinguish between acute and stable disease in RRMS patients (AUC 0.848; 95% CI: 0.674-0.951; p<0.0001). ROC curves of serum concentration of miR-572 in MS patients and HC (panel A), in PPMS compared to SPMS patients (panel B) and in relapsing compared to remitting MS (panel C). AUC: area under curve; CI: confidence interval. For Methods see main text.
Abbreviations
ANOVA:One-way analysis of variance; AUC: Area under curve; cDNA: Complementary DNA; CI: Confidence interval; CNS: Central nervous system; Cq: Quantification cycle; CSF: Cerebrospinal fluid; EDSS: Kurtzke Expanded Disability Status Scale; HC: Healthy control; LNATM: Locked nucleic acid;
miRNA: microRNAs; MRI: Magnetic resonance imaging; MS: Multiple Sclerosis; NCAM: Neural cell adhesion molecule; NCAMs: Soluble NCAM; OPC: Oligodendrocytes precursor cells; PPMS: Primary progressive MS; PSA-NCAM: Polysialylated NCAM; qPCR: Quantitative polymerase chain reaction; ROC: Receiver operating characteristics analysis; RRMS: Relapsing remitting MS; SPMS: Secondary progressive MS.
Competing interests
The authors declare that they have no competing interests.
Authors’contributions
RM, MC designed the experiments; MR, DC recruited patients and collected clinical data; AH, SA, performed experiments and data collection; RM and SA analyzed the data; MC, RM, SA interpreted of the data and drafted the manuscript. All the authors revised and approved the final manuscripts.
Acknowledgements
This work was supported by the Italian Ministry of Health (2013–2014 Ricerca Corrente).
Author details
1Don C. Gnocchi Foundation–ONLUS, P.zza Morandi, 3, 20100 Milano, Italy. 2
Department of Physiopathology and Transplantation, University of Milano, Milano, Italy.
Received: 12 November 2014 Accepted: 24 April 2015
References
1. Franklin RJ, Ffrench-Constant C. Remyelination in the CNS: from biology to therapy. Nat Rev Neurosci. 2008;9:839–55.
2. Ingle GT, Stevenson VL, Miller DH, Thompson AJ. Primary progressive multiple sclerosis: a 5-year clinical and MR study. Brain. 2003;126:2528–36.
3. Lovas G, Szilágyi N, Majtényi K, Palvoktis M, Komoly S. Axonal changes in chronic demyelinated cervical spinal cord plaques. Brain. 2000;123:308–17. 4. Prineas JW, Barnard RO, Revesz T, Kwon EE, Sharer L, Cho ES. Multiple
sclerosis: remyelination of nascent lesions. Ann Neurol. 1993;33:137–51.
5. Smith KJ, Blakemore WF, Mcdonald WI. Central remyelination restores secure conduction. Nature. 1979;280:395–6.
6. Kornek B, Storch MK, Weissert R, Wallstroem E, Stefferl A, Olsson T, et al. Multiple sclerosis and chronic autoimmune encephalomyelitis–a comparative quantitative study of axonal injury in active, inactive, and remyelinated lesions. Am J Pathol. 2000;157:267–76.
7. Olsen JA, Akirav EM. Remyelination in multiple sclerosis: cellular mechanisms and novel therapeutic approaches. J Neurosci Res. In press. 8. Frohman EM, Racke MK, Raine CS. Multiple sclerosis–the plaque and its
pathogenesis. N Engl J Med. 2006;354:942–55.
9. Bramow S, Frischer JM, Lassmann H, Koch-Henriksen N, Lucchinetti CF, Sorensen PS, et al. Demyelination versus remyelination in progressive multiple sclerosis. Brain. 2010;133:2983–98.
10. Comi G, Filippi M, Martinelli V, Campi A, Rodegher M, Alberoni N, et al. Brain MRI correlates of cognitive impairment in primary and secondary progressive multiple sclerosis. J Neurol Sci. 1995;132:222–7. 11. Rutishauser U, Jessell TM. Cell adhesion molecules in vertebrate neural
development. Physiol Rev. 1988;68:819–57.
12. Rutishauser U, Landmesser L. Polysialic acid in the vertebrate nervous system: a promoter of plasticity in cell-cell interactions. Trends Neurosci. 1996;19:422–7.
13. Brümmendorf T, Rathjen FG. Cell adhesion molecules 1: immunoglobulin superfamily. Protein Profile. 1995;2:963–1108.
14. Jørgensen OS. Neural cell adhesion molecule (NCAM) as a quantitative marker in synaptic remodeling. Neurochem Res. 1995;20:533–47. 15. Charles P, Hernandez MP, Stankoff B, Aigrot MS, Collin C, Rougon G, et al.
Negative regulation of central nervous system myelination by polysialylated-neural cell adhesion molecule. Proc Natl Acad Sci U S A. 2000;97:7585–90.
16. Bhat S, Silberberg DH. Expression of neural cell adhesion molecule in dysmyelinating mutants. Brain Res. 1990;535:39–42.
17. Ono J, Harada K, Hasegawa T, Sakurai K, Kodaka R, Tanabe Y, et al. Central nervous system abnormalities in chromosome deletion at 11q23. Clin Genet. 1994;45:325–59.
18. Han MH, Hwang SI, Roy DB, Lungren DH, Price JV, Ousman SS, et al. Proteomic analysis of active multiple sclerosis lesions reveals therapeutic targets. Nature. 2008;451:1076–81.
19. Gnanapavan S, Ho P, Heywood W, Jackson S, Grant D, Rantell K, et al. Progression in multiple sclerosis is associated with low endogenous NCAM. J Neurochem. 2013;125:766–73.
20. Massaro AR, De Pascalis D, Carnevale A, Carbone G. The neural cell adhesion molecule (NCAM) present in the cerebrospinal fluid of multiple sclerosis patients is unsialylated. Eur Rev Med Pharmacol Sci. 2009;13:397–9. 21. Siegel SR, Mackenzie J, Chaplin G, Jablonski NG, Griffiths L. Circulating
microRNAs involved in multiple sclerosis. Mol Biol Rep. 2012;39:6219–25. 22. Polman CH, Reingold SC, Banwell B, Clanet M, Cohen JA, Filippi M, et al. Diagnostic criteria for multiple sclerosis: 2010 revisions to the McDonald criteria. Ann Neurol. 2011;69:292–302.
23. Andersen CL, Jensen JL, Orntoft TF. Normalizatiopn of real-time quantitative reverse transcription-PCR data: a model-based variance estimation approach to identify genes suited for normalization, applied to bladder and colon cancer data sets. Cancer Res. 2004;64:5245–50.
24. Mitchell PS, Parkin RK, Kroh EM, Fritz BR, Wyman SK, Pogosova-Agadjanyan EL, et al. Circulating microRNAs as stable blood based markers for cancer detection. Proc Natl Acad Sci U S A. 2008;105:10513–8.
25. Gandhi R, Healy B, Gholipour T, Egorova S, Musallam A, Hussain MS, et al. Circulating microRNAs as biomarkers for disease staging in multiple sclerosis. Ann Neurol. 2013;73:729–40.
26. Fenoglio C, Ridolfi E, Cantoni C, De Riz M, Bonsi R, Serpente M, et al. Decreased circulating miRNA levels in patients with primary progressive multiple sclerosis. Mult Scler. 2013;19:1938–42.
28. Maness PF, Schachner M. Neural recognition molecules of the immunoglobulin superfamily: signaling transducers of axon guidance and neuronal migration. Nat Neurosci. 2007;10:19–26.
29. Dityatev A, Dityateva G, Sytnyk V, Delling M, Toni N, Nikonenko I, et al. Polysialylated neural cell adhesion molecule promotes remodeling and formation of hippocampal synapses. J Neurosci. 2004;24:9372–82. 30. Takeda Y, Murakami Y, Asou H, Uyemura K. The roles of cell adhesion molecules
on the formation of peripheral myelin. Keio J Med. 2001;50:240–8. 31. Waschbisch A, Atiya M, Linker RA, Potapov S, Schwab S, Derfuss T.
Glatiramer acetate treatment normalizes deregulated microRNA expression in relapsing remitting multiple sclerosis. PLoS One. 2011;6:e24604. 32. Mooren FC, Viereck J, Kruger K, Thum T. Circulating microRNAs as potential
biomarkers of aerobic exercise capacity. Am J Physiol Heart Circ Physiol. 2014;306:H557–63.
33. Hromadnikova I, Kotlabova K, Hympanova L, Doucha J, Krofta L. First trimester screening of circulating C19MC microRNAs can predict subsequent onset of gestational hypertension. PLoS One. 2014;9:e113735. 34. van Rooij E. The art of microRNA research. Circ Res. 2011;108:219–34. 35. Brennaman LH, Maness PF. NCAM in neuropsychiatric and neurodegenerative
disorders. Adv Exp Med Biol. 2010;663:299–317.
36. Massaro AR. The role of NCAM in remyelination. Neurol Sci. 2002;22:429–35. 37. Strekalova H, Buhmann C, Kleene R, Eggers C, Saffell J, Hemperly J, et al.
Elevated levels of neural recognition molecule L1 in the cerebrospinal fluid of patients with Alzheimer disease and other dementia syndromes. Neurobiol Aging. 2006;27:1–9.
38. Maragkakis M, Alexiou P, Papadopoulos GL, Reczko M, Dalamagas T, Giannopoulos G, et al. Accurate microRNA target prediction correlates with protein repression levels. BMC Bioinformatics. 2009;10:295.
Submit your next manuscript to BioMed Central and take full advantage of:
• Convenient online submission
• Thorough peer review
• No space constraints or color figure charges
• Immediate publication on acceptance
• Inclusion in PubMed, CAS, Scopus and Google Scholar
• Research which is freely available for redistribution