promoting access to White Rose research papers
White Rose Research Online [email protected]
Universities of Leeds, Sheffield and York
http://eprints.whiterose.ac.uk/
This is an author produced version of a paper published in European Physical Journal E.
White Rose Research Online URL for this paper:
Published paper
Dunbar, A.D.F., Mokarian-Tabari, P., Parnell, A.J., Martin, S.J., Skoda, M.W.A., Jones, R.A.L. (2010) A solution concentration dependent transition from self-stratification to lateral phase separation in spin-cast PS:d-PMMA thin films, European Physical Journal E, 31 (4), pp. 369-375
A solution concentration dependent transition from self stratification to lateral phase separation in spin-cast PS:d-PMMA thin films.
A. D. F. Dunbar1, P. Mokarian-Tabari2, A. J. Parnell2, S. J. Martin3, M. W. A. Skoda 4 and R. A. L. Jones2
1. Department of Chemical and Process Engineering, University of Sheffield, S1 3JD, UK. E-mail: [email protected]
2. Department of Physics & Astronomy, University of Sheffield, S3 7RH, UK.
3. Department of Materials, Loughborough University, Loughborough, LE11 3TU, UK. 4. ISIS Pulsed Neutron and Muon Source, S.T.F.C., Rutherford Appleton Laboratory, Didcot OX11 0QX,UK
PACS: 64.75.Va, 68.55.J-
A transition from self stratification to lateral phase separation
Thin films with a rich variety of different nano-scale morphologies have been produced by spin casting solutions of various concentrations of PS:d-PMMA blends from toluene solutions. During the spincasting process specular reflectivity and off-specular scattering data were recorded and ex situ optical and atomic force microscopy, neutron reflectivity and ellipsometry have all been used to characterise the film morphologies. We show that it is possible to selectively control the film morphology by altering the solution concentration used. Low polymer concentration solutions favour the formation of flat in-plane phase separated bi-layers, with a d-PMMA-rich layer underneath a PS-rich layer. At intermediate concentrations the films formed consist of an in-plane phase separated bi-layer with an undulating interface and also have some secondary phase separated pockets rich in d-PMMA in the PS-rich layer and vice versa. Using high concentration solutions results in laterally phase separated regions with sharp interfaces. As with the intermediate concentrations secondary phase separation was also observed, especially at the top surface.
1. Introduction
physical mechanisms which govern the evolution of the complex phase separated morphologies [6-9]. Although phase separation during spin casting is a dynamic non-equilibrium process surprisingly little of the experimental research into spin casting has been done in situ. Previous in situ studies done by our research group have shown that by utilising a combination of specular reflectivity and off-specular scattering it is possible to follow the evolution of the phase separation during the spin casting process [15,16].
The aim of this work was to examine the complex morphologies that result from spin casting PS-PMMA solutions under different experimental conditions and to elucidate the mechanisms that control the phase separation. An understanding of the mechanisms involved may make it possible to systematically exert some control over the complex morphologies produced. To achieve these aims we have conducted a series of in situ specular reflectivity and off-specular scattering measurements during the spin casting process and then taken ex situ optical micrographs, atomic force micrographs and conducted neutron reflectivity measurements on the spin cast samples to determine the final film morphologies. The results that we acquired have provided useful insights into the structure of the phase separated films and the processes that control phase separation, and therefore we are able to elaborate upon the mechanism of phase separation first proposed in reference [16].
2. Experimental
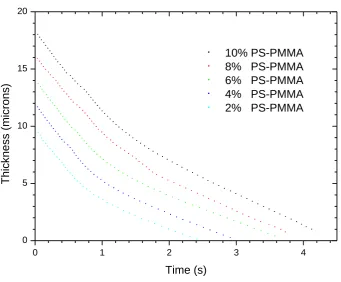
The toluene (HPLC grade) was provided by Sigma-Aldrich and used as delivered and the polymers polystyrene (PS) and deuterated poly-methylmethacrylate (d-PMMA) were provided by Polymer source and also used as delivered. They had molecular weights of Mw =136k and 135.5k, respectively. Polymers with similar molecular weights were selected as they have previously been shown to phase separate on a length scale that is sufficiently large to be observed by off specular scattering [15,16]. Deuterated PMMA rather than the standard hydrated PMMA was used to provide greater contrast in the neutron reflectivity experiments. PS:d-PMMA blend solutions (in toluene) were prepared at different concentrations (2%, 4%, 6%, 8% and 10% by mass of total polymer content). The mass ratio of PS:d-PMMA was fixed at 1:1. Oxygen plasma cleaned Si substrates (1” wafer, 4mm thick) were then spin cast at 2000rpm using the different concentration solutions. The spin casting process was done on a custom built, instrumented, spin coater. Spinning was performed in air and at room temperature. This system can measure the optical reflectivity (OR) and off-specular scattering of light from a HeNe laser (633nm) directed onto the sample surface during the spinning process [15]. The thickness time curves for each sample processed are shown in figure 3. These were generated from the OR data (e.g. figure 2). The final film thickness was obtained by scratching the film and measuring an AFM step height profile across the scratch. This ex situ thickness measurement gives the last data point in the thickness time plots (figure 3) and all the previous data points are determined by counting the time between the OR fringes, which correspond to thickness changes of λ / 2n cos θi , where λ is the laser wavelength, n is the refractive index of the solution (assumed to vary linearly between its initial and final values) and θi is the incident angle of the light. Video recordings of the off-specular scattering were analysed to determine the development of lateral phase separation in each sample. The final off-specular images are shown as inserts in figure 1.
mm by 8 mm). A J.A. Woolham M2000V spectroscopic (370 nm-1000 nm) ellipsometer was used to conduct these measurements and the data was fitted using a Cauchy model. The ellipsometry results provide an averaged thickness over the beam area of ~10mm2. However, for the 8% and 10% samples where the height variation is very large across this area it is expected that the error margins for the ellipsometry results will be large and as such the results are included in table 1 for completeness only.
After preparation the samples were then examined ex situ using neutron reflectivity (NR) with the reflectometer CRISP located at the ISIS Pulsed Neutron and Muon Source. The reflectivity was measured at three different angles and the data combined to give a q range of 0.01 Å-1 to 0.13 Å-1. Beyond this range the reflectivity was dominated by the background. The NR data recorded was then fitted using a customised model which consisted of a linear combination of two slab models of the sort commonly used to fit NR data [17,18]. The fit quality was optimised using a fitting algorithm to minimise the error parameter χ2
per point. This custom model was necessary because the polymer blends laterally phase separate at high concentrations, which results in laterally phase separated domains ~40 µm in diameter (as shown in the optical microscopy images Fig 1). The length scale of this ordering exceeds the coherence length of the neutron beam, which is estimated to be ~20 µm [19]. Therefore, the resulting NR profile is a linear combination of the expected NR profiles from two separate regions; one region for both phase ‘a’ and phase ‘b’, when lateral phase separation occurs on length scales greater than ~20 µm.
3. Results
During the spin casting of the polymer blends at lower concentrations i.e. 2% to 6% no large scale (>5μm) lateral phase separation was observed. In contrast, the films spun from the 8% and 10% solutions did show lateral phase separation with a length scale of ~ 40μm. In all but the 2% sample some short length scale phase separation (<5μm) was observed by AFM, but could not be resolved by the off specular scattering experiments. This short length scale phase separation is similar to that previously observed ex situ in the PS-PMMA material system by several authors [6-9]. The inserts in Figure 1 show the final off-specular scattering images for the samples spun from 2%, 6%, 8% and 10% solutions (the off specular scattering was not recorded for the 4% sample, although it was observed in situ to be similar to that for 2% and 6%). The high concentration samples show a distinct off-specular scattering ring that corresponds to lateral phase separation with a defined length-scale, unlike the samples made from low concentration solutions (2%, 4%, and 6%) which did not show any lateral phase separation. The rings observed are elliptical rather than circular due to the incident angle of the laser beam and its finite cross sectional area which results in an elliptical illuminated footprint. The ring observed for the 8% sample has a preferred orientation in the off specular scattering which is because the spinning substrate was very slightly off perfectly flat alignment. The occurrence of the lateral phase separation can also be seen in the optical microscopy images (Figure 1).
3.1. In situ specular optical reflectivity
Analysis of the in situ OR data and off-specular scattering videos shows that when lateral phase separation occurs its onset occurs late in the spinning process. The low concentration samples completely dry before lateral phase separation occurs. The high concentration samples 8% and 10% show strong off specular scattering after ~2.7 s and ~1.4 s respectively. This corresponds to film thicknesses of ~3.5 µm and ~9.3 µm respectively, from the reflectivity analysis figure 3.
The AFM images recorded are shown in figure 1. The film thicknesses established from the AFM step height data are in reasonable agreement with those values obtained from the ellipsometry measurements, see table 1. In general, as the concentration of the solution used to make the films increases the final film thickness increases. This is hardly surprising since the high concentration solutions contain more polymer and will also be more viscous therefore resulting in less solution loss in the early stages of the spinning process. It should be borne in mind that the AFM measurement is at a single point on the sample whereas the ellipsometry measurement is averaged over the area of the optical beam used in the experiment. The AFM data also gives us some information about the surface topology. For the sample made from 2% solution, the thin film is flat and without significant large features. As the solution concentration increases the laterally phase separated regions become more pronounced and their size increases from ~1µm in the 4% sample to >40µm in the 10% sample. The difference in film thickness between the PS rich and d-PMMA rich regions also increases with increasing concentration, note the vertical scales in the 3D AFM images in figure 1 increase from 50nm to 500nm. The chemical composition of the different regions has been identified by washing similar samples in the selective solvents acetic acid (a solvent for PMMA but not PS) and cyclohexane (a solvent for PS but not PMMA.)
3.3. Neutron Reflectivity
area of the single d-PMMA layer. Since it is necessary to employ the dual slab model to fit the 8% sample this allows us to estimate an upper limit for the neutron coherence length of 30 µm (length-scale of phase separation from the microscopy data) and since the 6% sample can be reasonably fitted with the single slab model an estimate of ~1.5 µm for a lower limit on the neutron coherence length can be ascertained. These limits are in agreement with previous estimates of the neutron coherence length of ~20 µm for this instrument [19]. The NR modelling was not very sensitive to thickness if the slab thicknesses were greater than ~200 nm. Therefore it is not surprising that there are some discrepancies between the AFM and NR derived total thicknesses as the total film thickness becomes large. The fits for the samples that were thinner overall were expected to generally have a slightly higher χ2
per point due to the greater number of fringes in the reflectivity curve.
4. Discussion
The results presented here are consistent with the dynamic model for film formation put forward in Heriot et al which describes an initial phase separation into a PS layer on top of a PMMA layer and then the solvent concentration gradient within the drying film driving a Marangoni-like instability at the liquid-liquid interface [16]. These results allow us to further develop this model. The self-stratification process which forms a PS-rich layer on top of a d-PMMA-rich layer is driven by the favourable enthalpy of phase separation and the different surface energies at both the air interface and substrate surface. By using different concentrations of solution the evolution of morphology within the drying film is essentially frozen in at different points in time during its development. However, of course, the total thickness of the films vary significantly since the concentration of the solution determines its viscosity and therefore plays an important role in determining the final thickness of the films produced. As can be seen in figure 3 thinning of the films is a two stage process. Birnie and Manley have attributed this to initial thinning dominated by inertial loss of fluid via radial flow and then latterly when the film is thin radial flow slows and the thinning becomes dominated by evaporation [2].
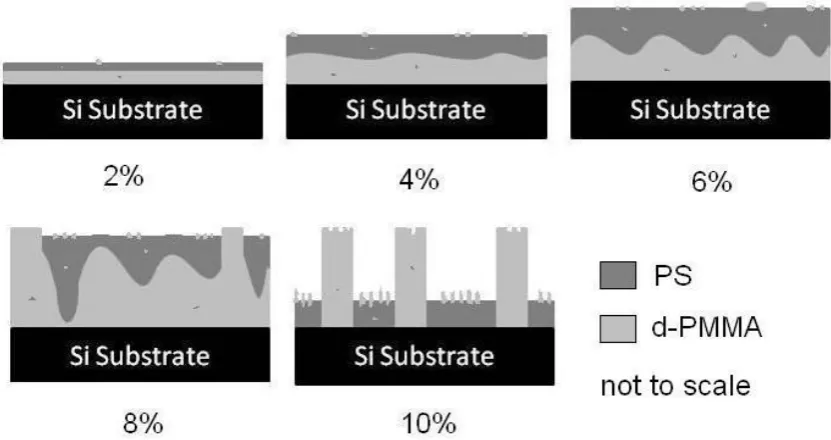
In the case of the lowest concentration film (2%) the solution viscosity is low and therefore upon spinning a thin film of fluid is rapidly formed which phase separates into a PS-rich layer on top of a d-PMMA-rich layer during solvent removal and after all the solvent has evaporated (in 2.4s) results in a flat featureless bi-layer structure. A schematic diagram of the different structures formed in each of the different samples is shown in figure 5.
When the solution concentration is increased to 4% the drying process takes slightly longer at 2.9s. Any pockets of high d-PMMA concentration in the PS layer therefore are more likely to have made their way to either the top surface where they will be anchored or to the interface with the underlying d-PMMA layer where they will be absorbed into the d-PMMA layer. Similarly, PS-rich pockets within the d-PMMA layer may migrate to the interface where they will be absorbed into the PS layer; however they will not be anchored at the substrate surface since it energetically prefers d-PMMA. This results in the mostly flat bi-layer structure decorated with small dimples observed in the 4% sample. The slight waviness at the surface is caused by evaporation from the top surface which results in variations in the solvent concentration gradient at both the top surface and at the buried interface. The result is the initial onset of a long length-scale Marangoni-like instability at the PS:d-PMMA interface which is to some extent mirrored by the topology of the upper surface.
does occur on the top surface and buried longer length scale undulations are also observed. These features are not manifest in the off-specular reflectivity due to limitations of the instrument used, i.e. the wavelength of light and sensitivity of the detector do not permit the short length-scale scattering to be detected and the reflection geometry used means that the scattered light collected is dominated by the top surface reflection and therefore this technique is not very sensitive to buried structure.
In the 8% sample the amplitude of the interface instability has become sufficiently large that it breaches the top surface resulting in laterally phase separated regions which have clearly resolved edges, as shown in figure 1. Upon breaching the surface the interfacial line will move rapidly to yield laterally phase separated regions. The undulations on the top surface suddenly flatten leaving a locally flat top surface. This process manifests itself as an off-specular scattering ring at a preferred length-scale of ~40 µm, which corresponds to the instability length scale, and steadily increases in intensity. When the instability breaches the surface a sudden, solid, circular bright flash is observed which corresponds to scattering at all length scales greater than and equal to the preferred length scale of the stability. Immediately after the flash only a central spot corresponding to a flat surface is observed. Very quickly after the flat surface spot is observed an off-specular ring re-appears. The reappearance of the off-specular scattering ring is thought to be due the subsequent thinning of the PS rich regions since PS dissolves more readily in toluene the PS rich regions will contain more solvent and therefore the PS phase will thin more that the PMMA phase as the last of the solvent evaporates. The irregular shape of the lateral phase separation in the 8% sample may be due to transfer of d-PMMA from instability oscillations that have not yet reached the top surface to neighbouring oscillations that have reached the surface. For the 8% and 10% samples there is a high degree of variation in the surface thickness between the laterally separated PS-rich and d-PMMA-rich regions. The ellipsometry thickness measurement is an averaged over a large area therefore due to the large thickness variations in the 8% and 10% samples the error margins will become very large, which explains why there is are discrepancies between the AFM and ellipsometry thickness measurements for these two samples.
The evolution of the morphology within the 10% sample during the spin-casting process was very similar to that of the 8% sample. The only significant difference being that at the higher concentration the lateral phase separation frozen into the sample was much more regular in size and shape. This is attributed to the higher viscosity of this sample. Therefore the transfer of d-PMMA from an instability peak to a neighbouring one is less likely before the surface is breached for both peaks. Alternatively, the increased uniformity could be because the troughs in the instability reach the lower substrate surface first in the thicker film and the lateral phase separation proceeds from the substrate up through the film.
5. Conclusions
Acknowledgements
The authors would like to acknowledge the ISIS Pulsed Neutron and Muon Source, for granting experimental time on CRISP (Experiment No. RB820342), and the EPSRC for funding the research (Grant No.EP/F016433/1).
References
1] D. Meyerhofer, J. Appl. Phys. 49(7), July 1978 p3993
2] D.P. Birnie III and M. Manley, Phys. Fluids 9(4), April 1997 p870 3] S. Walheim et al, Macromolecules 30 1997 p4995
4] K. Dalnoki-Veress, J.A. Forrest, J.R. Stevens and J.R. Dutcher, J. Polym. Sci. Part B: Polym. Phys., 34, p3017-3024 (1996)
5] K. Dalnoki-Veress, J.A. Forrest, J.R. Stevens and J.R. Dutcher, Physica A, 239, p87-94 (1997).
6] K. Tanaka et al, Macromolecules 29 1996 p3232-3239 7] M. Harris et al, Macromolecules 36 2003 p3307-3314 8] X. Li et al, Polymer 44 2003 p8155-8165
9] L. Cui et al, Thin Solid Films 515 2006 p2038-2048 10] A. Kumar et al, Langmuir 10 1994 p1498
11] A. Karim et al, Phys. Rev. E 57(6) June 1998 pR6273 12] M. Böltau et al, Nature 391 Feb 1998 p877
13] J. Raczkowska et al, Surf. Sci. 600 2006 p1004
14] P. Andrew and W.T.S. Huck, Soft Matter 3(2) 2007 p230 15] P. D. Jukes et al, Macromolecules 38 2005 p2030
16] S. Y. Heriot and R.A.L. Jones, Nature Mat. 4 Oct 2004 p782
17] S. J. Martin, R. A. L. Jones, M. Geoghegan, A. M. Higgins, I. Grizzi, J. J. M. Halls, S. Kirchmeyer, R. M. Dalgliesh, Phys. Rev. B2005, 71, 81408.
Figure and Table Captions
Figure 1. Optical microspcopy and AFM images of the 5 samples - AFM step height profile inset top right and final off-specular scatter image inset bottom left.
Figure 2. The in situ reflectivity data recorded during the spinning process for the blend solution with a concentration of 2% shown as an example of the data recorded and analysed to generate figure 3.
Figure 3. The thickness time curves determined from the OR data for the five different blend solution concentrations.
Figure 4. Neutron reflectivity data with modelled fits for the samples prepared from different concentration of polymer solution, each offset by an order of magnitude for clarity. The 2% (purple), 4% (blue) and 6% (green) data is fitted with a single slab model (PS layer on dPMMA layer) model and the 8% (orange) and 10% (red) data required a dual slab model (PS on dPMMA alongside dPMMA) to obtain satisfactory fits – see table 1 for further details.
Figure 5. A schematic diagram of the final structures in the samples prepared at different polymer concentrations (not to scale).
2%
4%
6%
8%
Figure 1. Optical microspcopy and AFM images of the 5 samples - AFM step height profile inset top right and final off-specular scatter image inset bottom left.
0.0 0.5 1.0 1.5 2.0 2.5 3.0 3.5 4.0
0.05 0.10 0.15 0.20 0.25 0.30 0.35
Inten
sit
y
Time (s)
0 1 2 3 4 0
5 10 15 20
Thic
knes
s
(microns
)
Time (s)
[image:12.595.96.438.119.401.2]10% PS-PMMA 8% PS-PMMA 6% PS-PMMA 4% PS-PMMA 2% PS-PMMA
0.01 0.1 10%
8%
6%
4%
2%
Neutron
Reflecti
vi
ty
[image:13.595.219.434.197.469.2]q (A-1)
Table 1. Comparison of the experimental results from the NR, AFM, ellipsometry and in situ OR measurements.
Solution
Concentration 2% 4% 6% 8% 10%
NR Model 1 Slab 1 Slab 1 Slab 1st Slab 2nd Slab 1st Slab 2nd Slab
χ2 per point 6.2 8.6 3.9 1.6 3.3
Φ areal % 100 100 100 92 8 71 29
Top Layer Thickness %d-PMMA (roughness)
13.8nm 206.2nm 271.4nm 202.4nm - 11.5nm -
12.1% 71.5% 81.8% 83.9% - 100% -
(6.0nm) (1.3nm) (0.4nm) (0.9nm) - (0.4nm) -
Base Layer Thickness %d-PMMA (roughness)
34.8nm 44.0nm 92.4nm 554.1nm 674.9nm 202.4nm 601.2nm
89.6% 90.7% 82.4% 36.3% 100% 0% 100%
(2.5nm) (5.7nm) (0.0nm) (0.5nm) (1.6nm) (0.4nm) (0.3nm)
Total thickness for
NR model 48.6nm 250.2nm 363.8nm 756.5nm 674.9nm 213.9nm 601.2nm
AFM thickness from
step height profile 66nm 202m 348nm 582nm 644nm 370nm 610nm
Ellipsometry thickness 75.5nm 204.9nm 325.9nm thickness variation (541.1nm) large thickness variation (727.9nm) large
Total drying time from