COMMISSION OF THE EUROPEAN COMMUNITIES
Brussels, 16.5.2006
SEC(2006) 639
COMMISSION STAFF WORKING DOCUMENT
PROGRESS TOWARDS THE LISBON OBJECTIVES IN EDUCATION AND TRAINING
Report based on indicators and benchmarks
CONTENT
Foreword
EXECUTIVE SUMMARY
I.
INTRODUCTION
1. The re-launched Lisbon Strategy
2. “Education and Training 2010” within the re-launched Lisbon strategy
II.
PERFORMANCE AND PROGRESS IN THE OBJECTIVE AREAS OF
EDUCATION & TRAINING
• The Member States struggle to answer to respond to the challenge of the five European Benchmarks for 2010
• All Member States can learn from the good performers in the Union
1.
FIRST STRATEGIC OBJECTIVE
Improving the quality and effectiveness of education and training systems
in the EU
1.1 Considerable teacher recruitment needs during the next decade 1.2 Developing skills for the Knowledge Society
• Key competences
• Completion of upper-secondary education
1.3 Strong growth in number of math, science and technology graduates 1.4 ICT: ensuring access for everyone
1.5 Considerable growth in investment in education
2.
SECOND STRATEGIC OBJECTIVE
Facilitating the access of all to education and training systems
2.1 Increasing participation in education and training within a lifelong perspective
• Approaching nearly universal participation levels in pre-primary education
• Vocational stream in upper secondary as an opportunity for young people “at risk”
• Ongoing increase of participation in tertiary education
• Increase of participation of adults in lifelong learning still remains a challenge 2.2. Too many young people still leave the school early and do not continue in any kind of learning
3.
THIRD STRATEGIC OBJECTIVE
Opening up education and training systems to the wider world
3.1 Most students lack adequate language skills to communicate across borders within the EU 3.2 The European educational space is in its making
III.
NEW INDICATORS – TOWARDS A COHERENT FRAMEWORK OF
3
Foreword
This Commission Staff Working Paper “Progress towards the Lisbon Objectives in the field
of education and training” is the third annual report examining performance and progress of
education and training systems in the EU using indicators identified and endorsed by experts
from participating countries.
The first Progress report was adopted by the Commission in 2004 (SEC (2004) 73). The
report analysed performance and progress since the year 2000 of 30 European countries: the
then 15 EU countries, the acceding countries, candidate countries and countries of the
European Economic Area. The analysis was based on 29 indicators on education and training
that were considered sufficiently comparable and valid by national experts sitting on the
Commission’s Standing Group on Indicators and Benchmarks. The analysis centred on the
five benchmarks for 2010 of European average performance levels adopted by the Council in
May 2003 (OJ C 134, 7.6.2003). The second report (SEC (2005) 419), adopted in 2005 by the
Commission, continued the analysis of performance and progress drawing, benefiting
especially from new 2003/4 data.
This Third Progress Report follows up the analysis of the first two reports. It is based on a
indicator tool of 29 indicators and the five benchmarks in the field of education and training
which now covers 31 European countries (EU, Acceding Countries, Candidate countries and
countries of the EEA). The 2006 report is however significantly more detailed in its analysis
of performance and progress than previously. Not only does the analysis benefit from the
availability of data time series for a period of up till five years (2000-2005) making it possible
to highlight trends, but the analysis has also been enhanced by a series of targeted studies
launched by the Commission in specific areas such as access to education, student
performance, early school leavers, civics education, financing of education, and mobility.
The 2006 report is divided in two distinctive parts. This Commission Staff Working Paper
analyses progress achieved towards the Lisbon objectives in education and training. A second
report “Detailed analysis of progress towards the Lisbon Objectives in Education and
Training” which is more detailed in terms of its statistical analysis and use of research results.
This second report has been prepared in close co-operation with the Standing Group for
Indicators and Benchmarks (SGIB) and endorsed by it.
The report is structured around the three Strategic Objectives of the Lisbon process in the
field of education and training concerning quality and effectiveness of education and training
systems; access to education and training; and the opening up of systems to the wider world.
Special focus has been put on the analysis of the second strategic objective in terms of
lifelong learning and the phenomenon of early school leaving. The in-depth analysis should
make it possible not only to compare performance and growth of countries and eventually to
identify best performance, but also to better identify the background variables explaining
performance and growth.
4
EXECUTIVE SUMMARY
Reaching the European benchmarks in the field of education would imply in 2010:
2 million fewer young people would have left school early
2 million more would have graduated from upper secondary education
200.000 less 15 years olds would be low performers in reading literacy
4 million more adults would participate in lifelong learning
All students leaving school would be able to communicate in two foreign languages.
Following the Conclusions of the Heads of State and Governments in Lisbon in 2000 and
their endorsement of the common objectives for education and training in Europe in
Barcelona, 2002, a radically new process of co-operation was launched in this area, with the
overall objective of making education and training systems in Europe a world quality
reference by 2010.
Ministers of education agreed on three major goals to be achieved by 2010, namely:
-
to improve the quality and effectiveness of EU education and training systems;
-
to ensure that they are accessible to all;
-
to open up education and training to the wider world.
To achieve these ambitious goals, they agreed on thirteen specific objectives covering the
various types and levels of education and training (formal, non-formal and informal) aimed at
making a reality of lifelong learning
.
In their first two Joint Interim reports
1of 2004 and 2006 on the implementation of the
Education and Training 2010 work programme, the Commission and the Council restate their
determination to work towards the agreed goals. In the 2004 report, they agree to work
simultaneously on three priority areas namely focus reform and investment on the key areas
for the knowledge-based society, making lifelong learning a concrete reality, and establish a
Europe of Education and Training. While the 2006 report emphasises in particular the need
for reforms to secure the development of high quality education and training systems, which
are both efficient and equitable.
This Commission Staff Working Paper “Progress towards the Lisbon Objectives in Education
and Training” is the third annual report examining performance and progress of education and
training in the EU. The report highlights key analytical messages emerging from a detailed
statistical analysis
2of progress towards these thirteen specific objectives using indicators
identified and endorsed by experts from the participating countries.
1
Joint Interim Report of the Council and the Commission: “Education & Training 2010: the success of the Lisbon strategy hinges on urgent reforms (2004) and 2006 joint progress report of the Council and the Commission on the implementation of the Education & Training 2010 work programme “Modernising education and training: a vital contribution to prosperity and social cohesion in Europe”.
2
5
A number of key messages on the progress towards the specific objectives emerge:
In the EU, presently (2005) about 6 million young people (18-24 years olds) have left education prematurely. Reaching the European benchmark of no more than 10% early school leavers would imply that 2 million more of these young people would have continued in education.
The high number of early school leavers is an obstacle to securing access to the
knowledge-based society and greater social cohesion in the EU. In 2005, almost 15% of young people
aged 18-24 in the EU left school prematurely and were in danger of being on the fringes of
the knowledge society. The Council has agreed to reduce this rate to no more than 10% by
2010. Although some progress has been made, the majority of Member States need to
increase their efforts in coming years to help reach the EU target. Best performing EU
countries as regards the share of early school leavers are: Poland (5.5%), Slovakia (5.8%) and
the Czech Republic (6.4%).
If present trends continue up till 2010, some 1 million students would graduate in math, science and technology every year in 2010 in the EU compared to the present level of 755.000 graduates. This should be compared to the number of MST graduate in the US which is presently 431.000 graduates per year - a production that the US wishes to double before 2015.
An adequate supply of scientists is crucial for a knowledge-based economy. The Council has
set two objectives: to bring about an increase of at least 15% in the number of graduates in
these fields by 2010 and at the same time to redress the imbalance between women and men.
At current trends the first objective will be achieved even ahead of schedule, while there is
slower progress as regards the gender balance (however, demographic trends might imply
much slower growth in the long term and in some areas like maths and statistics and physical
science there has been only slow growth or even a decline in the recent past). Slovakia
(17.6%), Italy (12.8%) and Poland (12%) are the EU countries with the strongest growth in
MST graduates. Best performing countries with regard to MST graduates per 1000 population
20-29, are: Ireland (24.2), France (22.2), and the UK (21.0), while in terms of female
graduates Estonia (42.5%), Cyprus (42.0%) and Portugal (41.5%) have the highest proportion.
Achieving the EU benchmark of 85% graduation rate for 2010 would imply that some additional 2 million young people (aged 20-24 years) would have graduated from upper secondary education.
Successful participation in the knowledge society requires that each individual is equipped
with a solid basic education at upper secondary education level. The Council agreed that, by
2010, at least 85% of 22-year-olds in the European Union should have completed
upper-secondary education. However, the completion rate has been fluctuating around 77% since
2000. New initiatives and redoubled efforts are needed if the target is to be reached. Best
performing EU countries are: Slovakia (91.5%), Slovenia (90.6%) and the Czech Republic
(90.3%).
4 million more adults would participate in lifelong learning within any four week period in 2010 if the EU benchmark of 12.5% participation rate was achieved.
6
integrated, coherent and inclusive lifelong learning strategy. Best performing EU countries
are: Sweden (34.7%), the United Kingdom (29.1%) and Denmark (27.6%).
At the age of 15 about 1 million out of over 5 million pupils are presently low performers in reading literacy. Reaching the European benchmark for 2010 would imply that 200.000 pupils would have to improve their performance in the field.
Acquiring basic competences is a first step to participation in the developing
knowledge-based society. In the fundamental domain of reading literacy, the most recent data suggests
that in 2003 about 20% of young people under the age of 15 in EU Member States achieved
only the lowest level of proficiency. The average performance did not improve compared to
2000. The EU has still a long way to go to reach the objective set by the Council of reducing
this percentage by 20% (to reach 15.5%) by 2010. Best performing EU countries are: Finland
(5.7%), Ireland (11%) and the Netherlands (11.5%).
The EU would need to double the amount it invests per higher education student (i.e. an increase of nearly 10 000 euros per student and year) to match the spending level in the USA.
The EU suffers from under-investment in human resources, especially in higher education.
Public investment in education and training as a percentage of GDP has grown slightly since
the adoption of the Lisbon strategy, and is comparable with levels in the USA (and higher
than in Japan). Rates of private investment in educational institutions seem to be (however,
data availability and comparability is limited) modest in most Member States compared with
the leading countries in the world, especially in higher education. There is also a need to
increase the efficiency of investment and ensure that it supports the development of high
quality education and training systems which are both efficient and equitable.
During the coming 10 years, the EU needs to attract at least 1 million new qualified teachers if those who will leave the profession due to retirement should be replaced.
The high proportion of older teachers in school education in the EU implies that within the
period 2005-2015 more than one million teachers in Europe will have to be replaced.
High-quality initial teacher training, in conjunction with a process of continuous professional
development, is necessary to equip the teaching body with skills and competences for its role
in the knowledge society over the coming decades.
Most EU students are not taught at least two foreign languages from an early age as
requested by the Barcelona 2002 European Council.
At present (2003), an average of only 1.3 and 1.6 foreign languages per pupil are taught in the
Member States in general lower- and upper-secondary education respectively. In vocational
programmes at upper secondary level the average number of foreign languages taught is
considerably lower. Taught language is however only the first step in the language acquisition
process. To reach the objective of proficiency in at least two foreign languages, major efforts
will have to be made by most countries.
Mobility of students within the Community programme Erasmus would have to more than double to reach the target of affecting 10% of the student population.
7
I.
INTRODUCTION
1.
The re-launched Lisbon Strategy
Drawing on lessons learnt from five years of implementing the Lisbon strategy, the European
Council in March 2005 decided on a fundamental re-launch of the strategy. It agreed to
refocus priorities on jobs and growth within an overall objective of Sustainable Development
and sought a stronger mobilisation of all appropriate national and Community resources.
3At
the same time the European Council sought a strengthening of monitoring procedures to give
a clearer picture of national implementation of the strategy.
The re-launched Lisbon strategy focuses on competitiveness, growth and productivity and
strengthening social cohesion. Even more than in its first phase, the revised Lisbon strategy
places strong emphasis on knowledge, innovation and the optimisation of human capital. The
onus put on European education and training systems is immense. Investing in research,
education and innovation play central roles in generating added value and contributing to the
creation of more and better jobs. Education and training are seen as critical factors to develop
EU’s long-term potential for competitiveness as well as for social cohesion.
2.
“Education and Training 2010” within the re-launched Lisbon strategy
The Lisbon strategy and the open method of co-ordination radically changed European policy
co-operation in the area of education and training. It provided a platform to discuss education
and training policies at European level, and the OMC offered the opportunity to build a
coherent policy framework without impinging on national competences.
Recognising the pivotal role of education and training in the knowledge society, the European
Council (Lisbon) invited Ministers of Education “to reflect on the concrete future objectives
of education systems,” and to concentrate on “common concerns and priorities.” Building on
this and further mandates, the European Council In Barcelona in March 2002 approved the
“Detailed Programme on the follow-up of the objectives of education and training systems”
for 2010
4and set the objective of “making [European] education and training systems a world
quality reference by 2010.”
5Following the adoption of the Detailed Work Programme, eight working groups were set up
to focus on one or more of the 13 concrete objectives. Comprising experts from 31 European
countries (EU member States, Acceding countries, Candidate countries and countries of the
European Economic Area), as well as other stakeholders and interested EU and international
organisations, their role is to support the national implementation of the common objectives
set for education and training systems through exchange of good practice, study visits, peer
learning activities, etc. A Standing Group on Indicators and Benchmarks was also set up to
assess progress towards the objectives, and to identify models of successful policy practice.
3
Presidency Conclusions. Brussels (2006) 4
Detailed Work Programme. 5
8
The Joint Interim Report, “Education and Training 2010: the success of the Lisbon strategy
hinges on urgent reforms”, adopted by the Commission and the Council in February 2004,
was the first evaluation of progress on the Detailed Work Programme. It identified three
levers as crucial to reaching the goal of making education and training systems in Europe a
world-wide quality reference: firstly, focusing reform and investment on the key areas for the
knowledge society; secondly, making lifelong learning a concrete reality; and thirdly,
establishing a “Europe of Education and Training.”
In the 2004 Joint Interim Report, the Council and the European Commission furthermore
undertook to review progress every two years on implementing the Education and Training
2010 work programme,
Thus a second draft joint interim report was adopted by the Commission in November 2005.
6Negotiations with the Council (through the Education Committee) led to adoption of the joint
report in February 2006. The report is based primarily on the 2005 national reports of the
Member States, EFTA-EEA countries, and the acceding and candidate countries. It delivered
a number of strong political messages to the European Spring Council of March 2006 in the
context of its first review of the revised Lisbon strategy. These included:
•
Education and training are critical factors if the EU’s long-term potential for
excellence, innovation and competitiveness, as well as for social cohesion, is to be
sustained. The dual role – social and economic – of education and training therefore
needs to be reaffirmed, as well as the need to ensure the development of high quality
systems which are both efficient and equitable. There can be no trade-off between these
two dimensions.
•
Education and training must be viewed as a priority for investment. The high returns it
provides substantially outweigh the costs and reach far beyond 2010.
•
Reforms in education and training are moving forward, but more substantial efforts are
required.
•
Investments, coupled with relevant quality assurance mechanisms, should be targeted
on areas where economic returns and social outcomes are high.
The present annual report
7expands on the analysis of national systems and progress towards
common objectives set out in the Joint Interim Report. It charts progress towards Europe’s
targets in the area of education and training using a framework of indicators and benchmarks,
and puts performance, where useful and possible, into a global perspective. The data gives an
indication of the direction European education systems are moving in and of how they are
contributing to Europe’s potential to fulfil the objectives set at Lisbon.
The report highlights key analytical messages emerging from a detailed statistical analysis of
progress towards the objectives that EU Council (Education) have established Based on
available statistics, it analyses the three strategic objectives, highlighting good performances;
it provides an overview of progress towards the 5 European benchmarks adopted by the
Council in May 2003; and it highlights the role of indicators and benchmarks within the
Education & Training 2010 process.
6
Communication from the Commission « Modernising education and training: a vital contribution to prosperity and social cohesion in Europe ». COM (2005) 549 30.11.2005.
7
9
10
II.
PERFORMANCE AND PROGRESS IN THE OBJECTIVE AREAS OF
EDUCATION & TRAINING 2000-2005
•
The Member States struggle to respond to the challenge of the five European
Benchmarks for 2010
Indicators are also used as instruments for monitoring progress towards common objectives
and benchmarks where these have been adopted. The stated ambition of becoming the most
dynamic knowledge-based economy in the world would be hollow if it did not entail the
measurement of progress. Therefore a range of guidelines and benchmarks are used to break
down the overall ambition into manageable goals in different policy areas. In this sense
indicators provide strategic guidance and steering for the Education and Training 2010
strategy – they function as the tools for evidence based policy at European level. By adopting
five European benchmarks in May 2003, the Council undertook a political commitment. By
setting-up measurable objectives, the Council indicated in which policy areas, in particular, it
expected to see clear progress. However, in 2006 these goals still pose a serious challenge for
education and training systems in Europe. There has been clear progress and accomplishment
of the EU benchmark on increasing the number of maths, science and technology graduates.
But there is too little progress against the benchmarks related most closely to the
knowledge-based society and social inclusion. Unless significantly more efforts are made in the areas of
early school leaving, completion of upper-secondary education, and key competences, a high
proportion of the next generation will face social exclusion, at great cost to themselves, the
economy and society.
Chart I.1
Overview on average performance levels
in the fields of the five European benchmarks
8Progress in the 5 benchmarks (EU average)
-20 -10 0 10 20 30 40 50 60 70 80 90 100
2000 2001 2002 2003 2004 2005 2006 2007 2008 2009 2010
Year 2 0 1 0 b e n c h m a rk s = 1 0 0 MST graduates
Lifelong learning participation
Early school leavers
Upper secondary completion
Low achievers in reading
progress required
8
11
As regards lifelong learning there have been many breaks in time series, which overstate
progress, especially in 2003, therefore the line 2002-2003 on LLL participation is dotted. For
low achievers in reading (data from PISA survey) there are only results for 16 EU countries
and for two years.
Key results
−
As regards the number of MST graduates the benchmark is likely to be over-achieved, the
progress required has already been achieved in 2000-2003. However, progress in reducing
the gender imbalance was more limited.
−
Lifelong learning participation is only on track as a result of breaks in series in several
countries, which led to higher (but more accurate) participation rates and overstate overall
progress.
−
There is constant improvement as regards early school leavers, but faster progress is
needed in order to achieve the benchmark.
−
As regards upper secondary attainment there has been only little progress.
−
Results for low achievers in reading have also not improved (but there are only two data
points for that).
Use of weighted averages versus arithmetic averages
The EU averages produced by Eurostat and used for measuring progress show the weighted
average for EU 25 (data are mostly weighted by the reference population relating to the
indicator). The six largest countries determine about three quarters of the weighted average,
while the share of the six smallest countries is only about 1%. Using arithmetic averages
(where every Member State represents 1/25) shows the impact of smaller countries is larger.
In policy terms this information might be as relevant because it shows the average
improvements over systems and is thus closer to the contribution of Member States. While
“weighted averages” of performance and progress show statistical data relating to the
“average situation” of citizens in Europe, the “arithmetic average” shows the average national
situation of education systems in the Member States.
For four of the five benchmarks (low achievers in reading, early school leavers, upper
secondary attainment, lifelong learning participation) performance is better and progress
higher if arithmetic averages are used. This is explained by the fact that some of the best
performing countries (for example the Nordic countries, Slovenia) have relatively small
populations. The only exception concerns the benchmark on the number of graduates in
maths, science and technology, where some small countries (Luxembourg, Malta, Cyprus)
with a limited higher education system, especially as regards MST faculties, perform below
average. Hence results for this indicator are better for the weighted average, where the impact
of these countries is smaller.
•
All Member States can learn from the good performers in the Union
12
Almost half of Member States are among the three leading countries in at least one of the five
areas. Good practice and expertise in the field of education and training are not, therefore,
confined to a few countries of the Union.
In the three benchmark areas which target school education (early school leavers,
upper-secondary education and low achievers in reading), we find strong performances in the new
Member States (Poland, Czech Republic, Slovenia and Slovakia, and also Latvia as regards
reducing the share of low achievers in reading), and in Finland, the Netherlands and Ireland.
In post-compulsory education, the leading countries are Finland, Ireland, Sweden, Denmark,
France and the UK (as regards increasing the number of MST graduates also Slovakia and
Poland). Only Finland and Ireland are among the best performers in both school and
post-compulsory education areas.
Best performers in the five benchmark areas
Benchmark area Concrete target 2010
Three best performers in the EU EU25 average
USA Japan
2005
Share of early school leavers (18-24) in EU.
No more than
10% Poland 5.5%
Slovakia
5.8%
Czech Rep.
6.4% 14.9% (:) (:)
Change in the share of low achievers in %, 2000-2003
Latvia
-40.2%
Poland
-27.6%
Finland
(-18.6%) +2.1% +8.4% +88.1%
% of low achievers in 2003
Ratio of low-achieving 15-year-olds in reading literacy in EU.
At least 20% decrease (to reach 15.5%)
Finland
5.7%
Ireland
11.0%
Netherlands
11.5% 19.8% 19.4% 19.0%
2005
Upper-secondary completion rate in EU (20-24).
At least 85% Slovakia 91.5% Slovenia 90.6%
Czech Rep.
90.3% 77.3% (:) (:)
Average annual increase 2000-2003
Slovakia
+17.6%
Italy
+12.8%
Poland
+12.0% +4.6% +2.7% -0.8%
Graduates per 1000 population in 2003
Ireland
24.2
France
22.2
UK
21.0 12.3 10.9 13.9
% females in 2003
Graduates in MST in EU
Increase of at least 15% (=100,000
graduates or 1.6% annual increase in period
2001-2010) Estonia 42.5 Cyprus 42.0 Portugal
41.5 31.1 31.9 14.4
2005
Adult
participation in lifelong learning in EU (25-64).
At least 12.5% Sweden 34.7% UK 29.1% Denmark
13
II.1. FIRST STRATEGIC OBJECTIVE
Improving the quality and effectiveness of education and training systems in the EU
Objective 1 is essentially about raising the quality and standard of learning to enable Europe
to become a more competitive and dynamic society. The objective concerns mainly improving
the skills and competences of European citizens in a cost effective manner to ensure that
Europe remains competitive internationally.
This objective area consists of the following specific objectives:
1.
Improving education and training for teachers and trainers
2.
Developing skills for the knowledge society
3.
Ensuring access to ICTs for everyone
4.
Increasing the recruitment to scientific and technical studies
5.
Making best use of resources
Data is available in all five specific objective areas allowing an appreciation of progress
achieved the last years.
1.1
Considerable teacher recruitment needs during the next decade
The economic and social changes in Europe proceeding from the knowledge revolution are
placing increasingly complex demands on the teaching profession. Schools and teachers are
expected to deal with different languages and student backgrounds, to be sensitive to culture
and gender issues, to promote tolerance and social cohesion, to respond effectively to
disadvantaged students and students with learning or behavioural problems, to use new
technologies, and to keep pace with rapidly developing fields of knowledge and approaches to
student assessment. This requires new and continuously developing knowledge and skills
among the teachers.
An increasing proportion of teachers in the EU is aged over 50 – in Sweden and Germany
more than 40% of teachers in both primary and secondary education are above this age. In
Germany and Italy (in secondary education), almost 70% of teachers will retire in the next 20
years.
9Chart II.1
Teachers aged 50 or older in secondary education (2003) (%)
(ISCED 2-3)Source: Eurostat (UOE data collection)
14
European BenchmarkBy 2010, the percentage of low-achieving 15-year-olds in reading literacy in the European Union should have decreased by at least 20% compared to the year 2000.
Overall, in countries for which data are available, the great majority of teachers retire from
their profession as soon as they are offered an opportunity to do so. Teachers whose salaries
rise significantly throughout their entire career, however, may be less inclined to leave the
profession than those whose salaries do not progress beyond the first few years of
experience.
10During the period 2000-2015 in the EU-25, the number of children aged 5–14 will decline
noticeably. However, to reach the EU benchmarks of no more than 10% early school leavers
and 85% completion of upper secondary education, on EU level more than a million
additional entrants into upper secondary education are required every year up to 2010.
11As a consequence of these developments i.e. retirement of teachers and the quest for
increasing student success rates, the need to recruit new teachers is also evident. A
conservative estimate of the replacement need put recruitment requirements at more than 1
million qualified teachers over the next 10 years. It will be crucial to make teaching an
attractive career choice, in order to recruit the best candidates and avoid teacher shortages.
To equip the teaching body with skills and competences for its role in the knowledge society
over the coming decades it is necessary to have both high-quality initial teacher education and
a process of continuous professional development keeping teachers up to date with the skills
required in the knowledge based society.
Main messages on teachers:
Considerable teacher recruitment needs during the next decade put focus on policies and initiatives to motivate older teachers to remain in the profession and to offer them
continuous professional development.
The attractiveness of teaching is on the policy agenda in several countries. Policy objectives are directed towards improving the image and status of teaching, improving teaching’s salary competitiveness, improving employment conditions, and securing an adequate supply of teachers in all subject areas.
1.2
Developing skills for the Knowledge Society
•
Key competences
All individuals need a core set of competences for employment,
social inclusion, lifelong learning and personal fulfilment.
These competences should be developed by the end of
compulsory education and should form the foundation for more
advanced or specialised training, either in higher education or
through other lifelong learning activities.
12Reading literacy is
hereby part of the key competence of communication in the
mother tongue and is thus analysed in the following text.
10
Eurydice, Key data 2005 page 217-218 11
The returns to various types of Investment in Education and Training. Final report to EC DG EAC. By London Economics. August 2005
12
See proposal for a Recommendation of the European Parliament and of the Council on key competences for lifelong learning (COM (2005) 548 final of 10.11.2005,
http://europa.eu.int/comm/education/policies/2010/doc/keyrec_en.pdf, the eight competences are
15
The European benchmark of a 20% decrease in the percentage of low-achieving 15-year-olds
in reading literacy by 2010 implies a decrease from 19.4% in 2000 to 15.5% by 2010 or
200
.
000 less low performing 15 year olds. The data from the PISA survey 2003, however,
show similar shares of low achievers compared to the 2000 study. There thus seems to be no
improvement in performance in the three years. In 2003, 19.8% of 15-year-old pupils in the
EU countries participating in the survey were found to be low achievers in reading literacy.
A further analysis
13of the PISA-data reveals that there is a high correlation between the mean
achievement scores and the share of students achieving low score levels in reading. Among
the countries participating in PISA, four out of the five countries where the share of low
scoring students is the lowest (Finland, Korea, Ireland, the Netherlands and Hong Kong
China) are in the top-five list as regards the average achievement scores in reading. Similarly,
among the four countries whose students achieve the lowest average scores in reading, three
are also among the four countries with the largest share of students performing at level 1 or
lower: Italy, Greece and Turkey. There thus seems to be no trade-off between equity and
performance and focussing on the important goal of reducing the share of low achievers thus
can also help to increase overall performance levels.
Chart II.2
Low achievers in reading literacy (2003)
(Percentage of pupils with reading literacy proficiency level 1 and lower in the PISA reading literacy scale )
Source: OECD PISA database
EU figure: weighted average based on number of pupils enrolled and data for 16 countries (NL, LU not representative in 2000, UK in 2003, SK not participating in 2000)
basic competences in science and technology; Digital competence; Learning to learn; Interpersonal, intercultural and social competences and civic competence; Entrepreneurship; Cultural expression. 13
16
Chart II.3
Progress 2000-2003 in the field of low achievers (%)
(Percentage of pupils with reading literacy proficiency level 1 and lower in the PISA reading literacy scale, 2003)
PISA progress -2,1 6,3 -10,9 7,8 1,3 -3,3 -29,4 -15,1 -26,5 40,2 35,3 9,7 -21,1 -41,8 27,6 16,3 18,6 -5,6 -27,6 52,9 -4,0 -60,0 -40,0 -20,0 0,0 20,0 40,0 60,0
EU BE CZ DK DE EE EL ES FR IE IT CY LV LT LU HU MT NL AT PL PT SI SK FI SE UK IS LI NO BG HR RO TR
PISA progress
Source: OECD PISA database
Countries which improved their performance significantly include Poland and Latvia. The
improvement in Poland and Latvia is considered by these countries to be the result of reforms
in the school system implemented around 2000 and impacting on the 2003 results. Belgium,
Denmark, Portugal, and Finland, have also witnessed moderate overall improvements, but
these differences are not statistically significant. On the other hand, there was a considerable
increase in the numbers of low achievers in Austria and Italy (results for Luxembourg, where
the numbers decreased, and for the Netherlands, where they increased, are not fully
comparable between the two surveys).
14While there was no progress in reading, average
scores in mathematics and in science in Europe improved since 2000 according to the PISA
survey.
In view of the fact that no progress was made between 2000 and 2003, it will be a major
challenge for many countries to improve their performance sufficiently to enable Europe to
achieve the target in 2010. However, it is hoped that some of the reforms which were
instigated by the PISA 2000 results will bear fruit in the next survey round in 2006.
15Main messages on basic competences
Average performance levels in reading did not improve in the EU in the period 2000-2003. Additional efforts will thus be needed in order to achieve the benchmark set for 2010.
The strong differences in performance between countries implies that there is room for improvement for many EU Member States and that the best performing countries hold good practice to learn from.
14
In the Netherlands the response rate was too low in 2000 to ensure comparability; in Luxembourg the reasons for the incomparability of the results lie in the mode of implementation in 2000; in Austria the weighting of vocational schools changed between the two surveys, thus the change in performance is overstated for this country.
15
17
European Benchmark
By 2010, at least 85% of 22-year-olds in the EU should have completed upper-secondary education.
Several of the EU countries with the highest performance at the same time show
relatively low variation in student achievement scores. Equity and high performance can thus be achieved without trade-offs. Focussing on groups with lower skills levels and on reducing skills disparities within the student population could thus also boost overall performance levels.
In all countries boys perform less well in reading than girls. The share of low performing boys has however to improve considerably in the future in order to reach the benchmark.
The relatively low performance of migrants is an issue that needs to be addressed, also considering the increasing share of students with a migration background. The strong differences between countries in the relative performance of migrants implies that there is room for improvement in countries were migrants perform strongly below average.
•
Completion of upper-secondary education
A high level of general educational attainment among the
working population is a prerequisite for a dynamic and
competitive European economy. At the individual level,
completing
upper-secondary
education
is
increasingly
important not just for successful entry into the labour market,
but also to allow students access to the learning and training
opportunities offered by higher education. Lifelong learning participation is strongly
correlated to the level of initial education reached.
Chart II.4
Completion of upper secondary education (2000, 2004 and 2005)
(Percentage of the population (20-24)
having completed at least upper-secondary education)
2000 2004 2005
Source: Eurostat (Labour Force Survey).
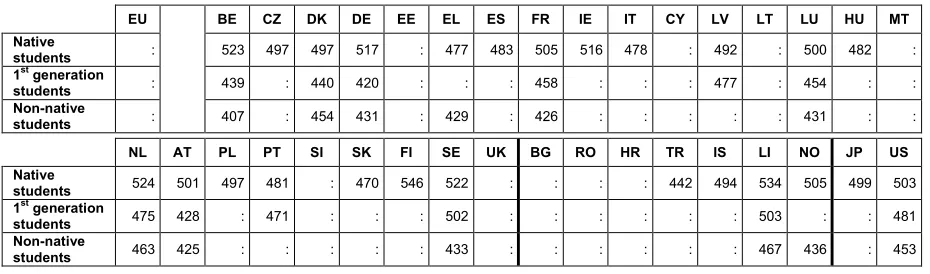
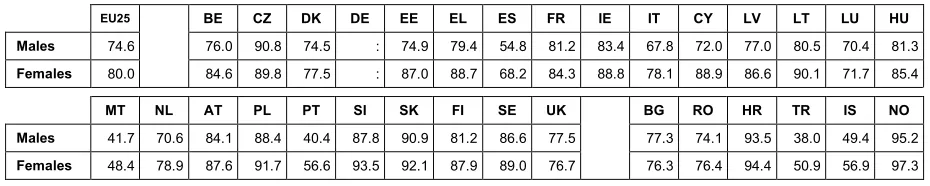
In 2005 the percentage of young people (20-24) in the EU with upper secondary education
reached 77%. It is noticeable that women have a 5 percentage point lead in the completion of
upper-secondary education among young people aged 20-24 in the EU25. Furthermore, the
performance gap between the attainment levels of national and non-nationals in the EU was
close to 20 percentage points in favour of nationals.
18
completion rate would have to improve by 1.5 percentage points per year in order to reach
85% by 2010 (compared to the current improvement rate of 0.2% per year). This benchmark
implies that 2 million more young people (18-24) would have graduated from upper
secondary level education in 2010 compared to 2005.
While the share of young people with upper secondary education has increased only little in
Europe some countries with a relatively low share, notably Portugal and Malta, have made
considerable progress in the recent past. It should also be noted that many of the new Member
States already perform above the EU benchmark set for 2010 and that three of them, the
Czech Republic, Slovakia and Slovenia, and in addition Norway and Croatia, already have
shares of over 90%.
Chart II.5
Progress 2000-2005 in the field of completion of upper-secondary education
Progress -percentage of the population aged 20 to 24 having completed at least upper secondary education 1,3 -0,7 -0,9 8,9 -3,2 5,9 -7,0 1,5 4,5 6,0 2,2 6,5 9,4 -8,3 -0,4 10,0 4,2 1,4 2,5 13,1 4,1 -3,2 -3,6 3,1 0,9 2,5 0,0 -0,8 12,9 15,0 1,3 -10,0 -5,0 0,0 5,0 10,0 15,0 20,0
EU25 BE C Z
DK DE EE EL ES FR IE IT CY LV LT LU
HU MT NL AT PL PT SI SK FI SE UK BG CR RO TR IS NO
Source: Eurostat (Labour Force Survey).
Main messages on upper secondary attainment:
The analysis on progress made in the Member States in the field of increasing the completion rates in upper secondary education shows three major areas of concern:
To find innovative ways to overcome the stagnation of upper secondary education attainment rates in some countries.
To address the issue of the low attainment levels of especially boys and migrants in upper- secondary education.
19
1.3
Strong growth in number of math, science and technology graduates
Europe’s future competitiveness in the
global economy will depend to a great
extent on its supply of scientific specialists
and on ensuring that they are put to good
use. Mathematics, science and technology
(MST), including computer sciences and engineering are vital for the development of the
knowledge-based and increasingly digital economy. The EU has a higher proportion and
larger absolute numbers of tertiary graduates in these areas than the USA or Japan. However,
it does not fully capitalise on this potential, as it has fewer active researchers (both in absolute
and relative terms) in the labour force than the US or Japan. Europe needs to develop and
increase the attractiveness of its research labour market, in order both to retain and make use
of its own talent and to attract researchers and scientists from outside Europe.
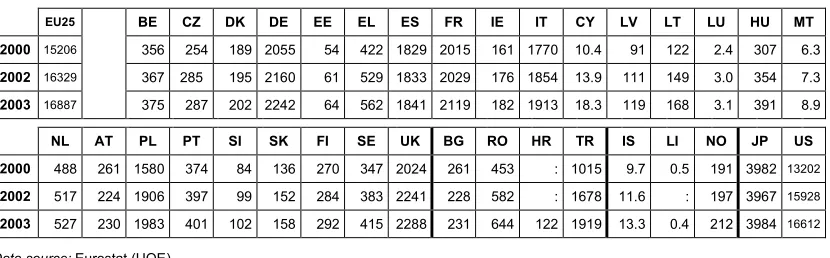
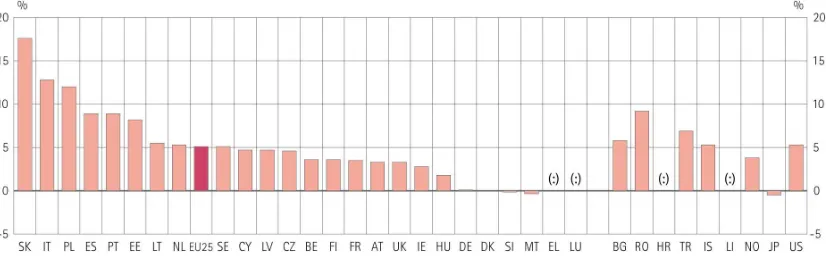
In 2003 the EU had 755 000 maths, science and technology graduates compared to about
430
.
000 in the USA, 230 000 in Japan and over 800 000 in China. The share of MST
graduates (as a % of all graduates) was at 24% slightly higher in the EU compared to the USA
(19%) and Japan (23%). However, measured per 1000 inhabitants aged 20-29 Japan (13.2)
has more graduates than the EU (12.2) or the USA (10.9). EU countries with a high ratio of
graduates in the population 20-29 included France, Ireland and the UK. While the European
growth rates are impressing they might be overstated by double-counting of graduates in the
move to a BA/MA structure (not considering short programmes/BA growth would reduce the
growth rate 2000-03 by about 1%). Growth in the number of MST graduates is moreover even
stronger in new competitors like India and China.
Data are furthermore not fully comparable between countries, as a result of different degrees
of double-counting of graduates. However, changes over time can to a certain degree be
compared. The data say in general more about the number of graduations than the number of
graduates (which is about 1/6 lower). A graduate can be found in some countries to be
counted three times during his/her studies: as bachelor (year 3), as masters (after additional
1-2 years) and as a new PhD (3 years later).
16The number of MST graduates increased in the period 2000-2003 in the EU by 16%
compared to a benchmark of 15% for 2010. This aspect of the benchmark has thus already
been achieved. Growth was strongest (> 10% per year in 2000-2003) in Italy, Poland and
Slovakia, while at the same time the number of graduates slightly declined in Denmark, Malta
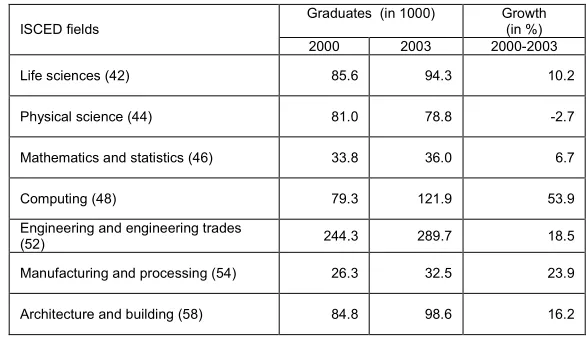
and Slovenia. While there has been a strong growth in computing (+53.9%) and engineering
(+18.8%) the number of graduates declined in this period in physical science (-2.7%) and
increased only slowly in mathematics and statistics (+6.7%).
16
It should be noted that even if double counting is taking place in the case of some countries, these statistical practices were know when a 15% increase of the figures by 2010 were decided by the Council.
European Benchmark 2010
20
Chart II.6
Tertiary graduates in mathematics, science and technology
(Number of tertiary graduates in MST per 1000 inhabitants aged 20-29)
2000 2002 2003
Source: Eurostat
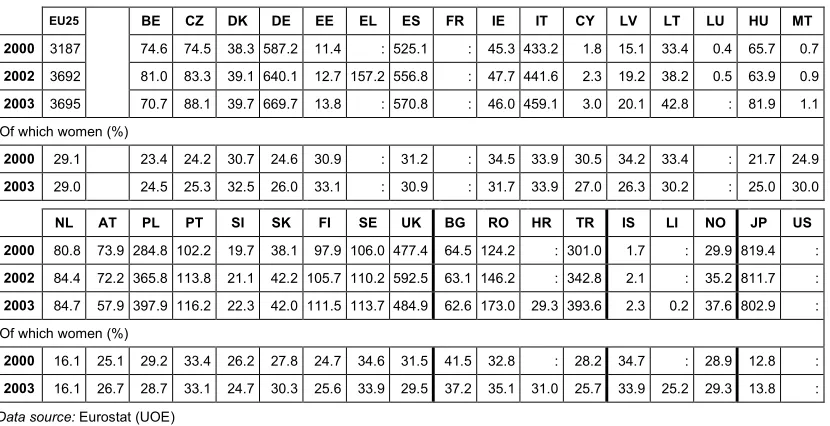
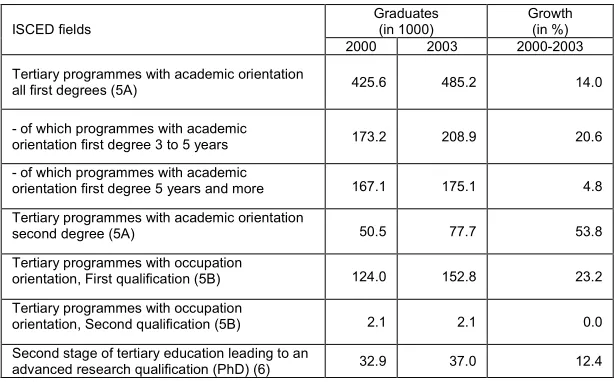
There was only limited progress in improving the gender imbalance: the share of female
graduates increased from 30.4% in 2000 to 31.1% in 2003. Estonia, Cyprus and Portugal had
the highest share of female graduates whereas Latvia, Estonia and Cyprus achieved most
progress in increasing the share of women in MST graduates. However, there are strong
differences in the share of female graduates between disciplines. While only 1/6 of
engineering graduates and 1/4 of computing graduates are female, half of mathematics and
statistics graduates are female and women predominate in life sciences (over 60%).
The stagnation in the share of female MST students in recent years implies that the share of
female graduates will not change much in coming years.
Chart II.7
Gender imbalance among MST graduates: female graduates
as a proportion of all MST graduates
2000 2002 2003
21
Chart II.8
Growth of tertiary graduates from mathematics, science and technology fields (%)
(2000-2003)
(Average annual growth)
Source: Eurostat
It is important to underline that demographic trends with smaller cohorts of young people in
the coming years might imply that growth in the number of graduates will slow down if math,
science and technology does not increase its share of the total student population. Rendering
these disciplines a popular choice among students is of high importance in that respect. This
issue is even more important in certain key areas such as physical sciences and in
mathematics and statistics where evidence suggests that student numbers are falling in recent
years.
Main messages on MST graduates:
In line with a strong growth in tertiary education participation there has also been a strong growth in the number of MST graduates in recent years. The overall growth target of the benchmark has thus already been achieved in 2003.
Despite the strong growth in the total number of math, science and technology graduates (MST) there is a decline or slow growth in certain fields like physical science and in mathematics and statistics. More efforts are needed to encourage young people to take up tertiary studies in these fields.
Only little progress has been achieved so far in improving the gender imbalance. More efforts are needed to attract more women to MST studies.
As regards research posts, MST graduates face bottlenecks in the labour market, partly a result of insufficient R&D financing. This also contributes to the tendency of some of the best brains to leave Europe.
1.4
ICT: ensuring access for everyone
The precept of the Lisbon European Council
17that every citizen should be equipped with the
skills needed to live and work in the new information society was based on the recognition
that the socio-economic potential of information technologies is directly related to their
17
22
accessibility. In later European Councils, (i.e. Stockholm
18, Barcelona
19and Brussels
20) this
message was reiterated, with particular stress on the contribution of Information and
Communication Technology (ICT) skills to labour-market employability. The educational use
of ICT accordingly features prominently in the Commission's e-learning strategy, as set out in
its e-learning action plan,
21and in the eLearning Programme
22, one of the four action lines is
fostering digital literacy.² The Proposal for recommendation on key competences of
November 2005 considers ICT skills as part of the basic skills and as being also essential for
learning to learn.
Data from the Eurostat ICT household survey show that in 2005 in EU 25, 70% of students
(16 years and older, the data do not allow a breakdown between secondary and tertiary
education) used a computer at the place of education, while 60% used the Internet.
In 2003, despite noticeable progress in a number of countries, there were still many countries
within the EU that had a relatively high number of pupils to each computer (chart II.9 based
on pupils aged 15). The four countries with more than twenty pupils to a computer are
Greece, Poland, Latvia and Slovakia. In 2003 Denmark, Luxembourg and Scotland had seven
or fewer pupils to a computer.
Chart II.9
Number of pupils per computer in schools attended by pupils aged 15 (2000, 2003)
2000 2003
Countries not having participated in the data collection Difference not significant (:)Data not available
Source: OECD, PISA 2000 and 2003.
18
Presidency Conclusions European Council, Stockholm, 2001, paragraph 10. 19
Presidency Conclusions European Council, Barcelona, 2002, paragraph 33. 20
Presidency Conclusions European Council, Brussels, 2003, paragraph 40. 21
European Commission, Directorate General Education and Culture The e-Learning Action Plan: designing tomorrow's education, Brussels, 2001.
22
23
As regards Internet connections of schools the data from PISA show that in Denmark,
Luxembourg, the Netherlands, Austria, Poland, Finland, Sweden and UK-Scotland, more than
80% of school computers are connected to the Internet. In Belgium (Fr), Greece, Ireland,
Italy, Latvia, Portugal and Slovakia this is the case for less than 70% of computers. The
countries with the three highest ratios of Internet-connected school computers also have some
of the lowest pupil-computer ratios.
Strong progress as regards the number of pupils per computer has been made in the period
2000-2003 in Portugal, Greece, Latvia and Poland. Especially the Portuguese progress has
been spectacular moving from about 70 pupils per computer to less than 20. It illustrates well
how rapid changes in some cases can be in the field ICT and highlights the need of up to date
data.
Not only are there more computers in schools, almost all schools have today internet access
and the great majority of computers in schools are connected.
Apart from the infrastructure, which is the very condition for progressing as concerns ICT
skills in schools, the quantity and quality of ICT usage are essential for impacting on learning
outcomes. While the use of ICT is positively correlated to the increasingly important ICT
skills, the relation between the frequency of ICT usage by pupils and their skills in
mathematics and reading is less straightforward. Data on the relation between the intensity of
ICT usage and mathematics and reading skills from the 2003 OECD PISA survey implies that
there is an optimum level of ICT usage as regards these skills and that beyond this optimum
more does not automatically mean better.
Main messages on ICT:
▪
ICT penetration in schools is continuously increasing. In most EU countries, in 2003 more than 70% of the available school computers were connected to the Internet.▪
Despite considerable progress since 2000, there were in 2003, however, still many countries within the EU with a high number of pupils to each computer.▪
There is a positive correlation between the availability of computers at school and average learning outcomes.▪
However, as regards ICT usage, more is not always better. Data from PISA 2003 on frequency of ICT usage and pupils performance in mathematics and reading imply that there is an optimum level of ICT usage. Beyond this level quality of use is more important than quantity.1.5
Considerable growth in investment in education
Investment in human capital through is one of the key factors for strengthening Europe’s
position in the knowledge economy and to increasing social cohesion in the 21st century. The
European Council of March 2000 in Lisbon acknowledged this by calling for “a substantial
annual increase in per capita investment in human resources”.
2323
24
Since the population is relatively stable and since GDP is increasing a growth in the
percentage of GDP spent on education can be considered as a proxy for an increase in per
capita investment in human resources
There were considerable variations between countries in their levels of total
public
expenditure on education and training as a percentage of GDP in 2002 (Chart II.8). Denmark
has the highest relative spending at more than 8% of GDP, followed by Sweden at over 7%.
While most countries fall within the 4-6% bracket, in Greece public spending on education
amounts to slightly less than 4% of GDP.
24Chart II.10
Total public expenditure on education as a % of GDP (2000, 2001 and 2002)
2000 2001 2002
Source: Eurostat
In 2002 total public expenditure on education as a percentage of GDP increased in 19 EU
countries over 2001, while decreasing in six. In particular the new Member States increased
public spending on education and training, with the Czech Republic, Cyprus, Hungary and
Slovakia showing an increase of more than 0.25% percentage points of GDP. Of the old
Member States the UK showed the strongest increase in spending. A large part of the growth in
spending on an EU level in 2002 is in fact due to the strong growth in the UK. Spending in the
EU25 increased from 4.94% of GDP in 2000 to 5.22% in 2002, an increase of 0.28 percentage
points. It thus amounted to about 500 billion Euro in 2002, a real increase of about 8%
compared to 2000 (if based on constant 1995 prices).
In the light of the trend shown above, it may be concluded that in the period 2000-2002 the EU
made progress towards the Lisbon objective of ensuring “a substantial annual increase in per
capita investment in human resources.”
However, public spending as a % of GDP did not increase in all Member States and private
spending in this period stagnated. An increased private contribution is considered necessary to
increase availability of resources and improve efficiency of spending.
24
25
Chart II.11
Expenditure on educational institutions from private sources in % of GDP (2000, 2002)
2000 2001 2002
Source: Eurostat
There is furthermore still underinvestment in certain fields like higher education and
vocational training. Spending per student in most Member States increases by education level
and is thus on average highest at tertiary level and lowest at primary level. The strong growth
in the number of tertiary students implies a need for additional investment.
In 2002 public spending on tertiary education (for all activities, including both education and
research) in the EU amounted to 1.14% of GDP (of which direct public spending 0.95%)
compared to 1.40% in the US (1.17%). There was in 2002 an even larger gap in private
spending on higher education: 0.2 % in the EU and 1.42 % in the US. To match the US level
of public and private spending
25the EU would have to spend an additional 140 billion Euro
per year from public and private sources on tertiary education.
25
26
II.2.
SECOND STRATEGIC OBJECTIVE
Facilitating the access of all to education and training systems
This Strategic Objective of the “Education and Training 2010” programme, “Facilitating the
access of all to education and training systems”, contains three objectives focused on open
learning environment, making learning more attractive and supporting active citizenship,
equal opportunities and social cohesion. It brings the issue of the equity of the education and
training systems to the forefront.
According to this strategic objective, all citizens should have equal access to education and
training.
26The needs of vulnerable groups, particularly people with disabilities and people
with learning difficulties, as well as those living in rural/remote areas or having problems in
reconciling their work and family commitments should especially be addressed. The need to
focus on these groups of the population was re-affirmed by both, 2004 and 2006 Joint
Council/Commission reports on implementation of the ‘Education and Training 2010’ work
programme.
27The foundations for the participation in education and training, and therefore for successful
personal development and professional life, are already set in early childhood. Participation in
pre-primary education is crucial for those children who are at risk of being excluded due to
various factors (for example low economic and educational status of their parents or special
needs).
However, current demographic trends imply that Europe will need to rely not only on
well-educated younger generations, but also on older workers – it is imperative to increase the
labour-market participation of older people, women, migrants and minority and raise overall
employment levels.
28The integration (or re-integration) of these groups into the labour force
will entail providing them with the skills and competencies they need to participate in a
fast-paced knowledge-based economy. Moreover, all citizens will need to up-date their skills and
qualifications throughout life for continuing personal and professional development.
Young people who leave education without recognised qualifications are at a disadvantage in
the labour market. Their personal and social development is curtailed and they are at
increased risk of poverty and social exclusion. First of all certain groups of early school
leavers are likely to experience greater disadvantage than others, in particular those who leave
the system before completion of primary education.
26
In this report ‘access’ is understood as a right to participate ('participation'). Participation means that an individual has a real opportunity to experience education or training. It is different from another, more 'formal' definition of access, which stresses the importance of having the right to participate in education and training, without being concerned with whether this right can actually be exercised in practice.
27
2004 joint progress report of the Council and the Commission on the implementation of the Education & Training 2010 work programme “Education & Training 2010: the success of the Lisbon strategy hinges on urgent reforms” and Draft 2006 joint progress report of the Council and the Commission on the implementation of the Education & Training 2010 work programme “Modernising education and training: a vital contribution to prosperity and social cohesion in Europe”.
28
27
European Benchmark
By 2010, the European Union average level
of participation in lifelong learning should be at least 12.5% of the adult working-age population (working-age 25-64)
The necessity of increasing particularly the participation of adults in lifelong learning and of
reducing the number of young Europeans who leave the school with no more than lower
secondary education has led the Council to establish benchmarks in these two areas towards
the strategic objective of facilitating the access of all to education and training. Moreover,
these two targets form together with a target to raise the educational attainments levels part of
the European Employment Strategy since 2003. But the progress in these areas is rather slow.
Therefore, the European Council of 23-24 March 2006 itself has again stressed that efforts
should be intensified to reach the agreed targets in reducing early school leaving and raising
educational attainment levels.
29Questions of citizenship, equal opportunities and social cohesion are essential dimensions of
education and training. Learning democratic values and democratic participation by all school
partners should be promoted to prepare people for active citizenship.
30However, the absence
of internationally comparable data on active citizenship (as indeed, a standard definition of
what active citizenship means or includes) hinders analysis in this area.
This part of the report is focused on participation of European population in education and
training within a lifelong perspective as well as on issue of early school leaving.
2.1
Increasing participation in education and training within a lifelong perspective
Making lifelong learning a reality requires inclusive and
coherent education and training systems, which are attractive
both to young people and adults, as well as comprehensive
strategies for lifelong learning which overcome the traditional
barriers between the various parts of formal education and
training and non-formal and informal learning. Member States
have actually committed themselves to develop truly coherent
and comprehensive lifelong learning strategies by 2006.
•
Approaching nearly universal participation levels in pre-primary education
A target to increase participation in pre-primary education to 90% of all children from the age
of 3 years to the beginning of compulsory schooling was set by the Barcelona European
Council of 2002 primarily in view of promoting the integration of young women on the labour
market.
31However, this employment related objective has obvious impact on educational and
social development of children concerned.
Pre-primary education plays an important role in children's emotional and cognitive
development, facilitates the transition from playful learning to formal learning and contributes
to children's success during compulsory schooling, including positive impact on combating
early school leaving and on further participation in lifelong learning (both targets covered by
European reference levels (benchmarks) for 2010).
3229
Presidency Conclusions European Council, Brusels 2006, point 38. 30
The focus on increasing social cohesion was affirmed especially by the Laeken European Council in December 2001which was the basis for the definition of a list of social inclusion indicators (the “Laeken indicators”). 31
Presidency Conclusions European Council, Barcelona, 2002. 32