COMMISSION OF THE EUROPEAN COMMUNITIES
Brussels, 02/10/2007
SEC(2007) 1284
COMMISSION STAFF WORKING DOCUMENT
PROGRESS TOWARDS THE LISBON OBJECTIVES IN EDUCATION AND
TRAINING
INDICATORS AND BENCHMARKS
CONTENTS
I. INTRODUCTION ...5
II. PERFORMANCE AND PROGRESS IN EDUCATION AND TRAINING 2000-2006 ...11
III. PERFORMANCE AND PROGRESS BY POLICY AREA ...20
1. IMPROVING EQUITY IN EDUCATION AND TRAINING ...22
Main messages...22
Introduction ...23
1.1. Access for all to education and training...24
1.1.1 Significance of pre-primary education... 24
1.1.2 Early school leavers ... 28
1.1.3 Pupils with special education needs... 34
1.1.4 Different policies focused on education of pupils with special education needs ... 35
1.1.5 Education of pupils with special education needs depending on the type of difficulty ... 38
1.1.6 Education of pupils with disabilities... 39
1.1.7 Education of pupils with learning difficulties... 41
1.1.8 Education of pupils with disadvantages... 43
1.1.9 Gender dimension of education of pupils with special needs ... 44
1.1.10 Different national policies and approaches to data collection on education of pupils with special education needs... 44
1. 2. Equity of conditions in education and training...45
1.2.1 Parental education and achievement in compulsory education... 45
1.2.2 Structure of the family - Single-parent families... 47
1.2.3 Parents’ occupational status... 49
1.2.4 Migrant background of pupils and achievement at school... 50
1.2.5 Inequalities in education created by schools as institutions... 55
1.2.6 Socio-economic background and access to higher education ... 56
2. PROMOTING EFFICIENCY IN EDUCATION AND TRAINING ...59
Main messages...59
Introduction ...59
2.1 Indicators for monitoring performance and progress...60
2.2 Performance and progress on investment in human resources (the financial input side)...61
2.2.1 Public expenditure on education and training - total spending ... 62
2.2.2 Public expenditure on education and training by level ... 64
2.2.3 Private expenditure on education and training... 65
2.2.4 Spending per student by level ... 66
3. MAKING LIFELONG LEARNING A REALITY ...71
Main messages...71
Introduction ...72
3.1 Completion of upper secondary education – EU benchmark...72
3.1.1 Completion of upper secondary education by gender... 75
3.1.2 Completion of upper secondary education by persons with a migrant background... 75
3.2 Access for older learners to tertiary education...76
3.3 Participation by adults in lifelong learning...77
3.3.1 Participation by adults in lifelong learning – EU benchmark ... 77
3.3.2 Participation by adults by kind of education (formal or non-formal) ... 80
3.3.3 Participation in lifelong learning by adults with low educational attainment ... 80
3.3.4 Participation in lifelong learning by the older population ... 81
3.4 Adult skills...82
3.5 Further development of indicators...86
4. KEY COMPETENCES AMONG YOUNG PEOPLE ...88
Main messages...88
Introduction ...89
4.1 Which are the key competences?...89
4.2 Developing key competences...90
4.2.1 Literacy in reading, mathematics and science ... 90
4.2.2 ICT skills ... 93
4.2.3 Civics skills... 95
4.2.4 Language learning ... 98
4.3 Further development of indicators...101
4.3.1 Learning to learn skills ... 101
4.3.2 European language indicator ... 102
5. MODERNISING SCHOOL EDUCATION ...104
Main messages...104
5.1 School management...104
5.1.1 Level of decentralisation of education ... 105
5.1.2 Evaluation ... 105
5.1.3 School leadership... 106
5.2 Professional development of teachers and trainers...107
5.3 Schools as multi-purpose local learning centres...108
6. MODERNISING VET ...111
Main messages...111
Introduction ...111
6.1 Indicators for monitoring performance and progress at the EU level...111
6.2 Participation and progression in initial VET
...
1126.3 Structural differences in VET systems
...
1156.4 Financing vocational education and training
...
1166.5 Outputs and outcomes of VET
...
1186.6 Labour market status of VET graduates
...
1197. MODERNISING HIGHER EDUCATION ...120
Main messages...120
Introduction ...121
7.1 Mathematics, science and technology (MST) graduates...122
7.1.1 Indicators for monitoring performance and progress... 123
7.1.2 General student population trends ... 123
7.1.3 Students enrolled in MST ... 125
7.1.4 Number of graduates in mathematics, science and technology (MST)... 125
7.1.5 Gender imbalance among graduates in MST ... 129
7.2 Mobility in higher education...131
7.2.1 Introduction ... 131
7.2.2 Foreign students in tertiary education... 133
7.2.3 Tertiary students enrolled outside their country of origin... 135
7.2.4 Flow of students... 136
7.2.5 Mobility of students in the Erasmus programme ... 137
7.3 Quality of higher education institutions...140
8. EMPLOYABILITY...144
Main messages...144
Introduction ...144
8.1 Educational attainment of the adult population ...145
8.2 Labour market developments...145
8.3 School-to-work transition patterns for youths ...146
8.4 Other outcomes at individual level ...151
LIST OF ABBREVIATIONS...154
BIBLIOGRAPHY ...156
ANNEX 1: 16 core indicators for monitoring progress towards the Lisbon objectives in education and training...168
ANNEX 2: Statistics...170
LIST OF TABLES AND GRAPHS
Chart II.1: Overview of progress towards the five European benchmarks in EU-27... 11
Table II.1: Position of each country (latest year available) and progress achieved since 2000... 13
Table II.2: Progress in EU-27 towards the benchmarks based on arithmetic averages of Member States' performance (based on Eurostat data) ... 14
Table II.3: Best performers on the benchmarks relating to secondary education... 14
Table II.4: Best performers on the benchmarks relating to tertiary education and lifelong learning .. 15
Table II.5: Best performers on other key indicators ... 16
1. IMPROVING EQUITY IN EDUCATION AND TRAINING Table 1.1: Participation in pre-primary education and school performance in reading ... 26
Chart 1.1: Participation rates of 4-year-olds in education, 2000-2005 ... 27
Chart 1.2: Early school leavers – benchmark for 2010... 29
Chart 1.3: Early school leavers by groups of country, 2006... 30
Chart 1.4: Early school leavers, 2006 ... 30
Chart 1.5: Early school leavers, 2000 and 2006 ... 31
Chart 1.6: Status dropouts among persons aged 16-24 in the USA, 1970-2004... 33
Chart 1.7: Percentage of pupils in compulsory education with special needs in segregated settings, 1999/2001 - 2004/2006... 36
Chart 1.8: Percentage of the total population in compulsory education with special education needs educated in ordinary compulsory education (2004-2006) ... 37
Chart 1.9: Percentage of children in pre-primary education receiving additional resources for disabilities (Category A) (2001) ... 39
Chart 1.10: Percentage of pupils with disabilities receiving additional resources over the period of compulsory education (2001) ... 40
Chart 1.11: Percentages of pupils with disabilities receiving additional resources over the period of compulsory education by location (2001)... 40
Chart 1.12: Proportion of all pupils receiving additional resources in special schools by age... 41
Chart 1.13: Percentage of all pupils in compulsory education receiving additional resources over the period of compulsory education in cross-national Category B, 2001... 42
Chart 1.14: Distribution of pupils with learning difficulties (Category B) receiving additional resources over the period of compulsory education, by location (2001) ... 42
Chart 1.15: Disadvantaged pupils receiving additional resources over the period of compulsory education as a percentage of all pupils in compulsory education, 2001 ... 43
Table 1.2: Difference between pupils with mothers with upper secondary education and pupils with mothers with primary or lower secondary education, 2003... 46
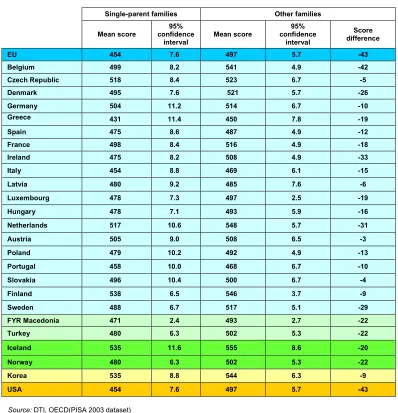
Table 1.3: Family structure and performance on the PISA 2003 mathematics scale... 48
Table 1.4: Achievement scores for pupils whose parents have low occupational status and pupils whose parents have high occupational status, 2003... 49
Table 1.5: Difference in average score between native pupils and pupils with foreign background, PISA 2003... 50
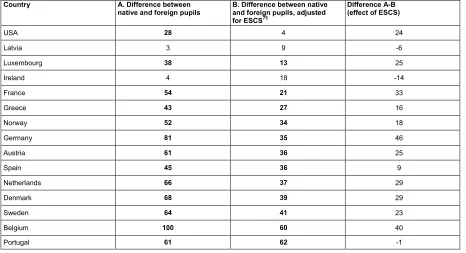
Table 1.6: Difference in average score in mathematics between native and foreign pupils, adjusted for socio-economic background, 2003... 52
Table 1.7: Average reading scores among 15-year-old non-native pupils attending schools with different densities of non-native pupils... 55
2. PROMOTING EFFICIENCY IN EDUCATION AND TRAINING
Chart 2.1: Total public expenditure on education as a percentage of GDP ... 62
Table 2.1: Spending on education as a percentage of GDP, 2000-2004... 63
Table 2.2: Public expenditure on education as a percentage of GDP by ISCED level ... 64
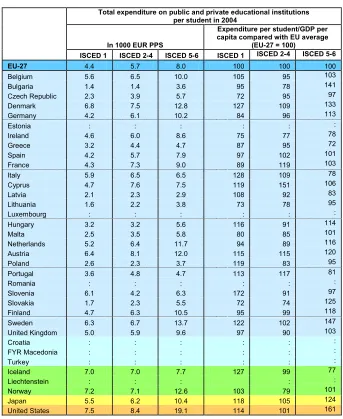
Table 2.3: Spending per student in 2004... 67
Table 2.4: Efficiency for compulsory education in selected European countries (quantity inputs) ... 69
Table 2.5: Efficiency for compulsory education in some European countries (financial inputs) ... 70
3. MAKING LIFELONG LEARNING A REALITY Chart 3.1: Completion of upper secondary education by young people aged 20-24 ... 73
Chart 3.2: Completion of upper secondary education by young people aged 20-24, 2006 ... 73
Chart 3.3: Percentage of the population (20-24) having completed at least upper secondary education by group of countries, 2006 ... 74
Chart 3.4: Completion of upper secondary education by young people aged 20-24, 2000-2006... 75
Table 3.1: Completion of upper secondary education by young people aged 20-24, by gender, 2006 . 75 Chart 3.5: Completion of upper secondary education by young people aged 20-24 by nationals and non-nationals, 2006... 76
Chart 3.6: Age distribution of tertiary students ... 77
Chart 3.7: Lifelong learning – benchmark for 2010 ... 78
Chart 3.8: Participation by adults in lifelong learning... 78
Chart 3.9: Participation by adults in lifelong learning... 79
Chart 3.10: Percentage of population aged 25-64 participating by kind of education... 80
Chart 3.11: Participation in lifelong learning by adults with less than upper secondary education ... 81
Chart 3.12: Participation in lifelong learning by age and educational attainment (EU-25), 2006... 82
Chart 3.14: Individuals’ level of basic computer skills (2005), EU-25 ... 83
Chart 3.15: Individuals not using computers or the Internet (2005), EU-25 ... 85
Chart 3.16: Participation by adults aged 16 to 74 in a training course (of at least 3 hours) on computer use (2005), EU-25... 86
4. KEY COMPETENCES AMONG YOUNG PEOPLE Chart 4.1: Low achievers in reading on the PISA reading literacy scale... 91
Chart 4.2: Percentage of pupils with reading literacy proficiency level 1 and lower on the PISA reading literacy scale, 2000-2003 ... 92
Table 4.1: Scores of 19 European countries based on the preliminary active citizenship composite indicator and its components (2002 results) ... 98
Table 4.2: Average number of foreign languages learned and percentage of pupils learning English, French and German in general and pre-vocational upper secondary education. 2005 .... 100
5. MODERNISING SCHOOL EDUCATION Chart 5.1: Location of decision-making authority to determine the overall amount of public expenditure earmarked for schools providing compulsory education, public sector or equivalent, 2002/03... 105
Chart 5.2: Use made of findings from the evaluation of pupils and schools for monitoring education systems at primary and secondary level, 2002/03 ... 106
Table 5.3: Teacher participation in professional development, excluding ICT-related activities (2001) 108 Table 5.4: Teacher participation in ICT-related professional development activities (2001)... 108
6. MODERNISING VET
Chart 6.1: Pupils in vocational programmes at upper secondary education (ISCED level 3) as a
percentage of all upper secondary education pupils. 2004 ... 112
Chart 6.2: Participation patterns in VET at ISCED level 3 for 15- to 19-year-olds. EU-25, 2000-2004. ... 113
Chart 6.3: Participation patterns in VET at upper secondary level for 15- to 19-year-olds, in type A, B and C programmes. EU-25, 2000-2004. ... 114
Table 6.1: Structural features of the school systems across the EU Member States (2003) ... 115
Table 6.2: Public expenditure on secondary education by programme orientation (2003) ... 117
Table 6.3: Expenditure per full-time equivalent pupil in secondary education by programme orientation (in 1000 EUR PPS, 2003)... 118
7. MODERNISING HIGHER EDUCATION Table 7.1: Tertiary students (2000-2005)... 124
Chart 7.1: Trend in number of tertiary students 1991-2005 (1999 = 100)... 125
Table 7.2: Graduates in MST... 126
Chart 7.2: Total number of tertiary (ISCED level 5A, 5B and 6) graduates in mathematics, science and technology, 2000-2005... 127
Chart 7.3: Average annual growth rate 2000-2005 by number of graduates in MST per 1000 inhabitants aged 20-29 in 2005 and gender balance ... 128
Table 7.5: Females as a proportion of all MST graduates and students... 130
Chart 7.4: Gender imbalance among MST graduates: female graduates as a proportion of all MST graduates ... 131
Table 7.6: Percentage of female graduates by field (EU-27)... 131
Table 7.7: Foreign tertiary students as % of all tertiary students (ISCED levels 5 and 6) enrolled in the country (2000-2004) ... 134
Table 7.8: Main countries of origin of non-European students studying in the EU... 135
Table 7.9: Percentage of all tertiary students (ISCED levels 5 and 6) enrolled outside their country of origin... 136
Table 7.10: Flow of students into and out of the EU. 2005 ... 137
Chart 7.5: Mobility of students in the Erasmus programme ... 137
Chart 7.6: Outward mobility of Erasmus students, 2004/05 (students sent per 1000 students) ... 138
Table 7.11: Inward and outward mobility of Erasmus students, 2004/05... 139
Table 7.12: Ranking of world universities by broad subject fields (ARWU), 2007... 141
Table 7.13: Results of two university rankings (ARWU and THES) ... 142
Table 7.14: Weights used in the ARWU and WUR rankings... 143
8. EMPLOYABILITY Chart 8.1: Non-student inactivity rates among 15- to 24-year-olds in selected EU countries (Total population minus participation rate in formal education and activity rate) ... 147
Table 8.1: School-to-work transition history of youths in selected EU countries (1994-2000) ... 148
Table 8.2: Incidence of job mismatches by fields of study in selected EU countries (2000), in % .. 150
Chart 8.2: Education and its benefits ... 152
ANNEXE 2
Table A1.1: Comparison of the share of children with disabilities receiving additional resources in pre-primary and primary education (percentage of all children in that phase of
education) ... 170
Table A.2.1: Efficiency for compulsory education in some European countries (quantity inputs)... 171
Table A.4.1: List of survey questions used for baseline indicators on civics... 172
Table A.6.1: Policy overview – Copenhagen-Maastricht-Helsinki, some concrete outcomes of cooperation in VET at the European level... 173
Table A.6.2: Participation patterns in upper secondary education (ISCED level 3) ... 174
Table A.6.3: Attainment and progression patterns at the upper secondary level of education (2004 or latest year available) ... 174
Table A7.1: Life science science graduates (field 42) 2000-2005 ... 175
Table A7.2: Physical science graduates (field 44) 2000-2005 ... 176
Table A7.3: Mathematics and statistics graduates (field 46) 2000-2005... 177
Table A7.4: Computing graduates (field 48) 2000-2005... 178
Table A7.5: Engineering, manufacturing and construction graduates (field 5) 2000-2005 ... 179
Table A.7.6: Inward and outward mobility of Erasmus teachers by country 2005/06 ... 180
Table A.7.7: Erasmus student mobility 2005/2006 - Total number of students by country... 181
Table A.8.1: Educational attainment of the adult population (aged 25-64) in % ... 182
Table A.8.2a: Labour force statistics by educational attainment of 15- to 24-year-olds (d) 2006 ... 183
Table A.8.2b: Labour force statistics by educational attainment of 25- to 64-year-olds (d)... 184
Table A.8.3: Employment rates in the EU (d) ... 185
Table A.8.4: Labour force statistics in the EU (d)... 186
Table A.8.5: Education and working status of 15- to 24-year-olds in the EU (2000-2005)... 187
I.
INTRODUCTION
“Progress towards the Lisbon objectives in education and training” is the fourth in the series of annual reports examining performance and progress in education and training systems in the EU under the Education and Training 2010 work programme. For the first time, it uses the core indicators identified and adopted by the Education Council in May 2007.
The purpose of this series of reports is to draw on indicators and benchmarks in order to provide strategic guidance for the Education and Training 2010 programme and to set out the evidence available on progress towards the objectives agreed by ministers. Use of indicators and benchmarks in this way responds to the wishes of the Education Council which set out its views early in the process and has sought progressively to develop this framework throughout the process. The previous progress reports (2004, 2005 and 2006) therefore focused on the three strategic objectives and 13 detailed objectives adopted by the Education Council in 2002. Monitoring was based on 29 indicators and the five benchmarks for Europe’s educational performance levels adopted by the Council in May 2003. The reports gave progressively more detailed analyses of performance and progress, benefiting from time series of data available for a period of up to five years (2000-2005) and from a series of targeted studies launched by the Commission in specific areas such as access to education, pupil performance, early school leavers, civics education, financing of education and mobility.
On 25 May 2007 the Education Council adopted conclusions on a coherent framework of 16 core indicators for monitoring progress towards the Lisbon objectives in education and training1. The 2007 report is based on an in-depth analysis of these 16 core indicators:
16 core indicators for monitoring progress towards the Lisbon objectives in education and training
1) Participation in pre-school education
2) Special needs education
3) Early school leavers
4) Literacy in reading, mathematics and science
5) Language skills
6) ICT skills
7) Civic skills
8) Learning to learn skills
9) Upper secondary completion rates of young people
10) Professional development of teachers and trainers
11) Higher education graduates
12) Cross-national mobility of students in higher education
13) Participation of adults in lifelong learning
14) Adult skills
15) Educational attainment of the population
16) Investment in education and training
1
Reflecting these indicators and the political priorities of the Education and Training 2010 programme, the report is structured in eight chapters as follows:
1. Improving equity in education and training; 2. Promoting efficiency in education and training; 3. Making lifelong learning a reality;
4. Key competences among young people; 5. Modernising school education;
6. Modernising vocational education and training (the Copenhagen process); 7. Modernising higher education (the Bologna process);
8. Employability.
The report highlights key messages emerging from detailed statistical analysis of progress towards the objectives set by the Education Council. Based on available statistics, qualitative information and research results, it analyses these eight policy objectives. The report provides an overview of progress towards the five European benchmarks adopted by the Council in May 2003. The data give an indication of the direction in which European education systems are moving and of how they are contributing to Europe’s potential to meet the objectives set in Lisbon.
The report was prepared by the Directorate-General for Education and Culture, in close cooperation with CRELL (the new research unit in the Joint Research Centre), Eurostat and the Eurydice European Unit.
The report shows that a number of EU Member States are already achieving world-best performances in specific areas, whereas others face serious challenges. It shows that there is real added value in exchanging information on best policy practice at European level and thus lays the foundation for further development of the policy exchanges and further improvement of the framework of indicators and benchmarks which underpins it.
The policy framework - the re-launched Lisbon strategy
Drawing on lessons learnt from five years of implementing the Lisbon strategy, in March 2005 the European Council decided to re-launch the strategy. It agreed to refocus priorities on jobs and growth in the light of the overall objective of sustainable development supported by appropriate national and Community resources.2 At the same time the European Council called for monitoring to give a clear picture of implementation of the strategy at national level.
The revised Lisbon strategy places strong emphasis on knowledge, innovation and optimisation of human capital. Education and training play an important role in several of the integrated guidelines for delivering it.
The Education and Training 2010 work programme3 is the means by which Member States can achieve the broad common objectives they have set for their education and training systems. This is why it is seen as a major contribution to the Lisbon strategy and why the European Council called on Member States to step up their efforts to implement it.
2
Presidency Conclusions, Brussels (2006).
3
II.
PERFORMANCE AND PROGRESS IN EDUCATION AND TRAINING
2000-2006
1.
Progress towards achieving the five benchmarks for 2010 in education
Regular monitoring of performance and progress using indicators and benchmarks is an essential part of the Lisbon process, allowing strengths and weaknesses to be identified with a view to providing strategic guidance for the Education and Training 2010 work programme. Indicators and benchmarks serve as tools for evidence-based policymaking at European level. The five benchmarks adopted by the Council in May 2003 are of continuing relevance in guiding policy action within the 2010 work programme. By adopting five European benchmarks in May 2003, the Council set measurable objectives indicating the policy areas in which, in particular, it expected to see clear progress. The benchmarks to be achieved by 2010 were:
• No more than 10% early school leavers;
• Decrease of at least 20% in the percentage of low-achieving pupils in reading literacy;
• At least 85% of young people should have completed upper secondary education;
• Increase of at least 15% in the number of tertiary graduates in Mathematics, Science and Technology (MST), with a simultaneous decrease in the gender imbalance;
• 12.5% of the adult population should participate in lifelong learning.
Chart II.1: Overview of progress towards the five European benchmarks in EU-274
Progre ss towards me e ting the 5 benchmarks (EU ave rage)
-20 -10 0 10 20 30 40 50 60 70 80 90 100
2000 2001 2002 2003 2004 2005 2006 2007 2008 2009 2010
Year
2
0
1
0
b
e
n
c
h
m
a
rk
s
=
1
0
0
MST graduates
Lifelong learning participation
Early school leavers
Upper secondary completion
Low achievers in reading
progress required
173
Source: DG Education and Training
4 In this chart the starting point (in 2000) is set as zero and the 2010 benchmark as 100. The results achieved each year are measured against the 2010 benchmark (= 100). The diagonal line shows the progress required, i.e. an additional 1/10 (10%) of progress towards the benchmark has to be achieved each year to reach the benchmark. If a line stays below this diagonal line, progress is not sufficient; if it is above the diagonal line progress is stronger than needed to achieve the benchmark. If the line turns down, the problem is getting worse.
In 2007 these goals still pose a serious challenge for education and training systems in Europe. Except for the EU benchmark on increasing the number of mathematics, science and technology graduates, on which there has already been clear progress and the benchmark has been accomplished, too little progress has been made against the vital benchmarks related most closely to the knowledge-based society and social inclusion. Unless significantly greater efforts are made on early school leaving, completion of upper secondary education and key competences, a high share of the next generation will be at risk of social exclusion, at great cost to themselves, the economy and society.
Key results
− As regards the number of MST graduates, the progress required by the benchmark had already been achieved by 2005. Progress towards reducing the gender imbalance, however, has been limited.
− Participation in lifelong learning showed a positive trend until 2005, but this may have been overstated given breaks in national series. In 2006 there was a slight drop in participation in lifelong learning in EU-27.
− There has been constant improvement as regards early school leavers, but faster progress is needed in order to achieve the benchmark.
− In the case of upper secondary attainment, there has been slow but steady progress. Furthermore progress has picked up slightly in recent years, but is not sufficient to achieve the 2010 objective.
− Results for low achievers in reading have not improved (but there are only two data points; new data will be available in December 2007).
Countries’ contributions to European average performance
The EU averages produced by Eurostat and used for measuring progress show the weighted average for EU-27 (data are mostly weighted by the reference population relating to the indicator). The six largest countries account for about 70% of the weighted average, and the six smallest countries for only about 1%. Using arithmetic averages (where every Member State equals 1/27) gives greater weight to smaller countries and hence to their contribution to the EU level. In policy terms information on arithmetic averages might be equally relevant because it shows the average improvements over systems and is thus closer to the contribution of Member States. While “weighted averages” of performance and progress show the “average situation” of citizens in Europe, the “arithmetic average” shows the average situation of education systems in the Member States.
For four of the five benchmarks (low achievers in reading, early school leavers, upper secondary attainment and participation in lifelong learning) performance is better and progress faster if arithmetic averages are used. This can be explained by the fact that some of the best performing countries (for example the Nordic countries and Slovenia) have relatively small populations. The faster progress in these countries might be explained by the fact that smaller countries in some cases have fewer administrative levels and can reform their education systems faster.
The only exception is MST graduates since some small countries have limited university systems (Malta, Luxembourg and Cyprus) and therefore perform less well than bigger countries.
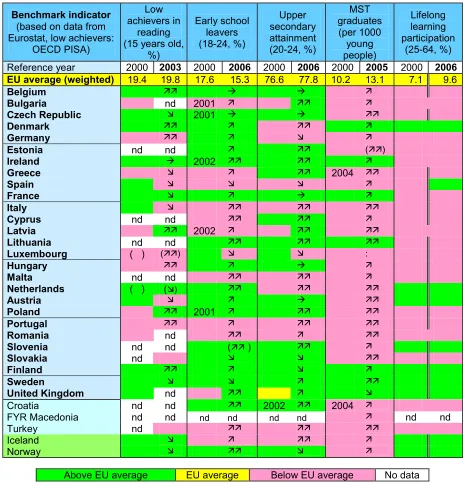
Table II.1: Position of each country (latest year available) and progress achieved since 2000.
Benchmark indicator (based on data from Eurostat, low achievers:
OECD PISA)
Low achievers in
reading (15 years old,
%) Early school leavers (18-24, %) Upper secondary attainment (20-24, %) MST graduates (per 1000 young people) Lifelong learning participation (25-64, %)
Reference year 2000 2003 2000 2006 2000 2006 2000 2005 2000 2006
EU average (weighted) 19.4 19.8 17.6 15.3 76.6 77.8 10.2 13.1 7.1 9.6
Belgium
Bulgaria nd 2001
Czech Republic 2001
Denmark
Germany
Estonia nd nd ()
Ireland 2002
Greece 2004
Spain
France
Italy
Cyprus nd nd
Latvia 2002
Lithuania nd nd
Luxembourg ( ) () :
Hungary
Malta nd nd
Netherlands ( ) ()
Austria
Poland 2001
Portugal
Romania nd
Slovenia nd nd ( )
Slovakia nd
Finland
Sweden
United Kingdom nd
Croatia nd nd 2002 2004
FYR Macedonia nd nd nd nd nd nd nd nd
Turkey nd
Iceland
Norway
Above EU average EU average Below EU average No data
Performance:
improvement of performance above EU average improving getting worse
not changing (< 1% change)
II: break in series
nd: no data
( ) not comparable
If 2000 data were not available another reference year is indicated; Lifelong learning participation: too many breaks in series, hence no arrows shown
Table II.2: Progress in EU-27 towards the benchmarks based on arithmetic averages of Member States' performance (based on Eurostat data)
Benchmark 2000 2006
Early school leavers (18-24,%) 17.3 15.3
Low-achievers in reading (15-year-olds, %) 18.7 18.2 (2003)
Upper secondary attainment (20-24, %) 77.3 79.1 MST graduates (per 1000 young people (20-29) 9.3 11.9 (2005)
Lifelong Learning Participation (% of adults, 25-64) 7.1 9.9
All Member States can learn from the best performers in the Union
Another objective of benchmarking performance and progress in education and training is to identify countries which are performing well in particular areas, so that their expertise and good practice can be shared with others. This is why, when the Council adopted the detailed work programme on the follow-up to the objectives for education and training systems in Europe, it asked for identification of the three best performing countries in specific policy areas.Almost half the Member States are among the three leading countries in at least one of the five areas. Good practice and expertise in education and training are not, therefore, confined to just a few countries in the Union.
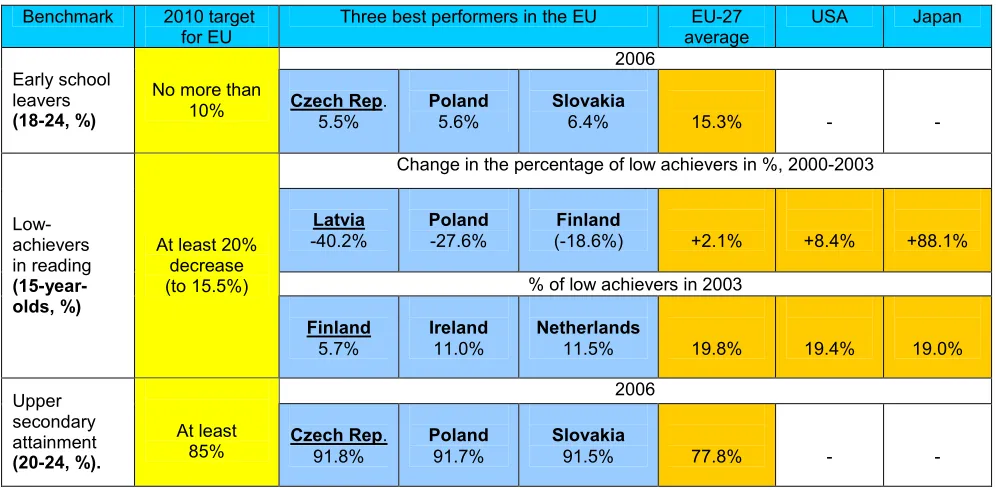
On the two benchmarks which target participation in school education (early school leavers and completion of upper secondary education), strong performances are found in the new Member States: Poland, the Czech Republic and Slovakia, but also in Slovenia.
When it comes to quality of school education as measured by the share of low achievers in reading literacy (PISA study), Finland, Ireland and the Netherlands perform best, but two new Member States (Latvia and Poland) are among the countries whose results have improved most.
Table II.3: Best performers on the benchmarks relating to secondary education
Benchmark 2010 target
for EU
Three best performers in the EU EU-27
average
USA Japan
2006 Early school
leavers
(18-24, %)
No more than
10% Czech Rep. 5.5%
Poland
5.6%
Slovakia
6.4% 15.3% - -
Change in the percentage of low achievers in %, 2000-2003
Latvia
-40.2%
Poland
-27.6%
Finland
(-18.6%) +2.1% +8.4% +88.1%
% of low achievers in 2003
Low-achievers in reading
(15-year-olds, %)
At least 20% decrease (to 15.5%)
Finland
5.7%
Ireland
11.0%
Netherlands
11.5% 19.8% 19.4% 19.0%
2006 Upper
secondary attainment
(20-24, %).
At least
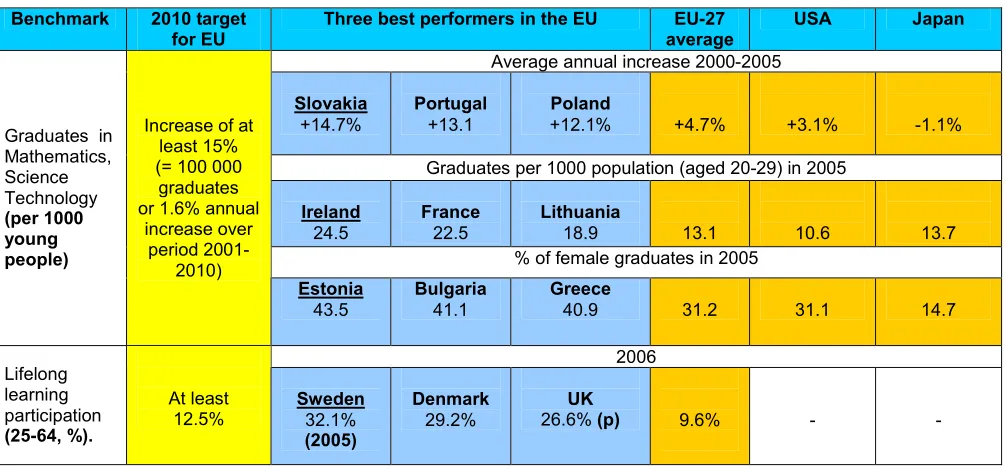
[image:14.595.43.541.507.752.2]Growth in mathematics, science and technology graduates has been strongest in new Member States where the number of tertiary students has increased rapidly over the last decade. Ireland, France and Lithuania have most MST graduates per 1000 young people (20-29), while Estonia, Bulgaria and Romania lead when it comes to gender balance. On adult lifelong learning the best performers are Sweden, Denmark and the UK, followed by Finland. Only Finland and Ireland are among the best performers in both school and post-compulsory education.
Table II.4: Best performers on the benchmarks relating to tertiary education and lifelong learning Benchmark 2010 target
for EU
Three best performers in the EU EU-27 average
USA Japan
Average annual increase 2000-2005
Slovakia
+14.7%
Portugal
+13.1
Poland
+12.1% +4.7% +3.1% -1.1%
Graduates per 1000 population (aged 20-29) in 2005
Ireland
24.5
France
22.5
Lithuania
18.9 13.1 10.6 13.7
% of female graduates in 2005 Graduates in
Mathematics, Science Technology (per 1000 young people)
Increase of at least 15% (= 100 000 graduates or 1.6% annual
increase over period 2001-2010) Estonia 43.5 Bulgaria 41.1 Greece
40.9 31.2 31.1 14.7
2006 Lifelong learning participation (25-64, %). At least 12.5% Sweden 32.1% (2005) Denmark 29.2% UK
26.6% (p) 9.6% - -
Additional note : p = provisional
2.
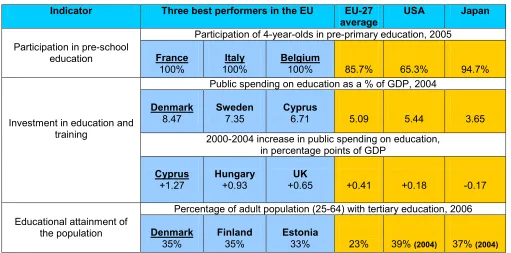
Progress on other key indicators
Table II.5: Best performers on other key indicators
Indicator Three best performers in the EU EU-27
average
USA Japan
Participation of 4-year-olds in pre-primary education, 2005 Participation in pre-school
education France
100%
Italy 100%
Belgium
100% 85.7% 65.3% 94.7%
Public spending on education as a % of GDP, 2004
Denmark 8.47
Sweden 7.35
Cyprus
6.71 5.09 5.44 3.65
2000-2004 increase in public spending on education, in percentage points of GDP
Investment in education and training
Cyprus +1.27
Hungary +0.93
UK
+0.65 +0.41 +0.18 -0.17
Percentage of adult population (25-64) with tertiary education, 2006 Educational attainment of
the population Denmark 35%
Finland 35%
Estonia
33% 23% 39% (2004) 37% (2004)
3.
Key messages emerging from the report in the eight policy areas
This report is structured around the eight areas of the coherent framework which reflects the political priorities of the Education and Training 2010 strategy as they have developed. The main messages emerging from the analysis of progress and performance in each of the eight policy areas are summed up below.
Improving equity in education and training
Evidence from international surveys (PISA, TIMSS and PIRLS) shows that family background, for example household income, parental education, parental occupational status, family structure or ethnic/migration background, are factors significantly influencing achievement by pupils in schools in the EU.
However, there is also evidence that some education and training systems manage to counteract such factors and thereby positively influence equity in education. As regards the performance gap between children of migrants and the general population, the EU is performing worse than countries like Australia and the USA. However, certain EU countries, such as Ireland, Luxembourg and France, show a relatively narrow gap. The impact of other dimensions of family background also differs significantly within Europe. The occupational status of parents is less important for pupils’ performance in Finland, Iceland and Latvia and “mother’s educational status” is less important for pupils’ performance in the Netherlands, Iceland and Norway than in other European countries.
As regards early school leavers, every sixth young person aged 18 to 24 in EU-27 still leaves school with no more than lower secondary education and participates in no kind of education or training after this point. Continuous progress has been made in recent years towards reducing this number, but progress must be faster to attain the EU benchmark of 10% in 2010. In 2006 only the Czech Republic, Austria, Poland and Slovakia had rates of early school leaving at or below the European benchmark. The Nordic countries (Denmark, Finland and Sweden) are also performing well but have showed no further improvement in recent years.
The percentage of pupils with special education needs who are educated in segregated settings varies widely between countries. Some (the Czech Republic, Estonia, Germany, Latvia, the Slovak Republic and also the Flemish Community in Belgium) place more than 4% of pupils with special education needs in segregated settings, whereas others (Cyprus, Greece, Iceland, Ireland, Italy, Lithuania, Malta, Norway, Portugal, Spain and Sweden) have fewer than 1% of pupils in such settings, reflecting the diversity of approaches within Europe.
Promoting efficiency in education and training
As regards efficiency of investment in education, there is not yet any agreed indicator to measure progress. This analysis therefore focuses on the financial input to education and training.
As regards the Lisbon objective of increasing per capita investment in human resources, good progress was made over the period 2000-2003 on increasing public spending on education, with average annual growth in real spending of 5% (while the whole population and the number of pupils and students increased by less than 0.5% per year). However, real spending growth slowed down to about 1% in 2004, while the economy expanded at a rate of 2.5%. At EU-27 level spending as a percentage of GDP, which had increased from about 4.7% in 2000 to 5.2% in 2003, thus dropped back slightly to 5.1% in 2004. The countries where education spending as a percentage of GDP has increased most since 2000 include Greece, Cyprus, Hungary and the UK. In some of these countries, however, spending growth came to a halt in 2004.
Total spending on higher education in the EU (1.34% of GDP in 2003 for all activities, including both education and research) is far below the level in the United States (2.80%). While the level of public expenditure is quite similar, the level of private funding is more than seven times higher in the United States. Europe would have to spend an additional €10 000 per student per year to draw level with the USA. In 2004 expenditure per full-time equivalent tertiary student in the USA was more than twice the EU average. And the EU has not been catching up in recent years since spending on tertiary education has only increased in line with the growth in the number of students.
Expenditure on educational institutions from private sources as a percentage of GDP has increased slightly since 2000 but progress slowed down in 2004. It now stands at slightly more than 0.6% of GDP. Only the UK, Germany, Slovenia, Latvia and Cyprus have levels of private spending close to or above 1% of GDP. Private spending on education as a percentage of GDP is nearly twice as high in Japan (1.2%) and more than three times higher in the USA (2.3%).
Making lifelong learning a reality
The European benchmark that by 2010 at least 85% of 22-year-olds in the European Union should complete at least upper secondary education still poses a significant challenge for the majority of Member States. The present average in the Union (for 20-24 year olds) is 77.8% (2006) and has improved by only 1.2 percentage points since 2000.
less than in 2005. The best performing countries are Denmark, the UK and Finland, followed closely by the Netherlands, Slovenia and Austria. All the other EU countries still have rates below the European average of 12.5%.
On average, women participated more than men. Adults with a high level of education are more than six times as likely to participate in lifelong learning as the low skilled. There are therefore still large challenges to tackle in the field of lifelong learning, such as the poor overall progress in recent years and the low participation of people with low educational attainment. Participation also decreases markedly with age.
As regards the ICT skills of adults - an essential condition for participation in the knowledge society in today’s digital age - surveys show a continuing increase in usage and skills. Nevertheless a large group without ICT skills remains: in 2005, within EU-25, nearly 40% of all individuals aged 16 to 74 had no computer skills and 34% had never used a computer. However, there are big differences between Member States: across Europe this figure ranges from only one in ten people who have never used a computer in Denmark and Sweden to almost two out of three (65%) in Greece.
Key competences among young people
No progress was made on the benchmark for the percentage of low achievers in reading literacy over the period 2000-2003 (2006 results will not be available until December 2007). The average in the 16 EU countries for which comparable data are available was 19.4% in 2000 and 19.8% in 2003. In 2003 Finland had the lowest proportion of low-achievers in reading literacy (5.7%), followed by Ireland, the Netherlands and Sweden.
In relation to the general objective of teaching at least two foreign languages from an early age, good progress was made from 2000 to 2005. In 2005 pupils in upper secondary education were learning, on average, 1.5 foreign languages, up from 1.2 in 2000.
As regards ICT skills, ICT usage, a proxy for ICT skills, in the adult population is increasing continuously. The level of ICT equipment in schools has also progressed. In 2006 there were on average 11 computers per 100 pupils in schools in EU-25, but there were large variations between countries. 96% of EU schools had Internet access (in many countries 100%) and 67% had broadband access.
Modernising school education
The Education Council adopted only one core indicator – on professional development of teachers – linked to modernising school education. Hence, the analysis is based on a number of more qualitative indicators that the Commission has identified as central for the “modernising school education” agenda.
The four indicators identified are school management, professional development of teachers, schools as multi-purpose local learning centres and financing of schools. The chapter highlights the main concepts related to the four indicators and the related stakes. This first step will enable policy-makers to debate and exchange information on the priorities for school modernisation.
Forthcoming data collection activities like the OECD TALIS (Teaching and Learning International Survey) will provide more information in the years ahead, especially on professional development of teachers and school leadership.
Modernising vocational education and training
countries, there has been a shift in participation, away from lower level vocational programmes to programmes that give access to studies at the next programme level.
The proportion of upper secondary pupils enrolled in a vocational stream remained constant in the EU countries over the period 2000-2004 at about 56%. However, there are sizeable differences between countries, ranging from less than 10% in Ireland and Portugal to over 70% in the Czech Republic, Slovakia, Austria and the UK. There are wide variations between countries in their levels of total public expenditure on secondary VET programmes as a percentage of GDP. In 2003 Finland had the highest relative spending at 1.1% of GDP, followed by the Czech Republic, Hungary, the Netherlands and Slovakia, all of which allocated 1% of their GDP to VET.
Modernising higher education
The EU is on course to surpass the benchmark of an increase of 15% in the number of graduates in mathematics, science and technology (MST) by 2010 (equal to an absolute increase of 100 000 graduates). Average annual growth was 4.7% over the period 2000-2005 (over 35 000 graduates per year, making a total of over 175 000 in this period). However, this achievement needs to be set in a global context: growth is currently even stronger in important new competitor countries like India and China (in 2004 the number of MST graduates in China already surpassed the EU figure). Demographic trends (decreasing cohort size) could spell a further slowdown in growth in the number of MST graduates in Europe in the long term.
The strong overall growth in the EU also masks considerable differences between Member States and between disciplines: while the number of graduates in computing increased by over 80% between 2000 and 2005, the number of graduates in physical science declined by 5% over the same period.
Little progress was made on reducing the gender imbalance among MST graduates. The proportion of female graduates increased slightly, from 30.8% in 2000 to 31.2% in 2005.
The percentage of students with foreign citizenship is increasing in the EU continuously. Three quarters of the outgoing students from EU countries, however, go to another EU country. Mobility within the Erasmus programme also continues to increase – by over 7% between 2005 and 2006. More than 1.5 million students have taken part in the Erasmus scheme since its inception in 1987.
As regards the quality of higher education, international university rankings show a relatively high share of institutions in western and northern European countries ranked among the well performing institutions. The very top end of the rankings is, however, dominated by US universities. There is furthermore still a wide gap in employment of researchers per thousand labour force between the EU and USA and Japan.
Employability
Over the period 2000-2006 there was a considerable improvement in the educational attainment of the working age population in EU-27. All EU countries reported a decline in the share of the population with low educational attainment and an increase in the population with medium to high levels of education. However, about 80 million people or 30% of the labour force (aged 25-64) still have low educational attainment (only lower secondary education or less) and are hence considered low-skilled. This figure is declining by over 1 million per year because young cohorts with higher education are continuously replacing older cohorts with lower levels of education.
1.
IMPROVING EQUITY IN EDUCATION AND TRAINING
Main messages
Access for all to and participation in education and training
Pre-primary education
In 2005, 85.7% of all 4-year-old children in the EU were participating in education. The participation rate increased slightly (by 2.9 percentage points) from 2000 to 2005. The rate is higher than in the USA but lower than in Japan. There were only four Member States in which not more than about half of 4-year-olds were participating in education in 2005.
Early school leavers
Every sixth young person aged 18 to 24 in EU-27 still leaves school with no more than lower secondary education and participates in no kind of education or training after this point.
Continuous progress has been made in recent years towards reducing the number of early school leavers, but progress must be faster to attain the EU benchmark of 10% in 2010.
In 2006 only the Czech Republic, Austria, Poland, Slovakia and Finland, together with Norway, had rates of early school leaving at or below the European benchmark (10% by 2010).
Special needs education
At present 2.2% of the total student population in compulsory education are educated in special educational settings within the EU because of special education needs. No progress was made towards more inclusive policies within the EU between 1999/2001 and 2004/2006 (2.2% also in 1999/2001). However, the percentage of pupils who are educated in segregated settings varies widely between countries. Some place 4% to 5% of the total student population in segregated settings, whereas others educate less than 0.5% of pupils in such settings within compulsory education.
Slightly less than 3% of the total student population within compulsory education are pupils with special education needs who are educated within regular compulsory education within the EU. However, this ratio also varies between individual countries and depends heavily on national definitions of pupils with special education needs.
Equity of conditions for education and training
Evidence from international surveys (PISA, TIMSS and PIRLS) shows that family background, for example parental education, parental occupational status, family structure or migrant background, are factors significantly influencing achievement by pupils in schools in the EU.
However, there is also evidence that some education and training systems manage to counteract such factors and thereby positively influence equity in education. As regards limitation of any negative impact of the foreign background of pupils on their performance at school, the EU is performing worse than countries like Australia and the USA. However, countries such as Ireland, Luxembourg and France are more successful in this area than other Member States.
Introduction
When launching the Lisbon strategy in 2000, the Heads of State agreed that the target that by 2010 the European Union should become “the most competitive and dynamic knowledge-based economy in the world, capable of sustainable economic growth, with more and better jobs”5 has to be accompanied by “greater social cohesion”.6 In the field of education and training, the Lisbon agenda was put into action in the “Education and Training 2010” programme containing three broad strategic objectives, of which the second directly concerned equity in education and training, stressing the need to facilitate access for all to education and training.7
Moreover, in 2003 the Council adopted a European reference level (benchmark) on early school leavers to be achieved by 2010, thereby acknowledging the central importance of the equity dimension for effective participation in lifelong learning in today’s increasingly competitive societies. The Council also stressed that specific issues, such as promotion of gender equality, integration of ethnic minorities, inclusion of disabled persons, reduction of regional disparities, etc., need to be monitored.
The need to ensure that European education and training systems are both efficient and equitable was recently reiterated by the 2006 spring European Council.8 As emphasised in the Communication on efficiency and equity, investigating equity in education and training means analysing the extent to which “individuals can take full advantage of education and training, in terms of opportunities, access, treatment and outcomes.”9
Taking into account the above-mentioned European policy context, the Communication from the Commission “A coherent framework of indicators and benchmarks for monitoring progress towards the Lisbon objectives in education and training”10 mentions (1) participation in pre-school education,
(2) special needs education and (3) early school leavers as core indicators for monitoring progress in this area.
Several theories of equity were developed, mainly after Rawls published his “theory of justice” in 1971,11 for example Walzer’s “theory of spheres of justice”,12 Sen’s “theory of capabilities”13 and the “theories of responsibility” developed by Arneson14 and Roemer.15 All these theories stress that “rewards” should be proportionate to “efforts” and, consequently, that inequalities of “talents” or threshold starting points, for which individuals are not responsible, should be balanced by opposite inequalities of “resources”.16
5
Presidency Conclusions, Lisbon, paragraph 37.
6 Ibid. 7
Adopted by the European Council, Stockholm, 2001. Work programme approved by the European Council, Barcelona, 2002.
8
European Council 23-24 March 2006, Presidency Conclusions, paragraph 23.
9 Communication from the Commission to the Council and to the European Parliament “Efficiency and equity in European education and training systems”, COM(2006) 481.
10 Communication from the Commission “A coherent framework of indicators and benchmarks for monitoring progress towards the Lisbon objectives in education and training”, COM(2007) 61.
11
Rawls, J. (1971), A Theory of Justice, Oxford University Press. 12
Walzer, M. (1983), Spheres of Justice, New York, Basic Books.
13
Sen, A. (1982), Quelle égalité?, In Ethique et Economie, Paris. 14
Arneson, R. J. (1989), Equality and equal opportunity for welfare, Philosophical Studies, 56, pp. 77-93.
15
Roemer, A. (1996), Theories of Distributive Justice. Harvard University Press, Cambridge. 16
Looking at equity in education and the role of education in promoting equity in society, the European Group of Research on Equity of Educational Systems (GERESE) analysed education and training in the European Union applying following five different philosophical/political approaches:
Equality of access or opportunities;
Equality of treatment;
Equality of achievement or academic success;
Equality of social output;
The position of “no interest in equity questions”.17
Equity in education can be achieved only if the relationship between education and the economic, political and socio-cultural systems in society is taken into account. In order to eliminate inequities in education it is necessary to apply a holistic approach. For example, Kathleen Lynch and John Baker have developed a concept of equality of conditions in education and training in which they draw a distinction between the following key dimensions: equality in educational and related resources, equality of respect and recognition, equality of power and equality of love, care and solidarity.18
Because of limitations connected with the availability of reliable and internationally comparable data and space, this report addresses only two aspects of equity issues in education and training:
1. access for all to education and training and equal opportunities, focusing mainly on access and participation in pre-primary education, early school leavers, special needs education and access of older people to higher education;
2. equity of conditions, analysing the impact of various characteristics of pupils, such as their family background or belonging to other language and minority groups, on their achievements in school plus inequalities created by individual schools.
This report does not analyse in more detail many aspects of equity in education and training already identified, such as injustices connected with school life, the way pupils are treated by the school, its employees and their fellow pupils or inequalities linked directly to the teaching process or structure of the education and training systems. Nor does it analyse the impact of inequalities in education and training on the economy and social and political life.
“The European Union has every reason to be proud of its anti-discrimination legislation, which is one of the most extensive in the world. But very often people are not aware of their rights. That is why one of the main aims of the European Year of Equal Opportunities for All (2007) is to help to turn equal rights in theory into equal rights in practice.”19
1.1.
ACCESS FOR ALL TO EDUCATION AND TRAINING
1.1.1 Significance of pre-primary education
As mentioned in the 2006 progress report, there is evidence that participation in pre-primary education can have a strong impact on educational achievement during compulsory schooling, including on early
17
Ibid. 18
Lynch,K. and Baker,J. (2005), Equality in education. An equality of condition perspective. In Theory and Research in Education, Vol. 3, pp.1312-164.
19
The European Year of Equal Opportunities for All – 2007. Celebrating diversity, ensuring equality (2006). Equal Voices,
school leaving, and on further participation in lifelong learning, two targets covered by European reference levels (benchmarks) for 2010. The target that 90% of all children aged from 3 years to the beginning of compulsory schooling should be in pre-school day-care institutions was set by the 2002 Barcelona Council in order to increase employment rates in Europe, especially for women.20
However, apart from making it possible for parents to combine parenthood with employment or studies, the goal of pre-primary education is to support and stimulate children’s mental and physical development. The pre-primary age is of great importance in each child’s growing understanding of itself, of the opportunities it has and of its everyday reality.
Universal access to high-quality pre-primary education can be particularly important for reducing inequalities caused by factors such as the educational attainment of parents, the difference between the language spoken at home and the language of instruction at school and the socio-economic status of parents.
The importance of early childhood education for further success or failure at school and beyond in personal and professional life is also widely recognised at national level. Countries have reformed their education policies and introduced many new initiatives at national, regional and local levels to increase participation by very young children in various educational settings. Many of these initiatives have focused on children at risk. They are usually targeted at children aged 3 and over (up to compulsory education). In many countries the objective of pre-primary education is to reduce the negative impact of the socio-economic backgroundof pupils and to try to counterbalance the impact of poverty and dysfunctional families on pupils’ achievements at school, but barriers still exist, for example to access to pre-primary education for children whose parents are unemployed.
In countries for which national data are available immigrant children are usually underrepresented in pre-primary education. Therefore many national initiatives are focusing on improving the language skills necessary for success in compulsory schooling. Target groups for such initiatives are usually migrants and children belonging to ethnic minorities (mainly Roma children). Some countries are also concentrating on supporting children whose parents have very low skills, including in their mother tongue. Moreover, in some countries, like Luxembourg where almost 40% of the population is of foreign origin, language learning is one of the key objectives of pre-primary education.
Impact of participation in pre-primary education on achievement at school
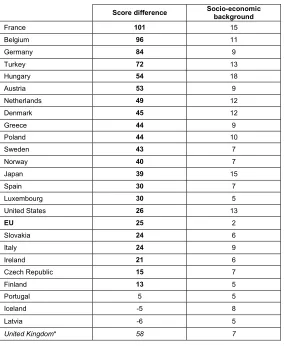
According to PISA data on the achievements of 15-year-olds in reading, the difference in the mean score between pupils who participated in pre-primary education for more than one year and pupils who received no pre-primary education was 25 points for the European countries participating in PISA. The biggest differences were observed in Belgium and Germany, followed by the UK. By contrast, this indicator was slightly below the EU average in Slovakia, Italy, Ireland, the Czech Republic and Finland. One possible reason why non-participation in pre-primary education had a greater impact on performance at school in countries with almost universal participation in pre-primary education may be that in these countries children who were not enrolled in pre-pre-primary education are in an even more difficult situation at school in comparison with children who have already received some kind of education or have already had an opportunity to adapt to school.
20
Table 1.1: Participation in pre-primary education and school performance in reading
(Difference in mean achievement score between pupils who were enrolled in pre-primary education for more than one year and pupils who were not)
Score difference Socio-economic background
France 101 15
Belgium 96 11
Germany 84 9
Turkey 72 13
Hungary 54 18
Austria 53 9
Netherlands 49 12
Denmark 45 12
Greece 44 9
Poland 44 10
Sweden 43 7
Norway 40 7
Japan 39 15
Spain 30 7
Luxembourg 30 5
United States 26 13
EU 25 2
Slovakia 24 6
Italy 24 9
Ireland 21 6
Czech Republic 15 7
Finland 13 5
Portugal 5 5
Iceland -5 8
Latvia -6 5
United Kingdom* 58 7
Source: OECD ( PISA 2003 dataset). Differences in bold are statistically significant. The OECD average performance in PISA was fixed as 500 points in 2000. Weighted EU averages have been calculated for PISA data whenever data exist for at least 15 of the 25 member states, representing at least 60 per cent of the total EU population.
Additional note:
*UK: response rate too low to ensure comparability.
However, the socio-economic background of children can influence their ability to benefit from pre-primary education. After adjusting for the socio-economic background of children, the net effect of pre-primary education tends to be roughly halved, but is still statistically significant. Data from PIRLS and TIMSS (2003) confirm this observation on the role of pre-primary education. Longitudinal research also supports this finding.21
Nevertheless, a more holistic approach is needed in order fully to understand why some countries with very high levels of participation in early learning, for example Belgium and France, also still have above-average levels of inequity in education (both between groups and between individuals) and why a country like Finland, with relatively low participation rates in early learning, comes out best in the world in the PISA reading test.
As stated in a UNESCO publication, “... even though, overall…(day-care facilities) generally have a positive effect on performance at school …, such facilities may be more or less beneficial to the
21
development of very young children, depending on how they are organized in practice and the content of what they provide. In particular, they have a more regularly positive impact on the capacity of children to adapt socially than on their linguistic development. Their impact in terms of reducing social inequality will thus also vary, and the overall influence of various forms of pre-school day-care will remain far weaker than that of the educational level of a child’s mother.” 22
Participation in pre-primary education
In 2005, 85.7% of all 4-year-old children in the EU were participating in education. Children of this age were usually enrolled in pre-primary institutions (kindergartens), but in some countries they were already attending primary school.23 The institutions range from schools to non-school centres, which sometimes come under authorities or ministries other than those responsible for education.
Chart 1.1: Participation rates of 4-year-olds in education, 2000-2005
2000 2005
EU27 BE BG CZ DK DE EE IE EL ES FR IT CY LV LT LU HU MT
2000 82.8 99.2 67.0 81.0 90.6 81.4 78.2 51.1 53.9 99.0 100.0 100.0 55.7 60.6 51.0 94.9 89.5 100.0
2005 85.7 100.0 73.2 91.4 93.5 84.6 84.2 45.4 57.8 99.3 100.0 100.0 61.4 72.2 56.8 96.3 90.7 94.4
NL AT PL PT RO SI SK FI SE UK HR MK TR IS LI NO JP US
2000 99.5 79.5 33.3 72.3 60.3 67.7 : 41.9 72.8 100.0 : 12.4 : 90.9 : 78.1 94.9 61.7
2005 73.4 82.5 38.1 84.0 76.2 75.9 74.0 46.7 88.9 91.8 44.7 15.4 5.0 95.3 50.6 88.9 94.7 65.3
Source: Eurostat (UOE data collection)
Additional notes:
Data include participation in both pre-primary and primary education (ISCED level 1 and 2).
BE: Data exclude independent private institutions, but these are attended by only a very limited number of children. Data from the German-speaking community are missing.
IE: There is no official provision of ISCED level 0 education. Many children attend some form of ISCED level 0 education, but for the most part data are missing.
NL: In 2002 the reference date for collecting these data was changed from 31 December to 1 October. MK: Data for 2004.
As shown in Chart 1.1, between 2000 and 2005 the upward trend which started after the 1960s in most countries continued: participation by 4-year-olds in education increased again slightly from 82.8% to 85.7%.24 This EU average is higher than in the USA (65.3%) but lower than in Japan (94.7%).
22
Duru-Bellat,M. (2004). Social inequality at school and educational policies. UNESCO, International Institute for Educational Planning.
23
According to the ISCED definition, pre-primary education covers “programmes at level 0, defined as the initial stage of organised instruction designed primarily to introduce very young children to a school-type environment, i.e. to provide a bridge between the home and a school-based atmosphere.” That means that day-care without any educational element is excluded.
24
However, access levels vary widely across Europe. In France, Belgium, Italy, the UK and Spain, participation by 4-year-olds in education is almost universal, whereas in four countries – Ireland, Lithuania, Poland and Finland – not more than about half the 4-year-olds participate in education. Participation by 4-year-olds is extremely low in Turkey (5%) and in Macedonia (15.4%).
In Greece pre-primary education is available only from the age of 4 onwards, whereas in Ireland, the Netherlands and the UK 4-year-olds are already enrolled at primary school and in Finland the majority of 4-year-olds attend day-care centres with highly qualified staff which also play a certain educational role.25
Poland has one of the lowest participation rates in pre-primary education because relatively few places are available. Demand outstrips supply and priority is given to 6-year-olds (due to their obligation to attend one year of pre-primary education in preparation for primary school), children of single parents, children of disabled parents and children placed in foster families. Access to pre-primary education in rural areas is a particular challenge in Poland. In 2005/2006, 41% of all children aged 3-5 years were enrolled in pre-primary education in Poland, but while in urban areas the figure was 58.4%, in rural areas it was only 19.1%.26
1.1.2 Early school leavers
Young people who leave school with only lower secondary education are at a disadvantage on the labour market in today’s knowledge-based society. Their personal and social development is in danger of being curtailed and they are at risk of a life of poverty and social exclusion. They are also less likely to participate in lifelong learning than other young people who continue their education and training.
The need to decrease the number of young people at this risk was identified and recognised in 2003 when the (Education) Council set a European reference level (benchmark) in this area for 2010. The same target to reduce early school leaving is also included in the Employment Guidelines (2005/2008) for the revised Lisbon process.27
European benchmark By 2010 an EU average of no
more than 10% early school leavers should be achieved.
The European objective is to encourage young people to remain in education or training after the end of compulsory education and to obtain at least upper secondary education. Educational attainment of at least this level is understood as the minimum necessary for active participation in the knowledge-based economy.
25
Eurydice (2005). Key Data on Education in Europe 2005. 26
Information provided by the Polish Eurydice unit in 2007.
27