Abstract: This paper presents an efficient image processing based algorithm to determine the freshness of a fish. The determination is made after judging the condition of the eyes and the gills of the sample. The method is applicable for most edible fishes and can be easily reconfigured by changing the effect that the two determinants have on the final outcome. The novelty of the method lies in the ability of the algorithm to easily adapt to new samples which is a result of the universal applicability of the parameters selected. The method shows highly accurate results when compared to the ground truth.
Index Terms: Digital Image Processing, Image Segmentation, Fish Quality.
I. INTRODUCTION
Vision acts as one of the most important stimuli for humans. We constantly take cues from visual events to decide on our tasks. . The field of image processing exploits this dependence of humans on vision as a trigger for certain tasks. It is a highly practical field where we teach digital systems, using camera sensors to identify visual triggers and then subsequently automate tasks. The task might be as trivial as detecting road signs, as proposed by Danti and Kilkarni [1] or it can be highly specific like watermarking images as proposed by Yadav[2].
Fishes are consumed in large quantities every day and it is necessary to ensure that the fishes are fresh before using them to ensure health standards. Fish samples undergo deterioration in terms of freshness and quality and the rate of this deterioration is heavily dependent on its storage and the kind of fish sample. The most commonly used method to determine their freshness is by visual analysis, which is performed by a person. The result of such analysis relies heavily on the experience of the person performing the analysis and is even impractical on large sets of samples. The motivation for researching on such a tool came from a study [4] done in 2004 which documented the effects of stale fishes in conjecture with [5] which shed light on Indian food habits. Given the studies, we developed an algorithm, which is highly accessible and accurate
Our paper deals with a specialized task of identifying the freshness of a fish based on two parameters, the fish gill color deviation and the cloudiness in the eye
Revised Manuscript Received on June 15, 2019.
Samarth Negi, ECE, Maharaja Agrasen Institute of Technology, Delhi, India, [email protected]
Navneet Yadav, ECE, Maharaja Agrasen Institute of Technology, Delhi, India, [email protected]
Rahul Rawat, ECE, Maharaja Agrasen Institute of Technology, Delhi, India, [email protected]
Rishabh Singh, ECE, Maharaja Agrasen Institute of Technology, Delhi, India, [email protected]
II. LITERATURESURVEY
Many studies have used different processing methodologies to achieve the task of judging the freshness of a fish. In our case, we focused on the types of qualities that can be judged non-destructively and requires only the visual aspect. This eliminated a lot of olfactory and chemical indicators as they are hard to perform and subjective in nature.
In [6] the researchers have used a neural network to find the classify fishes based on the skin, eye and gill characteristics and classifies the fish into one of 5 classes. The study proposes some great insights to the segmentation process based on K-means clustering and Canny edge detection
One study in [7] proposed a method based on LAB colorspace separation and isolation to segment the gills from the image of the fishes. The final decision was then made based on the features of the gill, essentially the consistency of the gills that was assessed using its standard deviation. The method showed results very similar to on ground truths and boasted a 92.4% correlation with the ground truth.
In [8], the researchers determined the fish freshness using a chemical process that determines the amount of xanthine in fish meat. They demonstrated a simple assay system containing Zinc Oxide (ZnO) and xanthine oxidase (XOD) for specific and quantitative detection of xanthine. The said method was successfully applied with satisfactory results but due to the fact that the materials needed to perform the test is not readily available, it is not usable by casual fish consumers In [9], Karagöz used an image-processing algorithm to detect the freshness of Sardines, the fish whichwere consumed most locally. The research was focussed on Machine Learning and ANN. It focused on extracting four features from the image of the sample, three of which were related to shape and one was related to the colour. With this algorithm the researcher achieved a 90% correlation with ground truth.
Researchers in [10], in order to evaluate fish freshness conducted various subgroup studies under controlled storage conditions pertaining to sensory analysis, microbiology, volatile compounds, proteins, lipids, adenosine triphosphate and physical measurements corresponding to different stages of fish freshness .It emphasized on the rapid assessment by building mathematical models expressing storage condition effects corresponding to aforementioned areas of study used for research.
An Effective Technique for Determining Fish
Freshness using Image Processing
461
Published By:
Blue Eyes Intelligence Engineering & Sciences Publication
Retrieval Number: I100730789S19/19©BEIESP DOI: 10.35940/ijitee.I1073.0789S19
[1] proposed to detect freshness of a fish using a multi color biosensor based on the etching of gold Nano rods (GNRs). Researchers used Hypoxanthine (Hx) as the index of fish freshness which in presence of xanthine oxidase (XOD) reacts with dissolved oxygen to produce H2O2 which causes GNRs to be etched quickly if Fe2+ is present This leads to regulated surface plasmon resonance (SPR) and results in distinctly color change of the system, which is easily distinguishable with the naked eye.
Finally, in [12] the researchers have studied features that can be used to ascertain the quality of fishes and their spoilage. Some of these features are specific to chill-stored fishes while some are universal but show up at different rates in different fishes.
III. PROPOSEDMETHID
Using the existing research work on the subject, we identified the main aspects that such an algorithm should have to make it most ideal for use in terms of its ease of use and applicability. After which we finally settled for 2 key features our algorithm should have. The first being that it should be able to work regardless of the tools used to obtain the image of the sample i.e. support multiple camera qualities and the second being that it should not require a large data set for training and should be quick to set up.
The method takes into account two features for the determination process. The features being the fish gill deviation and the eye cloudiness. Both features produce a numerical result whether the fish is fresh or not.
A. Fish Gill Deviation
As fishes age, the color in their gills become less and less even leading to discoloration and in certain species dark spots start to appear. The gills of fresh fishes are generally bright pink or red and have no visible slime. As the fish spoils, the gills assume a bleached, light pink appearance that finally changes to yellowish or greyish brown, and the slime on the gills becomes turbid, clotted and discolored, as a result of increased bacterial growth. [12] We take this discoloration of the gill as the classification criteria. This process is accomplished in two parts, the first being the task of segmenting the gill from the photo and the latter being the task of classification.
Segmenting the Fish Gills
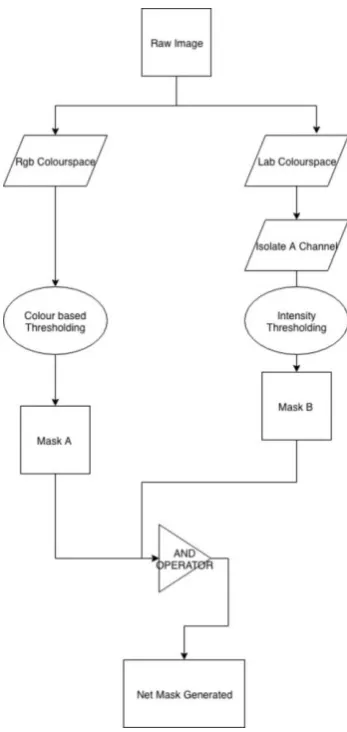
[image:2.595.332.506.58.425.2]Isaac & Dutta [4] proposed a method for isolation of gills from the rest of the fish using a method of thresholding in the ‘A’ channel of the LAB color space. In practice however this method relies on the camera quality and highly ideal conditions of the photo. To tackle a broader range of input images, we built up on this process and added a color-based thresholding. The output of the two thresholding algorithms is then summed to provide the required isolated gill mask. This process is illustrated in the flowchart as shown in Fig. 1. Fig. 2 shows the output of isolation of gills from a raw image for multiple different input samples.
Fig. 1 Flowchart showing the Gill Segmentation process
Fig. 2 The input and output images for the gill segmentation process for common carp (1,2) and curled gill
[image:2.595.315.499.450.702.2]Calculating the Standard Deviations
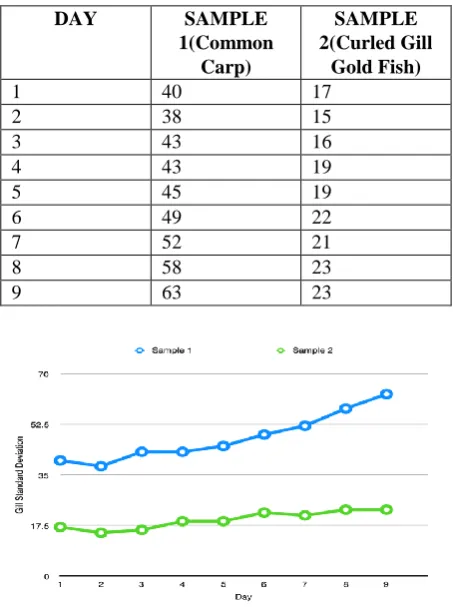
[image:3.595.41.268.257.561.2]Once we have the fish gill isolated, we use the uniformity in the color pattern of the gill as a determinant of the freshness of the fish. To accurately measure how the color of the gill varies, we take the standard deviation of all the R, G, and Bvalues. If the color variance is low, the standard deviation is also low and if the variance is high, the standard deviation is high as well. Table 1 is a table of the readings for standard deviation of the gills for two fish samples taken over the period of nine days. Fig 3 shows the same data plotted on a graph. It clearly shows a rise in the deviation for both samples.
[image:3.595.309.562.588.711.2]Table 1 Table of standard deviation values forconsecutive days for two fish sample
Fig. 3 A plot for the fish standard deviations through the decay process B. Fish Eye Cloudiness
Quantifying the cloudiness of the fish eye can also be used as a standard for fish quality. But the amount of cloudiness recorded by a camera sensor will depend on a lot of factors such as: Camera quality, Environmental Lighting during recording the observations, Additional Lighting (flash) if provided and the type of fish. This essentially makes us unable to use absolute values to qualify the eye haziness. When a fish spoils, the eyes gradually shrink and pass from being flat to concave (sunken), the pupil becoming cloudy and milky and the cornea opaque [3].
Instead, we use a sample-based method where we take pictures of known fresh samples before use and store their values as reference. The new samples are now assessed with
respect to the reference values Isolating the eye
Isolation of the fish eye is accomplished using Hough Circle Transform. To improve accuracy, we reduce the area of the raw image we analyze by taking only the area in the vicinity of the gill excluding the area of gill into consideration. The area of consideration is calculated using the dimensions of the bounding rectangle of the gill and the size of the image. The method used is demonstrated below. The output generated from the process is shown in Fig. 4. Each of the boxes labeled 1 is the bounding rectangle of the gill area. The boxes labeled 2 are the regions generated for analysis and ideally the eye will always be located in this box (2), excluding the gill area. Once the region of interest is formed, it is passed through a canny operator and a Hough Circle Operator. The detected circles are then filtered out using area as the thresholding parameter. The eye is then isolated as an eye mask to be used in measuring the cloudiness.
Once the region of interest is formed, it is passed through a canny operator and a Hough Circle Operator. The detected circles are then filtered out using area as the thresholding parameter. The eye is then isolated as an eye mask to be used in measuring the cloudiness.
Calculating the Eye Vicinity
Here depends on camera quality i.e. resolution of the original sample image. In the presented experiment taking in the range 1.2 to 2 gave reliable results.
Fig. 4 Visual depiction of the eye vicinity calculation
DAY SAMPLE
1(Common Carp)
SAMPLE 2(Curled Gill
Gold Fish)
1 40 17
2 38 15
3 43 16
4 43 19
5 45 19
6 49 22
7 52 21
8 58 23
463
Published By:
Blue Eyes Intelligence Engineering & Sciences Publication
Retrieval Number: I100730789S19/19©BEIESP DOI: 10.35940/ijitee.I1073.0789S19
Calculating the Blur Index
After analyzing multiple fish eyes with varying degrees of cloudiness, we found out that the eye blurriness could be assessed the same way as blur. While it does not have a concrete relation to blur as a constant, it was found to be linear in a way that as the cloudiness of the eye increased, the measure of the blur in the image also increased.
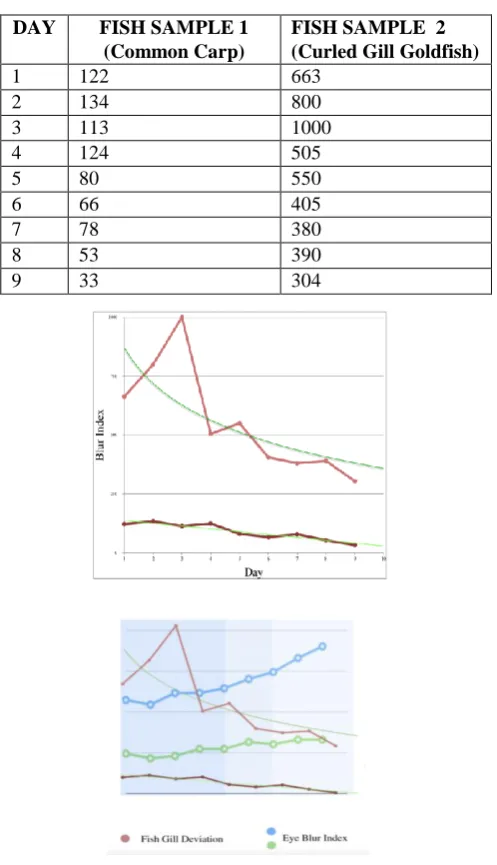
[image:4.595.41.290.261.694.2]The blur was calculated using a Laplacian operator which was run as a kernel through the entire eye mask. This implementation of the Laplacian operator has been derived from the work of Pacheco & Cristóbal [13] where they provide a lot of auto focusing methods. Table 2 shows the output data for the blur index calculation for the two fish samples used. This data is also graphically represented in Fig. 5 where we can see a clear decreasing trend.
Table 2 Blur index values for consecutive days for two fish samples
Fig 5 Blur index plot on consecutive days
Fig. 6 Combined graph with gill deviation and eye cloudiness showing segmentation of fish's usability
IV.RESULTSANDANALYSIS
From the graphs of the eye cloudiness and gill deviation, we can conclude that both parameters have a trend which is easily recognizable. Although this trend is heavily dependent on the camera quality and the amount and type of colour the camera adds to the image. These deviations can be normalized by performing a calibration test on the same camera and finding out the standards.
After standardization, we have split the life of fishes into two sections, usable and unusable. The graph in Fig. 6 shows this division. The left most blue (the darkest shade) section displays the usable time during the fish’s life. From the graph we can take the end point values as cutoff to find the numeric value of the two parameters after which the fish becomes unusable.
V. CONCLUSION AND FURTHER SCOPE
In this paper, we have proposed an efficient method for determining the fish freshness. We focused on developing a method which is highly practical and can be used for a large variety of fishes. We took two parameters, the gill and the fish eyes as the determinants and their values as the degree of freshness a fish .An ideal use case of the algorithm would be in a high volume fish processing plant where each fish can be checked on a conveyor before its processing and it can also prove to be effective when used in general households to test their fishes before eating.
While we have chosen only two features to work with , the most optimum solution which ideally won’t rely on external features like camera coloring, camera quality and the natural lighting would be a neural network trained with up to 15-20 features. Such a network would require a high volume of input data but would highly streamline the process of fish freshness detection. Such a system would only depend on the species of fishes in question.
REFERENCES
1. A. Danti, J. Y. Kulkarni and P. Hiremath, "An Image Processing Approach to Detect Lanes, Pot Holes and Recognize Road Signs in Indian Roads," International Journal of Modeling and Optimization, vol. 2, 2012, pp. 658-662.
2. N. Yadav, "DWT--SVD--WHT Watermarking Using Varying Strength Factor Derived From Means of the WHT Coefficients,” Arabian Journal for Science and Engineering, vol. 43(8), 2017, pp. 4131-4143. 3. M.T.-Salazar, L. E. C.-Suarez, D. R.-Marie, I. H. Pike et al. "Effect of
fishmeal made from stale versus fresh herring and of added crystalline biogenic amines on growth and survival of blue shrimp Litopenaeus stylirostris fed practical diets," Aquaculture. vol. 242(1-4), 2004, pp. 433-449.
4. S. V. Joshi, "To Study the Relationship between Indian Food Habits and Health for Healthy India," Imperial Journal of Interdisciplinary Research (IJIR), vol. 3(3), 2017,
pp. 1120-1122.
5. I. C. Navotas, C. N. V. Santos, E. J. M. Balderrama, F. E. B. Candido et al. "Fish
DAY FISH SAMPLE 1
(Common Carp)
FISH SAMPLE 2 (Curled Gill Goldfish)
1 122 663
2 134 800
3 113 1000
4 124 505
5 80 550
6 66 405
7 78 380
8 53 390
identification and freshness classification through image processing using artificial neural network," Journal of Engineering and Applied Sciences, vol. 13(18), pp. 4912-4922.
6. A. Issac, M. K. Dutta, B. Sarkar and R. Burget, "An efficient image processing based method for gills segmentation from a digital fish image," 2016 3rd International Conference on Signal Processing and Integrated Networks (SPIN), Noida, 2016, pp. 645-649.
7. G. Xue, W. Yu, L. Yutong, Z. Qiang et al. "Construction of novel xanthine biosensor by using Zinc Oxide (ZnO) by biotemplate method for detection of fish freshness," Analytical Methods. vol. 11(8), 2019, 10.1039/C8AY02554A.
8. A. Karagöz, "Fish Freshness Detection by Digital Image Processing, " Dokuz Eylül University ,Iżmir, Turkey, 2013, Available: http://acikerisim.deu.edu.tr
9. G. Ólafsdóttir, E. Martinsdottir, J. Oehlenschläger, P. Dalgaard, B. Jensen, et al. "Method to evaluate fish freshness in research and industry," Trends in Food Science & Technology, vol. 8(8), 1997, pp. 258-265.
10. Z. Chen, Y. Lin, X. Ma, L. Guo, , B. Qiu, G. Chen and Z. Lin, "Multicolor biosensor for fish freshness assessment with the naked eye,"
Sensors and Actuators B: Chemical.vol. 252, 2017, pp. 201-208. 11. V. Lougovois, Freshness Quality and Spoilage of Chill-Stored Fish.
ISBN 1-59454-408-5, 2005, pp. 35-36
12. J. J. Connell, Control of Fish Quality; 4th ed.; Fishing News Books Ltd.: Farnham, Surrey, 1995; pp 1-4, 37-48, 135-164
AUTHORSPROFILE
Samarth Negi B. Tech Final Year at MAIT, Rohini, Delhi.(Batch of 2019).Assisted in the research and development of the following patent : ‘A Novel Wireless Switch Module ’ by Dr. SujataPandey , 2017. Published a paper "An Efficient Image Processing Based Method for Detecting Discontinuities in Railway Tracks:" in the national conference IEEE-ICECEIC-2019, 978-1-7281-0174-3/19/31.00 2019
Navneet Yadav born in 1973, received his B. Tech. degree in 1997, from SantLongowal Inst. of Engg. & Technology (SLIET) Longowal, Punjab, India and M.E. degree in 2006 from Maharishi Dayanand University, Rohtak, India. He has done his Ph.D. in 2015 from Thapar University, Patiala, India.He is currently working as an Asst. Prof. in Maharaja Agrasen Inst. of Technology, New Delhi, India since 2007. His current areas of research are image processing, signal processing and watermarking. Major publications are following-
Navneet Yadav and Kulbir Singh (2013), Robust image-adaptive watermarking using an adjustable dynamic strength factor, Signal, Image and Video Processing, (Springer's Journal), Vol. 9, no. 7, pp. 1531-1542 (SCI Indexed, Impact Factor 1.43)
Navneet Yadav and Kulbir Singh (2016), An efficient robust watermarking scheme for varying sized blocks, Turkish Journal of Electrical Engineering and Computer Sciences, Vol. 24, pp 2974-2993. (SCI Indexed, Impact Factor 0.407)
Navneet Yadav (2017) "DWT-SVD-WHT watermarking using varying strength factor derived from means of the WHT coefficients", Arabian Journal of Science and Engineering, Vol. 43(8), pp. 4131-4143, DOI 10.1007/s13369-017-2793-7 (Springer's Journal) (SCI Indexed, Impact Factor 0.865)
Sudan Jha, Raghvendra Kumar, Le Hoang Son, Jyotir Moy Chatterjee,
ManjuKhari, Navneet Yadav, FlorentinSmarandache (2018), “Neutrosophic
soft set decision making for stock trending analysis”, Evolving Systems,
DOI 10.1007/s12530-018-9247-7 in press (ESCI - Emerging Sources
Citation Index).
Navneet Yadav and Kulbir Singh (2015), Transform domain robust image-adaptive watermarking: Prevalent techniques and their evaluation, IEEE International Conference on Computing, Communication and Automation (ICCCA 2015), Galgotias University, Uttar Pradesh, India, May 15-16, pp. 1121-1126, DOI 10.1109/CCAA.2015.7148543
Rahul Rawat B. Tech Final Year at MAIT, Rohini, Delhi. (Batch of 2019)