Theses
Thesis/Dissertation Collections
6-1-1972
A Study of the Influence of Iodide Released During
Development on the Course of Development
Barry Britton
Follow this and additional works at:
http://scholarworks.rit.edu/theses
This Thesis is brought to you for free and open access by the Thesis/Dissertation Collections at RIT Scholar Works. It has been accepted for inclusion
in Theses by an authorized administrator of RIT Scholar Works. For more information, please contact
Recommended Citation
hy
by
Barry
J.
Britton
A
thesis
submittedin
partial
fulfillment
of
the
requirements
for
the
degree
of
Master
of
Science
in
the
School
of
Photographic
Arts
and
Science
in
the
College
of
Graphic
Arts
and
Photography
of
the
Rochester
Institute
of
Technology
June,
1972
MASTER'S
THESIS
This
is
to
certify
that
the
Master's
Thesis
of
Barry
J.
Britton
with
a
majorin
Photographic
Science
and
Instrumentation
has
been
approved
by
the
Thesis
Committee
as
satisfactory
for
the
thesis
requirement
for
the
Master
of
Science
degree.
date
Thesis
Committee:
The
patient
counsel
and
untiring
enthusiasm
of
my
thesis
adviser.
Dr.
Burt
H.
Carroll,
deserve
special
recognition.
The
use
of
the
computer
facilities
belonging
to
Eastman
Kodak
Company
was
also
screatly
appreciated.
Perhaps
mostof
all
I
thank
my
wifefor
her
patienceand
for
her
assistance
in
typing.
LIST
OF
TABLES
iv
LIST
OF
FIGURES
v
ABSTRACT
vi
Chapter
1
INTRODUCTION
1
Chapter
2
PRELIMINARY
EXPERIMENTS
12
Iodide
Transfer Technique
12
Developers
13
Agitation
15
Quantitative
Iodide
Analysis
17
Silver
and
Iodide
Analysis
27
Experimental
Technique
29
Iodide
Induced
Spectral
Absorption
Changes
33
Iodide
Transfer
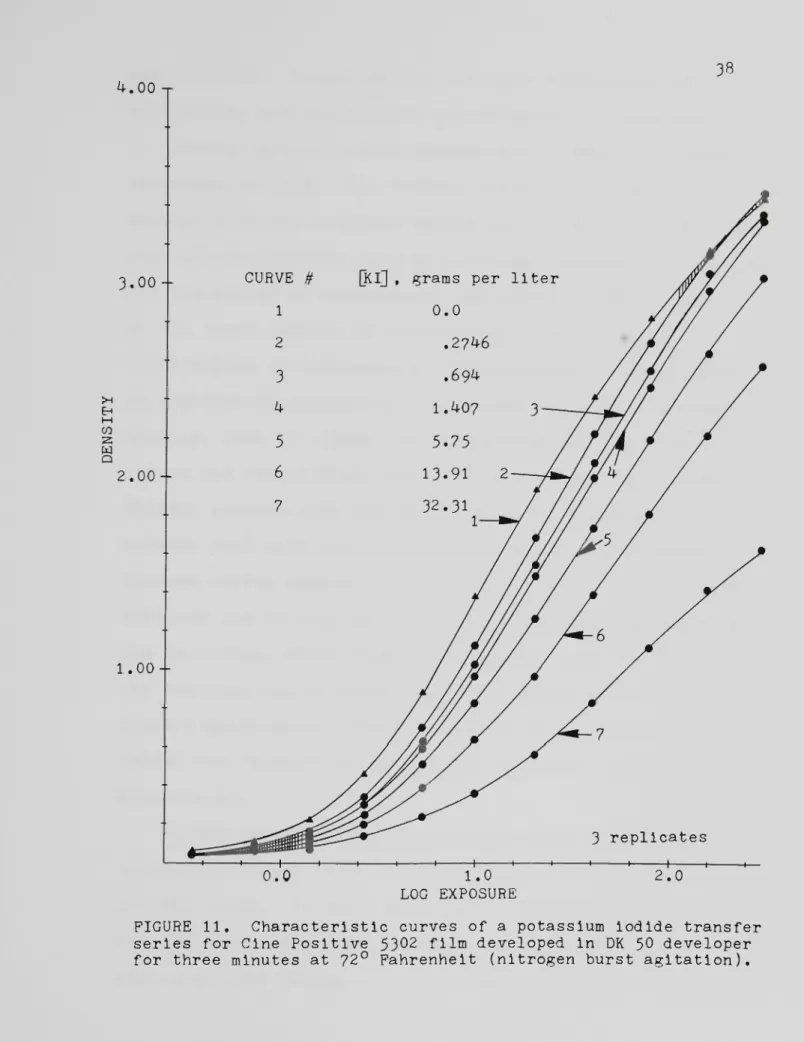
Series
36
Chapter
3
IODIDE
TRANSFER
SERIES
INVESTIGATION
52
Chapter
k
DEVELOPMENT
TIME
SERIES
ANALYSIS
109
Chapter
5
SUMMARY
125
REFERENCES
127
Appendix
A
SLIDING
ANOVA
129
Appendix
B
SILVER ANALYSIS
I36
Appendix
C
NITROGEN
BURST
TANK VARIABILITY AND
DESIGN
137
ABLE
PAGE
1
14
2
19
3
20
4
25
5
25
6
28
7
30
8
44
9
48
10
51
11
56
12
59
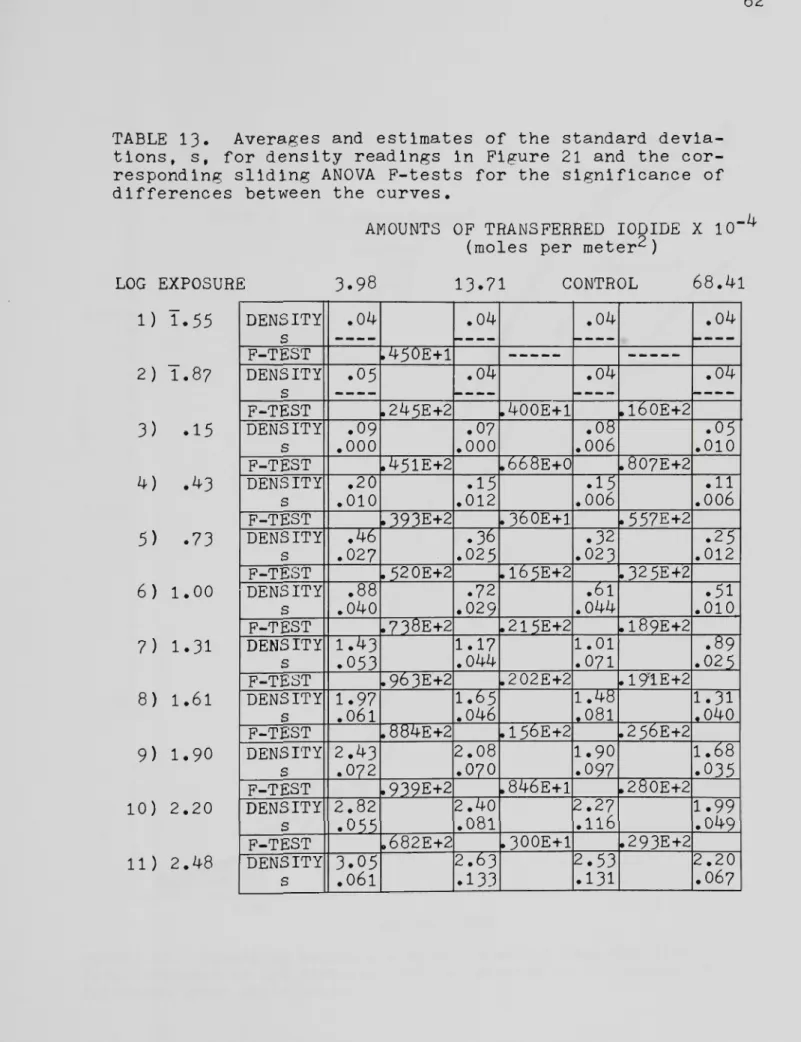
13
62
TABLE
PAGE
14
65
15
70
16
73
17
82
18
85
19
88
20
91
21
94
22
97
23
100
24
103
25
113
26
119
CI
138
[GURE
PAGE
FIGURE
PAGE
FIGURE
PAGE
1
6
21
60
41
93
2
16
22
61
42
95
3
19
23
63
43
96
4
20
24
64
44
98
5
23
25
68
45
99
6
24
26
69
46
101
7
28
27
71
47
102
8
30
28
72
48
106
9
3^
29
75
49
107
10
35
30
76
50
108
11
38
31
77
51
111
12
43
32
80
52
116
13
46
33
81
53
121
14
47
34
83
54
122
15
49
35
84
Al
129
16
50
36
86
A2
130
17
5^
37
87
A3
131
18
55
38
89
A4
134
19
57
39
90
C2
145
by
Barry
J.
Britton
An
Abstract
A
thesis
submitted
in
partial
fulfillment
of
the
requirements
for
the
degree
of
Master
of
Science
in
the
School
of
Photographic
Arts
and
Science
in
the
College
of
Graphic
Arts
and
Photography
of
the
Rochester
Institute
of
Technology
June,
1972
The
Influence
of
iodide
released
during
development
on
the
course
of
development
was
Investigated
by transferring
known
amounts
of
iodide
to
Kodak
Panatomic
X
Film
and
East
man
Fine
Grain
Release
Positive
Film
(Cine
Positive)
after
exposure
and
before
development.
Iodide
wastransferred
to
the
films
being
tested
by
soaking
dry
Bimat
web
materialin
potassium
iodide
solutions
and
contacting
this
to
the
film
for
fifteen
minutes.
The
transfer
of
iodide
in
the
Bimat
to
the
film
being
tested
wasfound
to
be
essentially
com
plete.
The
iodide
reactedwith
the
grains
to
convert
silver
bromide
to
silver
iodide.
The
silver
iodide
thus
formed
appeared
to
be
in
a
separatesilver
iodide
phase
(determined
by
spectrophotometric
analysis)
rather
than
forming
a
mixedcrystal.
Known
amounts
of
iodide
weretransferred
to
the
test
films
and
developed
for
varioustimes
using
DK-50
developer,
a
developer
similar
to
DK-50
but
witha
higher
pH,
and
also
a
hydroquinone
developer
(H2Q).
Acceleration
of
Cine
Pos
itive
development
by
iodide
for
the
hydroquinone
developer
was
notedfor
low
concentrationsof
iodide
(Lainer
Effect).
In
general,
development
retardation wasobserved
for
the
for
the
same
amounts
of
transferred
iodide.
Development
time
series
with
Cine
Positive
film
were
used
with
DK-50
and
H2Q
developers
to
investigate
the
Influence
of
the
iodide
transfer
on
the
induction
period
and
developability
of
the
emulsions.
The
iodide
appeared
to
shorten
the
induction
period
of
the
hydroquinone
devel
oper
which
could
account
for
the
development
acceleration
(Lainer
Effect)
whichwas
encountered.
The
notedacceler
ation
by
iodide
of
Cine
Positive
film
developed
in
the
hydroquinone
developer
was
shown
to
be
true
acceleration
and
nota
permanent
gain
in
developability.
Retardation
of
development,
however,
wasshown
to
Increase
with
pro
longed
development
for
both
developers,
which
provides
apossible
explanation
for
edge
effects whichdo
not
dis
appear
with
prolonged
development.
Abstract
approved:
,thesis
adviser
,
title
and
department
,
date
Photographic
emulsions
rarely
consist
of
pure
silver
bromide
grains.
Most
modern
high
speed
negative emulsionsuse
iodide
to
form
mixediodobromide
grainswith
improved
properties.
The
amount
of
Iodide
useddoes
not
normally
exceed
ten
molepercent
of
the
total
halide
present.
Iodide
can
affect
the
size,
shape,
and
stress
condition
of
the
silver
halide
grains,
it
increases
the
spectral
absorp
tion
of
the
emulsion,
and
it
appears
to
promote
chemical
sensitization.
These
facts
are
well establishedand
famil
iar
to
the
photographic
chemist.
However,
the
role
iodide
plays
during
development
is
a subjectabout
which
less
is
known.
One
of
the
first
to
focus
attention
on
the
roleof
iodide
during
development
wasLainer.
Iodide
ions
in
solution
rapidly
react
withsilver
bromide
or
iodobromide
emulsion
grains;
the
iodide
ions
displace
bromide
ions
in
the
crystal
lattice,
forming
pure silveriodide.
This
situation
is
quite
different
from
emulsionprecipitation
conditions
which
form
mixediodobromide
crystals.
Lainer
found
that
by
adding
a
small amountof
iodide
to
somedeveloper,
trast
withoutchanging
threshold
speed.
He
made nodis
tinction
between
iodine
and
iodide,
although
It
is
pro
bable
that
iodine
reacted
to
giveiodide
in
the
developer.
Iodine
caused
acceleration
of
development
in
apyro
de
veloper
and
a
hydroquinone
developer
(probably
a
caustic
H2Q developer),
but
noacceleration
of
development
wasobserved
for
Eikonogen
developer.
2
Liippo-Cramer
attempted
to
explain
development
accel
eration
of
iodide
by
noting
that
some
silver
bromide
to
silver
iodide
conversion
would
occur,
and
that
in
the
process,
the
crystal
lattice
of
the
silver
halide
grainswould
be
disrupted
or
"cracked
apart."Thus,
internal
linage
would
be
revealed,
and
development
acceleration
could
be
expected.
However,
as
Stevens
discovered
for
emulsionswith
sulfur
or
sulfur
plus
goldsensitization,
"at
normalexposure
levels,
Internal
image
appeared
to
be
formed
only
in
grainswhich
also
bore
a surfaceimage.
"J Luppo-Cramer
's
explanation
of
the
"Lainer
effect"seems
ratherforced,
as
4
indicated
by
Sheppard
and
Meyer,
althoughhe
wascorrect
in
asserting
that
the
graindisintegrates
in
the
presence
of
iodide
and
exposes
internal
image.
Sheppard
and
Meyer
exploredthe
effectof
soaking
an
exposed
silver
bromide
emulsionin
a
dilute
solution
of
ment
times
between
one
and
four
minutes.
They
found
that
one
of
the
effects
of
the
iodide
was
to
reduce
the
induc
tion
period.
No
such
effects
with
ferrous
oxalate
as
the
developer
were
present.
This
difference
between developers
contributed
to
their
rejection
of
the
theory
of
"keim-blosslegung"
or
"cracking
apart"of
the
grain
and
caused
them
to
suggest
that
the
formation
of
silver
iodide
facilitates
adsorption
of
developing
agent
to
silver
halide.
Thus,
the
"revealing"of
Internal
image
is
not asufficient
explanation
for
the
Lainer
Effect.
T.
H.
James
observed
that
iodide
caused
partial
con
version
of
the
grain
surface
to
silver
iodide
and
suggested
that
silver
iodide
adsorbs
hydroquinone
and
p-hydroxyphenyl-glycine
morestrongly
than
silver
bromide.
Consistent
withthe
theory
that
adsorption
of
adeveloping
agent
is
anecessary
prerequisite
to
development,
this
wouldaccount
for
the
development
acceleration
which occurswhen
a smallamount
of
iodide
is
added
to
these
developers.
Such
an
explanation
of
the
Lainer
Effect
is
morepromising
than
Luppo-Cramer
's,
because
it
could
account
for
the
absence
of
an
effect
with
some
developers
and
its
presence
with
others.
There
appears
to
be
little
published
data
on
the
relative
strength
of
adsorptionof
developers
by
silver
beneficial.
With
the
exceptionof
the
Lainer
Effect,
the
conversion
of
silver
bromide
to
silver
iodide
causes
the
rate
of
de
velopment
to
decrease
because
silver
iodide
is
much
less
readily
developed
than
silver
bromide.
During
development,
silver
halide
is
reduced
to
silver
and
halide
ions
are
released.
The
bromide
diffuses
outinto
the
developer
and
perhapsplays
a
minor rolein
further
development,
primarily
by
reducing
fog
and
by
affecting AgBr
solubility.
7
As
notedby
Dundon
and
Ballard,
however,
the
iodide
released
from
developing
grains remainsin
the
emulsion
until
mostof
the
silver
halide
is
reduced;
it
therefore
must
be
displacing
bromide
from
the
crystallattice
of
neighboring
grains.
This
reactionhas
been
shown
to
be
very
rapid,
and
therefore
very
little
escapesout
into
p
the
developer,
at
least
initially.
An
equilibriumis
established
between
iodide
usedup
in
the
bromide
con
version
and
Iodide
in
solution(the
former
being
greatly
favored).
As
development
proceedstoward
completion
in
an
areaof
high
developable
density,
the
iodide
Is
first
deposited
in
neighboring
areasof
less
completedevelop
ment.
Eventually,
though,
the
iodide
ion
must makeits
way
outinto
the
developer
as
completionof
all
grainBallard
showed
that
increasing
exposure
made grainsof
9
diminishing
size
developable,
and
Renwick
and
Sease
demonstrated
that
the
larger
the
grain
in
one
type
of
10
emulsion,
the
higher
percentage
of
iodide
it
contained.
Together,
these
observations
would
indicate
that
moreiodide
tends
to
be
released
per
netdeveloped
silver
in
the
early
period
of
development,
and
consequently,
moreconversion
of
bromide
would
be
occurring.
Consider
also
the
observation
that
the
amount
of
halide
releasedduring
1 1
development
can
have
asolvent
action
on
further
devel
opment,
thereby
affecting
the
ratioof
solution-physical
to
chemical
development
and
covering
power
while
perhapsalso
revealing
internal
Image.
Iodide
accumulates
in
the
grains
during
development
so
that
someof
its
effectswill
be
greatertoward
the
endof
development.
Furthermore,
its
effectswill
be
relatively
greaterthe
higher
the
density.
These
dynamic
rolesplayed
by
iodide
during
development
hold
the
key
to
a
better
understanding
of
the
subtleties
of
the
development
process.
Adjacency
Effects
During
Dundon
and
Ballard's
investigation
of
iodide
released
during
development,
they
realizedthat
"a
proper
in
much
of
the
literature
which
prompts
this
research.
In
addition,
it
is
especially
worthy
of
notice
to
consider
what
effect
diffusion
of
iodide
across
an
edge
during
development
would
have
in
influencing
or
contributing
to
edge
effects
for
particular
developer-film
combinations.
3.
00--2.00
DENSITY
1.00-7
.6
DEVELOPER
CONCENTRATION
15
4
3
2
1
12345678
DISTANCE
OU)
FIGURE
1.
This
schematic
represents aparticular
instant
during
the
development
of
asharp
edgeexposure.
The
solid
curve
describes
the
developed
density
as
afunction
of
distance
and
exhibits
typical
edgeeffects.
The
dashed
line
representsa
hypothetical
concentrationprofile
(in
arbitrary
units)
of
fresh
developer
as
a
function
of
dis
ments.
One
explanationof
this
type
of
effect
has
been
that
at
the
edgeboundary,
fresh
unused
developer
is
diffusing
Into
the
adjacent
exposedregion.
This
resultsin
a
netconcentration
adjacent
to
the
edgewhich
is
higher
than
at
adistance
from
the
edge
where
exhaustion
and
therefore
de
pression
of
density
is
occurring.
Conversely,
exhausted
developer
and
by-products
from
the
highly
exposed
areadif
fuse
back
into
the
region
of
lower
exposure,
thereby
decreas
ing
the
rate
of
development
in
the
low
density
region
adjacent
to
the
edge.
It
is
important
to
notethat
this
explan
ation
for
edge
effectsis
in
terms
of
atwo-way
diffusion.
Consider,
however,
whatwould
happen
if
the
only
diffusion
whichcould
occur
were
from
the
low
density
side
of
the
edgein
the
direction
of
the
high
density
side.
Fresh
unused
developer,
for
example,
has
a netdiffusion
vector
in
the
direction
of
higher
density.
Assuming
asimple
symmetrical concentration gradientof
diffusion
across
an
X-ray
exposed edgeduring
development,
it
can
be
theorized
that
both
the
high
side
and
low
sideedge
effects
are
partially
accountedfor
by
the
gradient.
It
is
best
to
considerboth
sidesof
the
physical
edge
in
Figure
1
separately.On
the
high
density
side
of
the
actual
physical
edge andadjacent
to
the
edge,
a1 3
a
distance
from
the
edge.
Nelson
Jobserved
that
the
enhancement
of
density
at
the
edge
(border
effect)
is
not
acceleration,
but
rather
that
the
lower
density
at
a
distance
from
the
edge
is
due
to
retardation.
In
this
case,
the
relatively
lower
concentration
of
developer
at
a
distance
from
the
edge
would
result
in
a
reduced
rate
of
development
as
compared
to
the
border
effect
area
where more
fresh
developer
is
available.
The
explanation
of
the
border
effect
is
similar
to
that
for
observed
increases
in
maximumdensity
for
progressively
narrower14
lines.
*Similarly,
the
conditions
on
the
low
density
side
of
the
physical
edge
in
Figure
1
can
be
analyzed
by
noting
that
the
concentration
of
fresh
developer
at
adistance
from
the
edge
is
higher
than
the
concentration
adjacent
to
the
edge.
This
wouldaccount
for
the
relativedepression
of
density
adjacent
to
the
edge(fringe
effect).
The
fringe
effect
occursin
a
region
of
lower
densities
so
its
effect
is
smaller
than
the
border
effect.
In
this
manner,
a
considerationof
netdiffusion
of
fresh
developer
in
one
direction
can
be
assigned
as
one
possible
factor
in
creating
both
edgeeffects.
A
little
reflection
will
showthat
any
one retarderor
accelerator
of
development
which
has
a
netdiffusion
profile
across
the
edgesimilar
to
or
in
reverseto
that
of
the
fresh
in
this
hypothetical
explanation
of
edge
effects.
The
relative
contributionsof
these
sources
responsible
for
edge
effects
do
not
seem
to
be
well
documented.
The
roleof
hydrogen
ion
is
notnormally
mentionedin
connection
with
edge
effects,
although
hydrogen
ion
has
adefinite
influence
on
developer
activity.
One
source,
or
morelikely,
a
combination
of
these
sources
could
be
an
explanation
for
edge
effects.
This
analysis
mightbe
academic
if
it
were notfor
the
needto
avoid
oversimplificationwhich
could
obscureclear
analysisof
the
possibilities.
For
the
purposes
of
this
paper,
these
considerations
are
important
because
the
subject
of
concern
here
is
the
diffusion
of
iodide
ions
which
is
essentially
a
diffusion
in
one
direction
(from
high
concentration
area
to
low
concentration
area).
Similar
to
the
discussion
in
connection
withdeveloper
and
developer
by-product
diffusion
in
a
single
direction,
diffusion
of
iodide
ion
in
one
direction
could
hypothet-ically
create
or
enhance
both
edge
effects
as
diagrammed
in
Figure
1.
These
observations,
of
course,
are
hypothet
ical
because
the
shape
of
the
concentration
gradientsare
not
known
(for
example,
it
is
not
known
how
the
width
of
the
concentration
gradients
as
a
function
of
time
compares
film
type).
Nevertheless,
this
modelpoints
out
the
fact
that
although
the
iodide
diffuses
in
only
one
direction,
it
could
have
a
contributing
effectin
creating
edge
effects
on
both
the
high
and
low
density
sides
of
the
edge.
A
complete
analysis
of
this
model wouldhave
to
account
for
the
shape
of
the
concentration
profile
across
the
edge
as
afunction
of
time.
No
experimental
results
are
shown
here
to
test
the
validity
of
this
model.
The
justification
for
presenting
it
rests
on
the
observation
that
current
discussions
of
edge
effects
in
the
literature
' 'do
not go
far
enough
in
analyzing
the
consequences
of
diffusion
of
retardersand
accelerators
across
adeveloping
edge.
As
indicated,
some
workhas
been
accomplished
in
the
past
with
addition
of
iodide
to
developers.
This
tech
nique
is
inherently
limited
by
its
inability
to
state
results
in
terms
of
the
amounts
of
iodide
involved.
When
iodide
is
added
to
the
developer,
conversion
of
silver
bromide
to
silver
iodide
and
development
mustoccur
simultaneously.
Thus,
the
relative ratesof
the
two
reactions
are
of
considerableImportance
In
analyzing
results.
It
wasdecided
that
it
wouldbe
beneficial
to
transfer
known
amounts
of
iodide
to
exposedfilms
and
then
develop
them
withdifferent
developers
and
development
conditions
particular,
it
wasdesired
to
observethe
influence
of
iodide
on
development
retardation
and
acceleration,
relative
induction
periods,
relative
speed,
and
contrast
index.
The
edge
effectswhich
are
produced
by
the
diffusion
of
retarders
and
accelerators
across
adeveloping
edge
should,
In
general,
disappear
with
prolonged
development
as
completion
of
development
is
approached.
In
practice,
1
ft
edge effects
are
decreased,
but
by
no meansdisappear.
19
It
was
suspected
by
Dr.
B.
H.
Carroll
that
part
of
the
explanation
for
the
lack
of
complete
disappearance
of
edge
effects
couldbe
a
permanent
retardation
of
development
by
iodide.
One
of
the
primary
objectivesof
this
research
II.
PRELIMINARY
EXPERIMENTS
Iodide
Transfer
Technique
The
purpose
of
this
research
wasto
gain
insight
into
the
effect
on
development
of
iodide
liberated
during
de
velopment.
Because
Iodide
also
plays
arole
in
sensitizing
photographic
emulsions
to
light,
it
was
first
necessary
to
develop
a
technique
which
would
enableisolation
of
the
role
of
Iodide
releasedduring
development
from
its
other
roles.
It
is
practicalconsideration
that
varying
the
amount
of
iodide
in
the
original
emulsion
would
complicate
matters
by
confounding
the
effectof
iodide
liberated
during
development
with
its
othereffects,
for
example,
on
crystal
structure
and
chemical
sensitization.
20
A
method wasproposed
by
Dr.
B.
H.
Carroll
in
which
Bimat
Transfer
Film
(consisting
of
only
gelatinon
a
film
base)
is
used
to
transfer
aknown
amount
of
potassium
iodide
to
the
exposed
negativefilm
being
tested.
The
dry
Bimat
materialis
soaked
for
a
predeterminedlength
of
time
in
a
solution
of
potassiumIodide
having
a
con
centration
such
that
the
desired
amount
of
potassium
iodide
per
unit areais
absorbed.
Then,
the
Bimat
is
cleared
of
surface
droplets
and
placed
in
intimate
contact
in
contact
until
completion
of
transfer
is
accomplished.
It
wasanticipated
that
the
transfer
of
iodide
would
be
nearly
completebecause
of
the
conversion
of
silver
bromide
to
silver
iodide.
Subsequently,
the
film
is
processed
and
the
change
in
the
development
response
of
the
film
is
analyzed.
Having
decided
on
a
generaltechnique
of
iodide
transfer,
it
was
also
necessary
to
find
the
best
methodof
imple
menting
the
transfer
technique
and
to
choose
the
proper
films,
developers,
and
development
conditions
to
demonstrate
the
role
of
iodide
released
during
development.
The
in
vestigations
included
spectrophotometric
analysis
of
film
with
different
amounts
of
iodide
transferred
to
it,
the
determination
of
the
degree
of
completion
of
transfer
of
the
iodide
to
the
negative
emulsion,
and
silver
analysis
to
determine
coating
weight
of
the
film
types
chosen.
Developers
An
important
consideration
in
the
experimentsperformed
was
the
choiceof
developing
agents
and
developer
formu-21
lations.
Sheppard
and
Meyer
in
their
experimental
observations
of
the
Lainer
Effect
used
a
hydroquinone
carbonate
developer.
They
also
indicated
that
iodide
can
accelerate
development
by
hydroquinone
developers,
but
can
only
decrease
the
rate
of
development
with
Metol
as
the
a
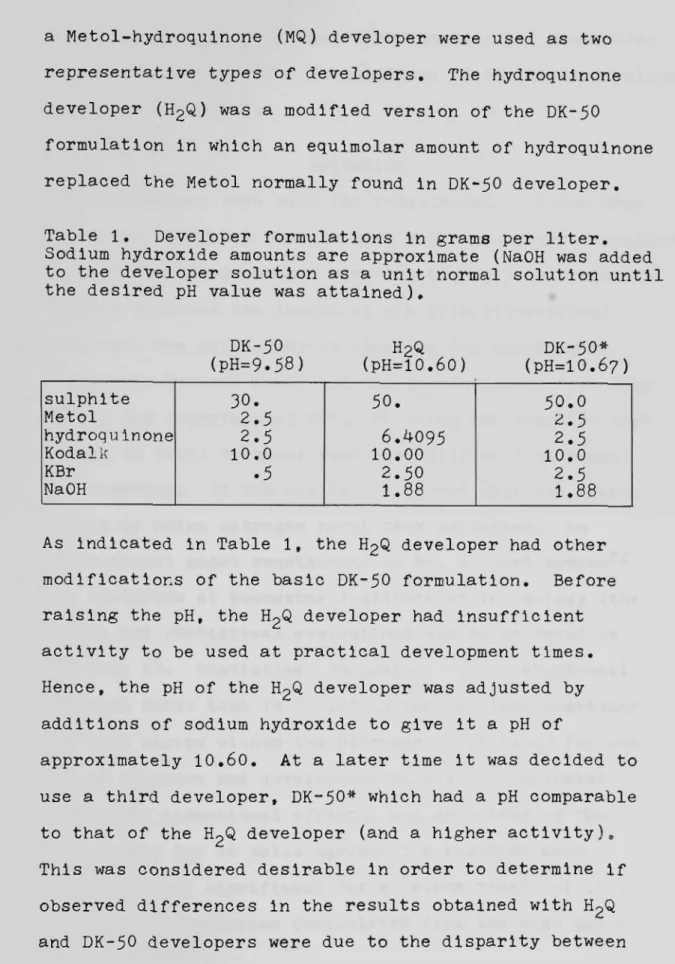
Metol-hydroquinone
(MQ)
developer
were
used
as
two
representative
types
of
developers.
The
hydroquinone
developer
(H2Q)
wasa
modified
version
of
the
DK-50
formulation
In
which
an
equimolar
amount
of
hydroquinone
replaced
the
Metol
normally
found
in
DK-50
developer.
Table
1.
Developer
formulations
in
grams
per
liter.
Sodium
hydroxide
amounts
are
approximate
(NaOH
wasadded
to
the
developer
solution
as
a
unit
normalsolution
until
the
desired
pH
value
was
attained).
DK-50
(PH=9.58)
H2Q
(pH=10.60)
DK-50*
(pH=l0.67)
sulphite
30.
50.
50.0
Metol
2.5
2.5
hydroquinone
2.5
6.4095
2.5
Kodalk
10.0
10.00
10.0
KBr
.52.50
2.5
NaOH
1.88
1.88
As
indicated
in
Table
1,
the
H2Q
developer
had
other
modifications
of
the
basic
DK-50
formulation.
Before
raising
the
pH,
the
H2Q
developer
had
insufficient
activity
to
be
used
at
practical
development
times.
Hence,
the
pH
of
the
H2Q
developer
wasadjusted
by
additions
of
sodium
hydroxide
to
giveit
a
pH
of
approximately
10.
60.
At
alater
time
it
was
decided
to
use
a
third
developer,
DK-50*which
had
a
pH
comparable
to
that
of
the
H2Q
developer
(and
a
higher
activity).
This
was
considered
desirable
in
order
to
determine
if
observed
differences
in
the
results obtainedwith
H2Q
their
pH
levels,
or
if
they
were
due
to
other
properties
of
the
developers.
The
formulations
of
the
three
developers
are
found
in
Table
1.
Agitation
Preliminary
workwith
the
Kodak
Model
11
Color
Drum
Processor
indicated
that
it
gavevery
consistent
agitation.
Some
of
its
disadvantages
werethe
tendency
to
produce
a
density
gradient
the
length
of
the
film
(directional
effects),
the
difficulty
of
cleaning
the
mounting
net
adequately
between
runs,
and
the
limitation
to
five
35mm
strips
per
experimental
run.
Mounting
and
removing
test
strips
in
total
darkness
werealso
difficult
at
times.
Therefore,
it
was
decided
to
Investigate
the
feasi
bility
of
using
nitrogen
burst
tank
agitation.
An
experimental
modelconstructed
by
Mr.
Richard
Norman^was
available
at
Rochester
Institute
of
Technology
(the
design
and
statistical
evaluationsare
to
be
found
in
Appendix
C).
Statistical
evaluation
of
the
eight-well
nitrogen
burst
tank
(a
"well"is
one
of
eight
positions
for
test
strips
within
the
nitrogenburst
tank)
for
oneset
of
exposure
and
development
parameters
indicated
negligible
directional
effects,
and
an
F-test
of
the
mean
square
due
to
wells againstthe
residual
mean
23
square was
not
significant
for
an
alpharisk
Jof
.05.x
due
to
wellsonly)
versusdensity
is
plotted
below.
.022 T
.020
.018
.016
.014
.012
.010
.008
.006
.004
.002
X
DENSITY
SD
.41 .001?
.80 .0097
1.25
.01201.76
.01602.25
.01812.67
.0179.4 .6 .8
1.0
.2 .4 .6 .82.0
.2 .4 .6 .8DENSITY
FIGURE
2.
The
standarddeviation
due
to
wells,
only,
versus
density
for
sixdevelopment
runs and eightCine
Positive
test
strips per run(Appendix
C).
In
allcases,
however,
the
mean squaredue
to
runs wassignificant,
andit
was apparentthat
considerable carewould
be
requiredto
lower
the
variability
due
to
runs.
It
became
apparent asthe
research proceededthat
constantdevelopment
temperature
was one ofthe
most strict requirements
for
reproducibility.
The
introduction
ofthe
film
temperature
into
the
developer
brought
about
a
change
in
temperature
of
the
developer.
A
simple
water
bath
around
the
nitrogen
burst
tank
was
not
an
adequate
remedy
because
the
Plexiglas
materialcomposing
the
nitrogen
burst
tank
apparatus
was
a
relatively
good
Insulator
and
took
a
goodwhile
to
equilibrate.
The
nitrogen
burst
tank
represents
an
improvement
over
the
Model
11
Color
Drum
Processor
in
almost
all
other
categories
of
problems.
The
nitrogenburst
tank
is
repeatable
and
has
little
or
no
directional
effects
(Appendix
C).
It
can
process
eight
test
strips
at
a
time,
can
be
easily
and
thoroughly
cleaned
between
runs,
and
can
be
handled
easily
in
total
darkness.
A
technique
of
pre-coollng
the
film
carrier
to
bias
the
temperature
difference
between
carrier
and
developer
was
derived.
Temperature
maintenanceremained
a
primary
source
of
variability
throughout
this
research,
however.
Quantitative
Iodide
Analysis
One
of
the
primary
objectivesof
this
research
was
to
determine
the
quantitativeeffects
of
iodide
on
develop
ment.
It
wastherefore
necessary
to
devise
a
method
whereby
the
amountsof
iodide
transferred
to
the
film
via
Bimat
web
materialcould
be
accurately
determined.
Initially,
two
possible procedures presentedthemselves.
The
Bimat
web
materialcould
be
weighedbefore
being
placed
in
the
iodide
solution
and
then
weighed
again
The
other
technique
wouldinvolve
potentiometric
titrations
of
representative
Bimat
web
materialboth
before
and
after
transfer
of
iodide
solution
to
the
test
film
to
determine
completion
of
transfer.
The
first
technique
seemed
to
be
the
better
at
first,
because
potentiometrictitration
requires
much
moretime
and
effort,
and
it
mightnot
be
moreaccurate.
Determin
ation
of
iodide
transfer
by
making
weightdeterminations
depended
on
severalfactors
which
required
analysis.
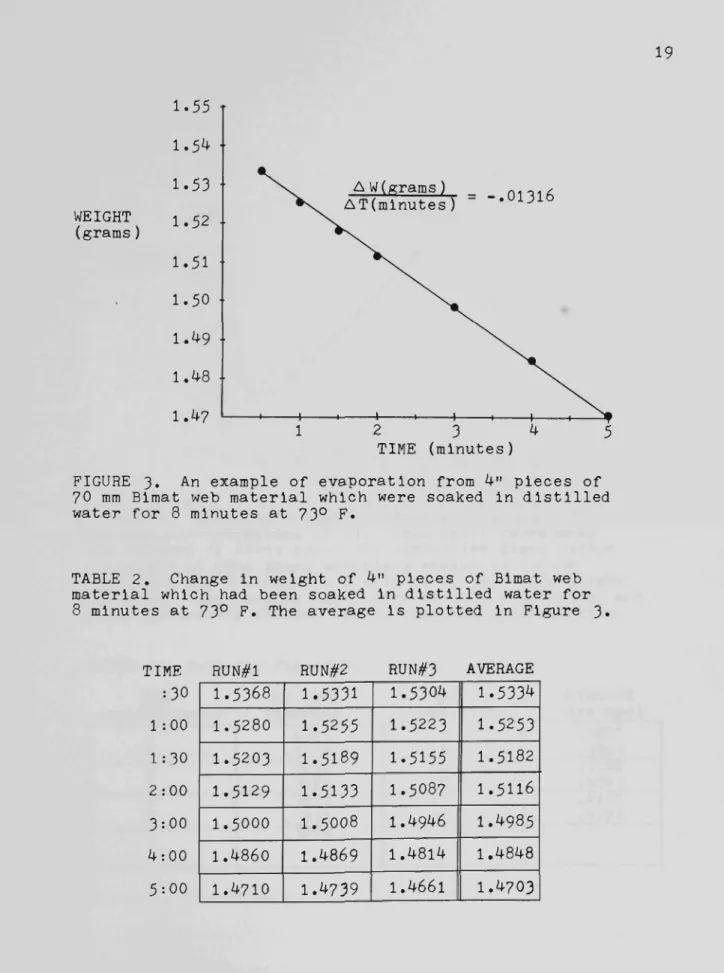
The
time
interval
between
removal
of
the
Bimat
from
solution
and
subsequent
weighing
introduced
a weightloss
error
due
to
evaporation.
This
could
be
easily
remedied
by
producing
a
graph
showing
weightloss
per
unit
areaof
solution-soaked
Bimat
materialas
afunction
of
time
(Figure
3)
and
using
this
to
makethe
appropriate
calculation
cor
rections.
Also,
the
density
of
iodide
solutions
increases
with
increasing
concentration,
and
It
wasanticipated
that
the
volume
of
solution
taken
up
by
the
Bimat
materialwould
be
afunction
of
KI
concentrationdue
to
the
effect
of
salts
on
the
swelling
of
emulsions.
The
graph
in
Figure
4
(corrected
for
changein
solution
density
and
weight
loss
due
to
evaporation)
indicates
the
weight
of
solution
taken
in
by
Bimat
web
materialas
a
function
of
KI
concentration
at
73Fahrenheit.
The
data
is
found
WEIGHT
(grams
)
1.55
1.54
1.53
1.52
1.51
1.50
1.49
1.48
1.4?
A
W(
grams)
AT
(minutes)
= -.01316
2
3
4
TIME
(minutes)
FIGURE
3.
An
example of evaporationfrom
4" pieces of70
mmBimat
web material which were soakedin
distilled
water
for
8
minutes at 73F.
TABLE
2.
Change
in
weight of 4" pieces ofBimat
web material whichhad
been
soakedin
distilled
waterfor
8
minutes at 73F.
The
averageis
plottedin
Figure
3,
TIME
:30
1
:001
:302
003
00
4
00
5
00
RUN#1
RUN#2
RUN#3
AVERAGE
1.5368
1.5331
1.5304
1.5334
1.5280
1.5255
1.5223
1.5253
1.5203
1.5189
1.5155
1.5182
1.5129
1.5133
1.5087
1.5H6
A
VOLUME
(ml)
TEMP.=
73
F
12
16
20
24
28
32
36
\Kl\
(grams
perliter)
FIGURE
4.
Solution
intake
ofBimat
web materialfor
various
concentrations
ofKI.
Each
point representsthe
average ofthree
carefully
controlled
Bimat
strips(4
inches
of70mm
Bimat
material)
soakedin
iodide
solutions
for
8
minutes and weighedto
determine
weightincrease.
The
weights were correctedfor
evaporation
andsolution
density
changesdue
to
changing
concentration.
TABLE
3.
Data
for
Figure
4.
AVOLUME
.ter)
(average)
[Kll
(
grams/111
[KI]
(grams/liter)
AVOLUME
(average
)
0
1
.4025
.3934
7
8
.3827
.3864
2
3
.3890
.3787
14
20
.39^2
.4043
h
5
.3819
.3837
28
35
.4182
The
weight
determination
procedure
depends
on
the
magnitude
of
the
ratio
of
aqueous
iodide
concentration
in
the
Bimat
gelatin
to
the
iodide
concentration
of
the
bulk
KI
solution,
and
it
assumes
that
the
transfer
of
iodide
is
complete.
It
wasanticipated
initially
that
the
distribution
coefficient
of
iodide
between
free
solution
and
solution
imbibed
by
Bimat
was
equal
to
unity
for
all
concentrations
of
the
KI
solution.
These
assumptions
required
testing.
To
determine
the
degree
of
completion
of
the
con
version
of
silver
bromide
to
silver
iodide
when
contacting
the
iodide-soaked
Bimat
materialto
afilm
sample,
an
experiment
wasundertaken
in
whichpotentiometric
titration
was
used
to
analyze
the
Bimat
materialfor
residual
iodide
after
transfer.
Four
inch
samplesof
70mm
Bimat
material
were
soaked
in
solutions
of
5.75
gramsand
13*91
gramsof
potassium
iodide
per
liter
for
ten
minutes.
The
Bimat
mater
ial
wasthen
squeegeed
and
contactedto
Cine
Positive
5302
35mm
film
for
approximately
fifteen
minutes.
After
this,
the
Bimat
samples
wereseparated
from
the
Cine
Positive
film,
cut
into
easily
handled
strips,
and
soaked
in
25ml
of
distilled
deaerated
water.
A
total
of
four
25ml
soakings
were
accomplished
per
sampleand
the
aqueous
solution
collected
after
each
soak.
The
solutionswere
then
analyzed
for
halide
content
by
potentiometric
silver
(Figure
5
and
Figure
6).
When
titrating
the
halide
solu-tion
with
1x10
N
silver
nitrate
solution,
a
silver
electrode
and
apotassium
nitrate
filled
reference
elec
trode
were
used.
Similarly,
for
each
concentration
four
inch
samples
of
70mm
Bimat
material,
soaked
in
the
iodide
solution
and
squeegeed,
were
extracted
and
analyzed
for
potassium
iodide.
Two
replications
of
this
procedure
were
undertaken.
The
values
are
found
in
Table
13.
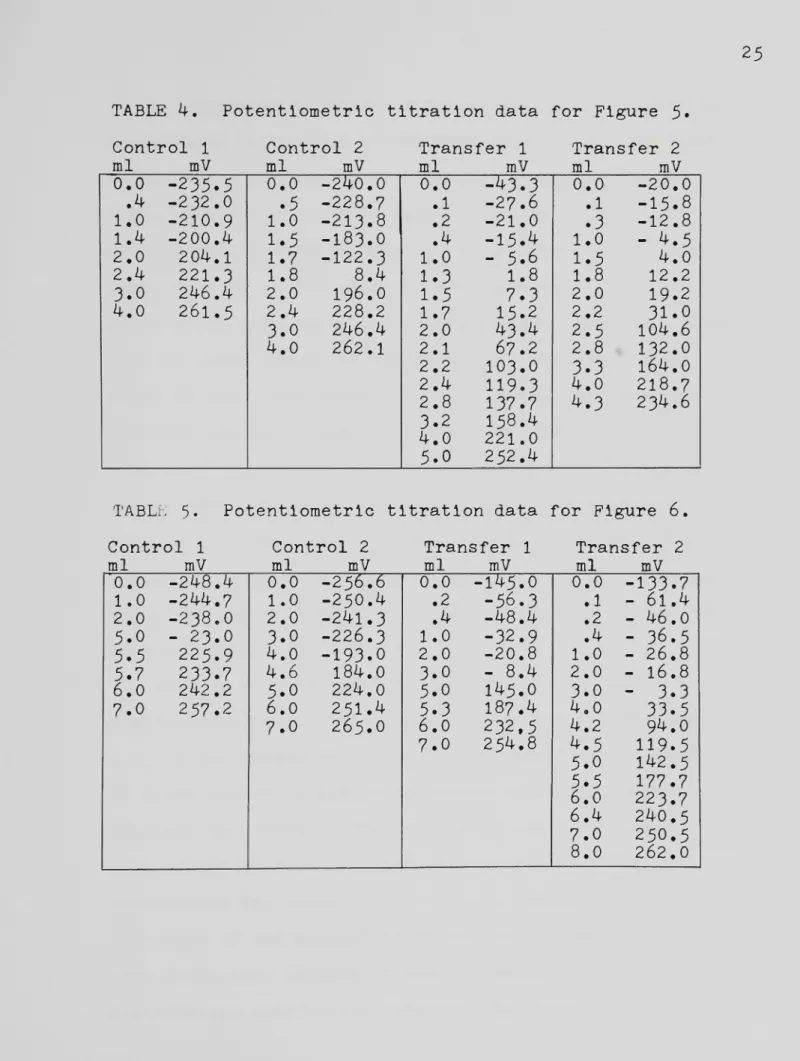
As
indicated
in
Figure
6
and
Table
5,
there
was
very
little
iodide
remaining
in
the
Bimat
after
transfer
for
the
1391
gram/liter
KI
solution.
The
equivalence
point
_p
was
reached
before
.1 millilitersof
1x10
molar
AgNOo
had
been
used
in
the
titration
of
the
iodide
transfer
samples.
The
control
strips
in
Figure
6
contained
molaramounts
of
iodide
equivalent
to
4.7
millilitersof
lxl0~cmolar
silver
nitrate.
Thus,
less
than
two
percent
(
x
100)
of
the
original
iodide
remained
in
the
Bimat
4
.(
after
transfer.
The
potentiometric
titration
of
iodide
remaining
in
Bimat
after
transfer
for
a
5.75
grams/literKI
concentration
is
shown
in
Figure
5.
The
end
point
could
not
be
ascer
tained
due
to
the
extremely
small amountof
iodide
re
maining
in
the
Bimat.
It
wastherefore
considered
adequate
to
assume
that
the
transfer
of
iodide
between
Bimat
and
mV
300T
200
100-
0--
-100--
-200--300
1
2
Milliliters
FIGURE
5.
Potentiometric
titration
of
extractionsof
4
inch
samples
of
70
mm
Bimat
materialsoaked
In
a
5.75
gram/litersolution
of
potassium
iodide.
Two
extractions
weretitrated
for
Bimat
samples
before
transfer
to
Cine
Positive
film,
curvea,
and
two
extractions
were
titrated
for
Bimat
samples
allowed
to
transfer
its
iodide
300T
200
--mV
-100
-200
2
4
6
8
Milliliters
of
AgN03
(1X10"2
n)
10
FIGURE
6.
Potentiometric
titrations
of
extractions
from
4
inch
samples
of
70
mmgrams/liter
solution
of
were
titrated
for
Bimat
Positive
film,
curve
a,
for
Bimat
samples
which
Iodide
to
Cine
Positive,
Bimat
material
soaked
In
a
13.91
potassium
iodide.
Two
extractions
samples
before
transfer
to
Cine
and
two
extractions
were
titrated
were
allowed
to
transfer
their
TABLE
4.
Potentiometric
titration
data
for
Figure
5.
Control
1
Control
2
Transfer
1
Trans
;fer
2
ml mV ml mV ml mV ml
mV
o.o
-235.5
0.0
-240.00.0
-43.3
0.0
-20.0.4 -232.0 .5 -228.7 .1 -27.6 .1 -15.8
1.0
-210.91.0
-213.8 .2 -21.0 .3 -12.81.4
-200.41.5
-183.0 .4 -15.^1.0
-4.5
2.0
204.1
1.7
-122.31.0
-5.6
1.5
4.0
2.4
221.3
1.8
8.4
1.3
1.8
1.8
12.2
3.0
246.4
2.0
196.0
1.5
7.3
2.0
19.2
4.0
261.5
2.4
228.2
1.7
15.2
2.2
31.0
3.0
246.4
2.0
43.4
2.5
104.6
4.0
262.1
2.1
67.2
2.8
132.0
2.2
103.0
3.3
164.0
2.4
119.3
4.0
218.7
2.8
137.7
4.3
234.6
3.2
158.4
4.0
221.0
5.0
252.4
TABLh
5.
Potentiometric
titration
data
for
Figure
6.
Control
1
ml mV
Control
2
ml mV
Transfer
1
ml mV
Trans
ml
fer
2
mV
0.0
-248.40.0
-256.60.0
-145.00.0
-133.71.0
-244.71.0
-250.4 .2-56.3
.1 -61.4
2.0
-238.O2.0
-241.3 .4 -48.4 .2 -46.0
5.0
-23.0
3.0
-226.3
1.0
-32.9 .4 -36.5
5.5
225.9
4.0
-193.02.0
-20.81.0
-26.8
5*7
233.7
4.6
184.0
3.0
-8.4
2.0
-16.8
6.0
242.2
5.0
224.0
5.0
145.0
3.0
-3.3
7.0
257.2
6.0
251.4
5.3
187.4
4.0
33.5
7.0
265.0
6.0
232,5
4.2
94.0
7.0
254.8
4.5
5.0
5*5
6.0
6.4
7.0
8.0
119.5
142.5
177.7
By
referring
to
Figure
3
and
Figure
4,
it
is
possible
to
estimate
the
volume
of
solution
taken
in
by
the
Bimat
strips
and
consequently
the
expected
amount
of
iodide
being
titrated.
For
5.75
grams
of
KI
per
liter,
.3805milliliters
of
solution
should
be
absorbed
which
corres
ponds
to
2.19
x
10~3grams
of
KI.
However,
3.0
x
10"*
3
grams
of
KI
were
found
by
potentiometric
titration.
This
is
1.37
times
morethan
was
expected.
For
the
13*91
grams
KI
per
liter
concentration,
.394milliliters
of
solution
should
be
absorbed,
which
is
equivalent
to
5.48
x
10*"^ gramsof
iodide.
But
7.802
x
10"^grams
of
iodide
weredetermined
via
potentiometric
titration.
This
is
1.42
times
the
amount
which
was
expected.
The
reason
for
these
discrepencies
mustbe
that
the
acqueous
concentration
of
iodide
in
the
Bimat
materialis
notthe
same
as
in
the
bulk
solution.
Because
the
distribution
coefficient
for
iodide
in
a
gelatin-aqueoussolution
environment
wasgreater
than
1.0,
it
was
necessary
to
use
potentiometrictitrations
of
Bimat
soaked
in
iodide
solutionsof
varied
concen
trations
to
establish
the
amountsof
iodide
actually
transferred
to
film.
Weight
determination
of
iodide
transferred
was
therefore
abandoned.Potentiometric
titration
of
one
concentrationof
iodide
would
not
have
been
sufficientbecause
it
was notcertain
that
the
iodide
and
free
solution
wasIndependent
of
concentration.
Knowledge
of
the
distribution
coefficients
as
a
function
of
concentration
would
be
sufficient
in
itself
to
enable
the
determination
of
molepercent
iodide
transferred
because
the
conversion
is
essentially
complete
as
was
indicated
in
Figure
5
and
Figure
6.
The
results
of
the
potentiometric
titrations
are
shown
in
Table
6,
and
the
data
is
plotted
in
Figure
7.
From
these
experiments
and
determination
of
the
emulsion
coating
weights(grams
of
silver
per
unit
area),
it
would
be
possible
to
calculate
the
concentrations
of
potassium
iodide
Bimat
soak
solutionsnecessary
to
accom
plish
the
conversion
of
a
known
molepercent
of
the
emul
sion
silver
bromide
to
silver
iodide.
Silver
and
Iodide
Analysis
To
express
the
transfer
of
iodide
in
terms
of
molepercent
of
the
total
halide
presentin
the
emulsion,
potentiometric
titration
analysisfor
silver
per
unit
area was
undertaken
for
both
emulsions.
Cine
Positive
5302
Film
and
Panatomic
X
Film
(Appendix
B).
It
wasdeter
mined
from
two
replicationsthat
the
Pan
X
coating
weight
was
approximately
2.94
gramsof
silver
per
square
meter,
and
the
Cine
Positive
5302
film
had
a
coating
weight
of
3.90
gramsof
silver
per
squaremeter.
The
original
70.0
60.0
eg
u
50.
of
|
40.0
^'o30.o
O *-H
B X
.
20.0
10.0
2.0
\ 1 1 1 i
1
o.o
ITF
LOG
[KEE]
, grams perliter
FIGURE
7.
This
graph showsthe
number of moles of potassium
iodide
per square meter extractedf