Specificities of Human CD4
ⴙ
T Cell Responses to an Inactivated
Flavivirus Vaccine and Infection: Correlation with Structure and
Epitope Prediction
Julia Schwaiger,aJudith H. Aberle,aKarin Stiasny,aBernhard Knapp,b,cWolfgang Schreiner,cIngrid Fae,dGottfried Fischer,d Ondrej Scheinost,eVaclav Chmelik,fFranz X. Heinza
Department of Virology, Medical University of Vienna, Vienna, Austriaa; Department of Statistics, Protein Informatics Group, University of Oxford, Oxford, United Kingdomb;
Section of Biosimulation and Bioinformatics, Medical University of Vienna, Vienna, Austriac; Department of Blood Group Serology and Transfusion Medicine, Medical
University of Vienna, Vienna, Austriad; Laboratory of Molecular Genetics, Hospital Cˇeské Bude˘jovice, Cˇeské Bude˘jovice, Czech Republice; Department of Infectious
Diseases, Hospital Cˇeské Bude˘jovice, Cˇeské Bude˘jovice, Czech Republicf
ABSTRACT
Tick-borne encephalitis (TBE) virus is endemic in large parts of Europe and Central and Eastern Asia and causes more than
10,000 annual cases of neurological disease in humans. It is closely related to the mosquito-borne yellow fever, dengue, Japanese
encephalitis, and West Nile viruses, and vaccination with an inactivated whole-virus vaccine can effectively prevent clinical
dis-ease. Neutralizing antibodies are directed to the viral envelope protein (E) and an accepted correlate of immunity. However, data
on the specificities of CD4
ⴙT cells that recognize epitopes in the viral structural proteins and thus can provide direct help to the
B cells producing E-specific antibodies are lacking. We therefore conducted a study on the CD4
ⴙT cell response against the
vi-rion proteins in vaccinated people in comparison to TBE patients. The data obtained with overlapping peptides in interleukin-2
(IL-2) enzyme-linked immunosorbent spot (ELISpot) assays were analyzed in relation to the three-dimensional structures of the
capsid (C) and E proteins as well as to epitope predictions based on major histocompatibility complex (MHC) class II peptide
affinities. In the C protein, peptides corresponding to two out of four alpha helices dominated the response in both vaccinees and
patients, whereas in the E protein concordance of immunodominance was restricted to peptides of a single domain (domain III).
Epitope predictions were much better for C than for E and were especially erroneous for the transmembrane regions. Our data
provide evidence for a strong impact of protein structural features that influence peptide processing, contributing to the
discrep-ancies observed between experimentally determined and computer-predicted CD4
ⴙT cell epitopes.
IMPORTANCE
Tick-borne encephalitis virus is endemic in large parts of Europe and Asia and causes more than 10,000 annual cases of
neuro-logical disease in humans. It is closely related to yellow fever, dengue, Japanese encephalitis, and West Nile viruses, and
vaccina-tion with an inactivated vaccine can effectively prevent disease. Both vaccinavaccina-tion and natural infecvaccina-tion induce the formavaccina-tion of
antibodies to a viral surface protein that neutralize the infectivity of the virus and mediate protection. B lymphocytes
synthesiz-ing these antibodies require help from other lymphocytes (helper T cells) which recognize small peptides derived from proteins
contained in the viral particle. Which of these peptides dominate immune responses to vaccination and infection, however, was
unknown. In our study we demonstrate which parts of the proteins contribute most strongly to the helper T cell response,
high-light specific weaknesses of currently available approaches for their prediction, and demonstrate similarities and differences
be-tween vaccination and infection.
F
laviviruses are the most important causes of
arthropod-trans-mitted viral infections in humans and include yellow fever
(YF), dengue (DEN), Japanese encephalitis, West Nile (WN), and
tick-borne encephalitis (TBE) viruses (
1
). With all of these viruses,
the induction of neutralizing antibodies is believed to be
respon-sible for long-term immunity after natural infection and
vaccina-tion (
2
,
3
). Effective B cell responses, however, are strongly
depen-dent on the induction of antigen-specific CD4
⫹T cells that
contribute to affinity maturation, isotype switching, and
immu-nological memory (
4
,
5
). Their stimulation requires the uptake of
antigen and its proteolytic processing into peptides by
antigen-presenting cells (APCs) (
6
,
7
), association of peptides with major
histocompatibility complex (MHC) class II (MHC-II) molecules
(HLA-DRB1, -DRB3/4/5, -DP, and -DQ) (
8
,
9
), and transport of
these complexes to the plasma membrane for specific interactions
with T cell receptors (TCRs) (
10
). The process from antigen
up-take to stimulation of CD4
⫹T cells is thus highly complex, and, at
each of the steps, restrictions in the generation and selection of
peptides can occur. These variables, together with
individual-spe-cific variations of the TCR repertoire that affect the selection of
peptide–MHC-II complexes with appropriate affinities, limit the
diversity of CD4
⫹T cell responses in individuals and are
respon-sible for the phenomenon of immunodominance, i.e., the
restric-Received18 February 2014 Accepted22 April 2014
Published ahead of print30 April 2014
Editor:M. S. Diamond
Address correspondence to Franz X. Heinz, [email protected].
Supplemental material for this article may be found athttp://dx.doi.org/10.1128 /JVI.00196-14.
Copyright © 2014, American Society for Microbiology. All Rights Reserved.
doi:10.1128/JVI.00196-14
on November 7, 2019 by guest
http://jvi.asm.org/
tion of CD4
⫹T cell specificities to a limited number of epitopes
from complex protein antigens. Furthermore, the mode of
anti-gen delivery (i.e., infection and endoanti-genous protein synthesis in
APCs versus delivery of exogenous antigens after immunization
with inactivated or subunit vaccines) as well as adjuvants can
modulate the selection of peptides from proteins with the same
primary structures (
11–13
).
Direct cell-cell interactions of B cells with CD4
⫹T cells,
re-quired for efficient antibody production, are mediated by the TCR
specifically recognizing peptide–MHC-II complexes on the B cell.
These peptides are generated from protein antigens that are
bound and endocytosed by B cells through their cognate B cell
receptors; i.e., they are derived from the same protein or protein
complex which also carries the epitope recognized by the B cell.
Data obtained with influenza virus and hepatitis B virus (HBV)
(
14–18
) indicate that B cells can internalize whole virus particles,
and peptides derived from internal proteins of the virion can
therefore also function as helper T cell epitopes for the production
of neutralizing antibodies targeting the envelope proteins.
In our study, we have used the TBE virus system to compare the
specificity and immunodominance of CD4
⫹T cell responses
in-duced by the viral structural proteins contained in the aluminum
hydroxide-adjuvanted inactivated whole-virus TBE vaccine to
those induced by the same proteins after natural infection. Such
comparative analyses of CD4
⫹T cell responses to replicating and
nonreplicating viruses have not been conducted so far. Based on
the known atomic structures of viral proteins, we also investigated
influences of protein structural factors on patterns of
immu-nodominance and evaluated specific strengths and weaknesses of
computer prediction of epitopes by comparison with
experimen-tally determined data. The algorithms underlying these T cell
epitope prediction programs consider only the interaction
strength between peptides and MHC-II molecules and not the
preceding steps of antigen processing and transport or
interac-tions between peptide–MHC-II complexes and TCRs (
19
).
Like flaviviruses in general, TBE virus is a small enveloped virus
(diameter, ca. 50 nm) that is composed of only three structural
proteins, the capsid protein C and two membrane-associated
pro-teins, prM/M and E (
Fig. 1A
). prM (precursor of M) is a
compo-nent of immature particles and is proteolytically cleaved during
virus maturation, leaving M in the membranes of fully infectious
virions. The E (envelope) protein mediates viral entry functions
(binding to cell surfaces and membrane fusion after
receptor-me-diated endocytosis) and is the principal target of neutralizing
an-tibodies (
20
). Structurally, flaviviruses are among the best-studied
enveloped viruses. The overall protein organizations of immature
and mature virus particles have been determined by cryo-electron
microscopy (
21
,
22
), and X-ray crystallographic structures are
available for soluble forms of E (sE) proteins (
Fig. 1A
) from several
flaviviruses, including TBE virus (
23
). The structure of C has been
determined for Kunjin (KUN) virus (a variant of WN virus) (
1
)
and is assumed to be similar to that of TBE virus in terms of
sequence homology and secondary structure predictions (
24
).
Our data revealed immunodominant regions in both C and E
that correlated with specific protein elements and domains,
pro-viding evidence for a strong influence of structural properties on
antigen-processing and MHC-II-loading pathways. Some, but not
all, of the immunodominant sequences were identical in
vacci-nated and infected individuals, suggesting that the generation
and/or presentation of certain peptides differs between infection
and immunization with an inactivated adjuvanted vaccine. An
excellent match of experimentally determined and
in silico
pre-dicted epitopes was found for the immunodominant regions in C,
but much less concordance characterized the predictions for the
envelope proteins prM/M and E, reflecting the protein-specific
impact of steps in the antigen-processing and CD4
⫹T cell
stimu-lation pathways that are not considered in the prediction
pro-grams.
MATERIALS AND METHODS
Study design and patients.Analyses of CD4⫹T cell responses were per-formed with peripheral blood samples. The first study group included 40 healthy Caucasians (age range, 18 to 77 years; median age, 63 years; 21 female and 19 male) who received a booster vaccination with an inacti-vated whole-virus TBE vaccine (FSME-Immun, 0.5 ml; Baxter). Periph-eral blood samples were taken 13 to 38 days after booster vaccination. None of the participants had taken immunosuppressive drugs or had any acute infection, clinically significant disease, or any health condition known to influence immune responses.
The second study group consisted of 47 Caucasians (age range, 18 to 81 years; median age, 52 years; 25 female and 22 male) hospitalized with clinical symptoms of acute TBE virus infection at the Hospital Cˇ eské Bude˘jovice, Czech Republic. TBE virus infection was confirmed by TBE virus-specific IgG and IgM analysis of acute plasma samples. Peripheral blood samples were taken 6 to 73 days (median, 22 days) after the first symptom. For three patients the exact day of symptom onset was not known.
As a negative control, samples of five TBE-seronegative Caucasians (age range, 21 to 75 years; median age, 24 years; 3 female and 2 male) who had no history of TBE vaccination or infection were analyzed. None of the negative controls had taken immunosuppressive drugs or had any acute infection, clinically significant disease, or any health condition known to influence immune responses.
Ethics statement.The studies were approved by the ethics committees of the Medical University of Vienna, Austria (approval no. 590/2007), and the Hospital Cˇ eské Bude˘jovice, Czech Republic (approval no. 8/2008). Written informed consent was obtained from all participants.
Preparation of blood samples.For T cell assays, peripheral blood mononuclear cells (PBMCs) were isolated from whole-blood samples col-lected in sodium citrate tubes by density gradient centrifugation using Ficoll-Paque Plus (GE Healthcare) and cryopreserved for future use.
Serum or plasma samples were stored at⫺20°C until analysis.
CD8 depletion.Frozen PBMCs were thawed and diluted 1:10 in RPMI 1640 medium (Sigma) containing CTL Wash Supplement (Cellular Tech-nology Limited), 1% glutamine (Sigma), and 50 units/ml Benzonase (No-vagen) according to the instructions of Cellular Technology Limited. PBMCs were depleted of CD8⫹T cells using anti-CD8 antibody-coated immunomagnetic beads and LD columns (Miltenyi Biotec), according to the manufacturer’s instructions. The CD8-depleted PBMCs were resus-pended in serum-free medium (AIM-V; Gibco). After overnight incuba-tion at 37°C in 5% CO2, the cells were counted, centrifuged at 300⫻g for
10 min, and resuspended at a final concentration of 2⫻106cells/ml in
AIM-V medium for use in interleukin-2 (IL-2) enzyme-linked immu-nosorbent spot (ELISpot) assays.
The purity of CD8-depleted PBMC samples was assessed by flow cy-tometry using anti-CD3-phycoerythrin (PE), anti-CD8-allophycocyanin (APC), and 7-aminoactinomycin D (7-AAD) (all, BD Bioscience), which usually detectedⱕ1% CD8⫹CD3⫹T cells.
Peptides.A total of 188 15-mer peptides overlapping by 11 amino acids (aa) to cover the entire amino acid sequences of the C, prM/M, and E proteins from TBE virus Neudörfl strain (NCBI GI 27596775, GI 27596776, and GI 27596778) were synthesized by and purchased from JPT (Berlin, Germany). The purity of all peptides was⬎70% as determined by high-performance liquid chromatography. The peptides were grouped into three maxipools, which contained all peptides that covered each of
on November 7, 2019 by guest
http://jvi.asm.org/
the TBE virus proteins C (n⫽26), prM/M (n⫽40), and E (n⫽122). In addition, up to 12 peptides were arranged into minipools of C (n⫽10), prM/M (n⫽13), and E (n⫽22), with each peptide present in two different minipools, as described previously (25). To confirm positive results obtained with these minipools, samples were then tested with sin-gle peptides. Peptide pools and sinsin-gle peptides were dissolved in dimethyl sulfoxide (DMSO) at a concentration of 1.25 mg of each peptide/ml and then diluted in AIM-V medium at a concentration of 8g of each peptide/ ml. These stock solutions were kept frozen at⫺20°C until use.
IL-2 ELISpot assay.The IL-2 ELISpot assay (Mabtech) was performed essentially according to the manufacturer’s instructions. Briefly, polyvi-nylidene difluoride (PVDF)-ELISpot plates (Millipore) were treated with 70% ethanol for 30 min before being coated with 1g of IL-2 anti-body (IL-2-I/249). Plates were blocked with medium (RPMI 1640 me-dium; Sigma) containing 10% human serum (PAA), 1%
penicillin/strep-tomycin/glutamine (Gibco), and 1% nonessential amino acids (Sigma) for 1 to 3 h at 37°C in 5% CO2. After plates were washed with
phosphate-buffered saline (PBS), 50l of AIM-V medium (Gibco) and 2⫻105
CD8-depleted PBMCs in 100l of AIM-V medium (see “CD8 depletion” above) were added per well. The cells were then stimulated with 50l of either pooled peptide or single peptide at a final concentration of 2g of each peptide/ml or with 0.5g/ml phytohemagglutinin as a positive con-trol. As a negative control, AIM-V medium was used. After incubation for about 45 h at 37°C in 5% CO2, the plates were washed twice with PBS
containing 0.05% Tween 20 and twice with PBS. Spots were developed with 0.05g of biotin-conjugated antibody (IL-2-II) for 2 h, streptavidin-alkaline phosphate (ALP; 1:1,000) for 1 h, and 5-bromo-4-chloro-3-indolylphosphate/nitroblue tetrazolium (BCIP/NBT; Sigma) for 30 min at room temperature. The dried plates were analyzed using a Bio-Sys Bioreader 5000 Pro-S/BR177 and Bioreader software, generation 10.
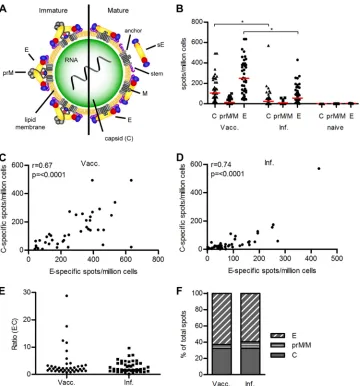
FIG 1CD4⫹T cell response to the TBE virus structural proteins C, prM/M, and E. (A) Schematic representation of a flavivirus particle, showing an immature and mature virion. The virion has three structural proteins: C (capsid), prM/M (membrane), and E (envelope). The capsid contains the positive-stranded RNA and several copies of the capsid protein C. Immature virions are covered with prM-E heterodimers. The proteolytic cleavage of prM leads to the reorganization of the E proteins and the formation of particles covered with E dimers. sE, soluble form of E lacking the membrane anchor and stem; M, membrane-anchored cleavage product of prM. (Adapted fromPLoS Pathogens[84].) (B) Magnitude of individual CD4⫹T cell responses to TBE virus C, prM/M, and E from 40 booster-vaccinated, 45 infected, and 5 TBE-naive individuals determined by IL-2 ELISpot assay. Statistical comparisons between the data from vaccinated and infected individuals were performed using a Kruskal-Wallis test (P⬍0.0001) and Dunn’s multiple comparison tests. Significant differences were observed for the responses to C and E (indicated by stars). Medians are indicated by red lines. (C and D) Spearman correlation of individual C- and E-protein-specific CD4⫹T cell responses of booster-vaccinated (Vacc) and infected (Inf) individuals. (E) E/C ratios of individual CD4⫹T cell responses. Values below the cutoff of 21 spots/106cells were set at 10 for this analysis. (F) Percentage of spots contributed by C, prM/M, and E peptides in vaccinated (n⫽40) and infected (n⫽45)
individuals.
Schwaiger et al.
on November 7, 2019 by guest
http://jvi.asm.org/
[image:3.585.113.473.64.450.2]Data were calculated as spots per 1⫻106CD8-depleted PBMCs after
subtraction of the negative control (mean number of spots from three to four unstimulated wells) as has been described for IL-2 ELISpot assays previously (26,27). A positive test result was defined as⬎20 spots per 1⫻ 106CD8-depleted PBMCs.
The response to a single peptide was defined as positive if test results after stimulation with the maxi- and minipools containing the peptide and the confirmatory single peptide testing revealed⬎20 spots per 1⫻ 106CD8-depleted PBMCs.
ELISA.TBE virus-specific IgG antibodies were analyzed by enzyme-linked immunosorbent assay (ELISA) using purified formalin-inactivated TBE virus strain Neudörfl as described previously (28). Serum or plasma samples were quantified in arbitrary units (AU) using a standard poly-clonal human anti-TBE virus serum set at 1,000 AU. ELISA values above 220 AU were considered positive. At least two independent experiments were performed for each sample to calculate mean concentrations.
Neutralization assay.Neutralization tests (NTs) were carried out in baby hamster kidney cells (ATCC BHK-21) as described previously (29). Serial dilutions of serum or plasma samples (in duplicates) were mixed with 25 PFU of TBE virus strain Neudörfl and incubated for 1 h at 37°C. Cells then were added, and incubation was continued for 3 days. The presence of virus in the supernatant was assessed by ELISA. The virus neutralization titer was defined as the reciprocal of the serum sample dilution that gave a 90% reduction in the absorbance readout in the assay compared to the control without antibody. At least two independent ex-periments were performed for each sample to calculate geometric mean titers.
Determination of molar ratios of structural proteins in virus parti-cles.To quantify the amounts of structural proteins in TBE virus particles, the membrane proteins E and prM/M were separated from the capsid by detergent solubilization and low-speed centrifugation as described previ-ously (30). For this purpose, mature TBE virus (strain Neudörfl) was grown in primary chicken embryo cells, concentrated by ultracentrifuga-tion, and purified by two cycles of sucrose density gradient centrifugation as described previously (31). The purified virus, at a final protein concen-tration of 100g/ml in TAN buffer (0.05 M triethanolamine, pH 8.0, 0.1 M NaCl), was mixed with-D-dodecylmaltoside (DDM; final
concentra-tion, 1%) and incubated for 1 h at room temperature. The aggregated capsid was separated from solubilized membrane proteins by centrifuga-tion at 14,600 rpm for 30 min at 4°C (Ti90 rotor; Beckman). The pellet was solubilized by incubation in TAN buffer containing 0.2% SDS for 30 min at 65°C. The purity of the capsid and membrane protein fractions was controlled by SDS-PAGE according to Laemmli (32), and the amount of protein in each fraction (E and prM/M in the supernatant; aggregated capsid in the pellet) was determined as described by Schaffner and Weiss-mann (33). In this procedure, proteins are precipitated by trichloroacetic acid, vacuum blotted onto a nitrocellulose membrane, stained with amido black, eluted with ethanol, and quantified colorimetrically. Protein con-centrations were determined using bovine serum albumin as a standard.
Structural analysis.For analysis of the C protein, the crystallographic structure of the flavivirus KUN C protein (24) was used as no crystallo-graphic data exist for the TBE virus C protein. To label identified TBE virus C clusters in the KUN C structure, the amino acid sequences of TBE C (strain Neudörfl; NCBI GI 27596775) and KUN C (strain MRM61C; Swiss-Prot/GenBank accession numberP14335) were aligned.
For structural analysis of the stem-anchor region of the E protein, the cryo-electron microscopy structure of the flavivirus DEN E protein (34) was used, as no crystallographic data exist for the TBE virus E stem-anchor region. To label the identified TBE virus E stem cluster in the DEN virus E structure, the amino acid sequences of TBE virus E (strain Neudörfl; NCBI GI 27596778) and DEN-2 virus E (strain Thailand/16681/1984; Swiss-Prot/GenBank accession numberP29990) were aligned.
Alignment was done using Geneious Pro, version 5.0.4 (Geneious alignment, BLOSUM62; gap open penalty, 12; gap extension penalty, 3; global alignment [Needleman-Wunsch]).
HLA typing.HLA typing was performed by nucleotide sequencing of exon 2 of HLA-DRB1, -DRB3/4/5, and -DQB1 genes and exons 2 and 3 of HLA-DPB1 genes (35,36). Briefly, the amplification products were puri-fied by polyethylene glycol (PEG) precipitation and directly sequenced by cycle sequencing with Big Dye Terminator chemistry on an ABI 3100 capillary sequencing device. The sequences were analyzed using GenDX SBT Engine software (GenDX, Utrecht, The Netherlands) and compared to the ImMunoGeneTics (IMGT)/HLA database, and the types were as-signed accordingly.
Computer prediction.The MHC-II binding predictions were made in November 2012 using the Immune Epitope Database (IEDB) analysis tool “IEDB recommended” (www.iedb.org) (37,38). Query submission was automated using the framework provided by the PeptX project (39). Pep-tides with an IEDB percentile rank score of 5 or lower were used for further analysis.
The amino acid sequences of the TBE virus proteins C, prM/M, and E (strain Neudörfl; NCBI GI 27596775, GI 27596776, and GI 27596778) were entered separately, and predictions were done for all peptides used for experimental testing and the experimentally determined HLA class II alleles offered by IEDB from all individuals (see Tables S1 and S2 in the supplemental material).
Prediction of CD4⫹T cell epitopes and labeling of the transmembrane (TM) domains was done for the following proteins: YF virus prM/M and E (GenBankU17066) and TM label (Swiss-Prot/GenBankP03314); DEN virus prM/M and E (GenBankP29990); severe acute respiratory syn-drome (SARS)-coronavirus spike 2, E, and M (GenBankAAP41036.1) and TM label (Swiss-Prot/GenBankP59594,P59637, andP59596); influ-enza virus hemagglutinin 2 (HA2) (as published in reference40), starting with amino acid position 328, and TM label (Swiss-Prot/GenBank
P03437); herpes simplex virus 1 (HSV-1) B protein (Swiss-Prot P10211); vaccinia virus (VACV) extracellular enveloped virion (EV) A33R and B5R (Swiss-Prot/GenBankP68616andP21115); HBV surface antigen (HB-sAg) (Swiss-Prot/GenBankP31873); and HIV gp160 (Swiss-Prot/Gen-BankP04578). For these predictions, 14 human HLA class II alleles com-mon in middle Europe (DRB1*01:01, 03:01, 07:01, 11:01, 13:01, and 15: 01; DPB*02:01, 04:01, and 04:02; DQB*02:01, 03:01, 03:02, 05:01, and 06:02) were used.
Hydrophobicity of peptides.The percentage of hydrophobic amino acids in selected TBE virus peptides was calculated using the web-based Peptide Property Calculator from GenScript (https://www.genscript.com /ssl-bin/site2/peptide_calculation.cgi) and the respective peptide se-quence.
Statistical analysis.Statistical tests were performed with GraphPad Prism, version 5.
A nonparametric Kruskal-Wallis test was used to perform compari-sons of overall CD4⫹T cell reactivity for the C, prM/M, and E proteins in groups of vaccinated and infected subjects.
A Wilcoxon signed-rank test was used to compare the numbers of single peptides that induced a CD4⫹T cell response.
For identification of the peptides that most frequently induced CD4⫹ T cell responses, a Fisher’s exact or chi-square test was used.
Two-by-two correlations were evaluated using a Spearman correla-tion coefficient.
RESULTS
Testing of peptide pools.
We first determined the overall extent of
CD4
⫹T cell responses of 40 TBE-vaccinated, 45 TBE
virus-in-fected, and 5 TBE-naive individuals in an IL-2 ELISpot assay using
three peptide pools comprised of overlapping 15-mer peptides
that covered the entire sequence of each of the TBE virus
struc-tural proteins C, prM/M, and E.
The rationale for using an IL-2 ELISpot assay was based on
previous studies which showed that CD4
⫹T cells producing IL-2
but not those producing other cytokines (gamma interferon
[IFN-
␥
] and tumor necrosis factor alpha [TNF-
␣
]) correlate with
on November 7, 2019 by guest
http://jvi.asm.org/
antibody titers (
41
,
42
) and on initial experiments which indicated
that IL-2 and IFN-
␥
ELISpot assays detected similar magnitudes
of TBE virus-specific CD4
⫹T cell responses in both vaccinated
and infected individuals (data not shown).
The results displayed in
Fig. 1B
reveal significantly higher C
and E peptide responses in vaccinated than in infected individuals
(Kruskal-Wallis test,
P
⬍
0.0001), and an extensive degree of
in-dividual variation was observed in both groups (e.g., E-specific
spots ranging from 39 to 633 per 10
6cells after vaccination and
⬍
20 to 430 per 10
6cells after natural infection). For prM/M
pep-tides, the overall reactivities were very low and not significantly
different between the two groups. TBE-naive individuals (
n
⫽
5)
showed no response to any of the tested peptide pools, confirming
the specificity of the analysis. Although the magnitudes of the
responses to the E and C peptide pools correlated significantly in
both vaccinated and infected humans (
Fig. 1C
and
D
),
consider-able individual variation of the ratios of E- and C-specific spots
was observed, ranging from 0.6 to 30 in vaccinated and 0.1 to 10 in
infected individuals (coefficients of variation, 140% for
vacci-nated and 71% for infected humans) (
Fig. 1E
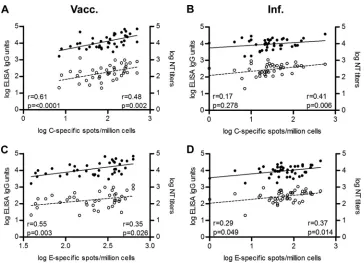
). We also quantified
TBE virus-specific antibodies in the blood samples used for
cellu-lar analyses and found a positive correlation between the IL-2
ELISpot data and ELISA concentrations as well as NT titers in both
vaccinated and infected individuals (
Fig. 2
).
An analysis of the contribution of peptides from the three
structural proteins to the total response is displayed in
Fig. 1F
.
Assuming that all three proteins have similar propensities to
in-duce CD4
⫹T cell responses, peptides of the C protein are 2- to
3-fold overrepresented (
⬃
32% of total response), considering its
molecular mass of only 10.6 kDa (
⬃
15% of total molecular mass
in immature and
⬃
13% in mature virus particles). This suggested
that peptides from the C protein are either specifically favored
during CD4
⫹T cell stimulation or that they are overrepresented
in the virus particle relative to the envelope proteins. Since
pub-lished data on the contents of C in flavivirus virions do not yet
exist, we determined the molar ratios of C relative to the envelope
proteins (E and prM/M) in purified virus particles. For this
pur-pose, we analyzed the protein contents in capsid and envelope
protein fractions separated after detergent solubilization (see
Ma-terials and Methods) and compared the ratios obtained with the
molecular weight ratios of these proteins (
Table 1
). Since the
SDS-PAGE analysis revealed some uncleaved prM protein in the virus
preparation (
Fig. 3
), we performed the calculation for both
com-pletely mature (containing only M) and comcom-pletely immature
(containing only prM) virions. As can be seen from
Table 1
, the
experimentally determined C-to-envelope protein ratios were at
[image:5.585.111.475.63.326.2]FIG 2Correlation of CD4⫹T cell and antibody responses. The magnitude of individual CD4⫹T cell responses to TBE virus C (A and B) and E (C and D) peptide maxipools was plotted against the corresponding ELISA units (solid dots) and NT titers (empty circles) in vaccinated (A and C) and infected (B and D) individuals. Correlations were calculated using a Spearman correlation coefficient. Linear regressions are indicated by solid (ELISA) or dashed (NT) lines.
TABLE 1Protein determinations of separated capsid and envelope protein fractions and calculation of molar ratios in the virion
Expt. no.
Ratio of protein content by fraction
Molar excess of C relative to: Based on exptl data Based on MWa
C (g) Env (g)b C to Env
C to E⫹M
C to
E⫹prM E⫹Mc E⫹prMd
1 79.6 138.0 0.58 0.17 0.15 3.4 3.9
2 69.6 154.0 0.45 0.17 0.15 2.6 3.0
3 62.0 124.0 0.50 0.17 0.15 2.9 3.3
aMolecular weight (MW) values are as follows: C, 10,600; E, 53,500; M, 8,300; prM,
18,500.
bEnv, envelope proteins (E⫹prM/M). c
Assuming that all particles are mature.
dAssuming that all particles are immature.
Schwaiger et al.
on November 7, 2019 by guest
http://jvi.asm.org/
[image:5.585.299.542.592.680.2]least 3-fold higher than the ratios of the molecular weights,
indi-cating at least a 3-fold molar excess of C relative to the envelope
proteins in virions, which is in agreement with the ELISpot data.
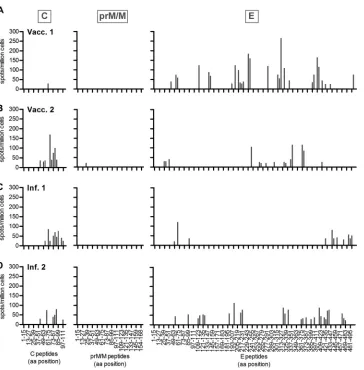
Single-peptide testing.
To obtain information on the epitope
specificity and diversity of CD4
⫹T cell responses, we performed
ELISpot analyses of TBE-vaccinated and -infected individuals
with peptide minipools and single peptides covering the entire C,
prM/M, and E polypeptides. As expected, the responses were
re-stricted to a limited set of peptides, and a high degree of individual
variation was observed with respect to the distribution of peptide
responses in both study groups. Representative examples of two
vaccinated and two infected individuals are shown in
Fig. 4
. Due
to individual-specific variation of CD4
⫹T cell responses, patterns
of immunodominance and possible differences between
vacci-nated and infected humans can become apparent only from
cumulative data. We therefore calculated the frequency of
ob-taining a positive ELISpot assay result for each peptide using
the results from all vaccinated and infected individuals
ob-tained from the single-peptide testing. This frequency is
dis-played in
Fig. 5A
(vaccinated individuals) and
Fig. 5B
(pa-tients) as the percentage of responders out of all individuals
reacting with at least one peptide of a given protein. Consistent
with the low response to the prM/M peptide pool (
Fig. 1B
),
FIG 3SDS-PAGE of TBE virus as well as its envelope proteins and capsid fractions after solubilization with DDM. The soluble fraction (containing the membrane-associated proteins E and prM/M) and aggregated fraction (con-taining protein C) were separated by low-speed centrifugation. Identical ali-quots of the supernatant (SN) and the pellet (P) were analyzed by SDS-PAGE and stained with Coomassie blue. V, untreated virus control. The positions of E, prM, C, and M are indicated.
FIG 4Individual variation of CD4⫹T cell responses. CD4⫹T cell responses against TBE C, prM/M, and E single peptides were measured using an IL-2 ELISpot assay. Examples of two vaccinated (A and B) and two infected (C and D) individuals are shown.
on November 7, 2019 by guest
http://jvi.asm.org/
[image:6.585.92.236.64.201.2] [image:6.585.115.479.334.704.2]FIG 5Mapping of immunodominant experimental and predicted CD4⫹T cell responses. (A and B) Percentage of positively tested vaccinated (A) and infected (B) individuals recognizing a specific single peptide within the C (n⫽31 vaccinated;n⫽13 infected) and E (n⫽34 vaccinated;n⫽26 infected) proteins. prM/M-specific single-peptide responses were too low for evaluation. Peptides recognized significantly more often than the average were identified (Fisher’s exact or chi-square test; significance level ofP⬍0.05, separately for each protein and each group) and are indicated by asterisks. Clusters of these peptides are
Schwaiger et al.
on November 7, 2019 by guest
http://jvi.asm.org/
[image:7.585.84.498.66.683.2]single peptides yielded only a few positive signals, and as such a
meaningful analysis was not possible.
As can be seen in
Fig. 5
, the cumulative analysis showed specific
regions of peptides that were positive in significantly more
indi-viduals (as assessed by chi-square or Fisher’s exact test) than the
average of all peptides (labeled 1 and 2 for protein C and 1 to 9 for
protein E) and thus dominated the CD4
⫹T cell response. The
same peptides also induced the highest numbers of spots in the
ELISpot assays, and evaluations based on the magnitude of
the responses yielded similar patterns (data not shown). Although
some of these clusters were similar in vaccinated and infected
individuals, specific differences also became apparent in some
in-stances (see below). Since structural aspects of the proteins can
potentially influence the patterns of CD4
⫹T cell responses (
43–
47
), we determined the location of the dominant peptides in the
three-dimensional (3D) structures of C and E (
Fig. 5C
). In the
following paragraphs we describe this structure-related analysis of
immunodominance and emphasize the similarities and
differ-ences observed between the two groups.
(i) C protein.
Two peptide clusters dominated the total CD4
⫹T cell response. C peptides of cluster 2 were recognized by up to
74% of vaccinated and 55% of infected responders. Structurally,
these peptides corresponded to helix 2 and helix 4 of the protein
(
Fig. 5C
), whereas peptides of helices 1 and 3 had much lower
representation, with those for the N-terminal 20 amino acids
al-most completely absent.
(ii) E protein.
For E protein, the response was less focused than
for C, and in the vaccinated group only a single peptide (in cluster
7) was positive in 50% of responders (
Fig. 5A
). Nevertheless,
dis-tinct patterns of dominance were discernible. In both vaccinated
and infected individuals, peptides of domain III (DIII) were
over-represented and yielded three distinct peaks, labeled 6, 7, and 8 in
Fig. 5
. In vaccinated individuals, further clusters were found in the
two other domains (
Fig. 5A
, peaks 1 to 5) although these were not
significantly overrepresented in patients (
Fig. 5B
). On the other
hand, patients displayed a dominant reactivity peak with peptides
forming a helix in the so-called stem region of E (
Fig. 5B
, peak 9)
that was absent in vaccinated individuals.
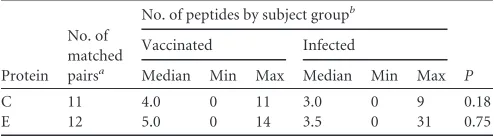
Since primary infection has been proposed to be associated
with a more diverse CD4
⫹T cell response than immunization
with exogenous nonreplicating antigens (
12
), we made
compara-tive analyses of the breadth of C- and E-specific responses in our
groups of vaccinated and infected individuals. For this purpose we
selected pairs of individuals from both groups that had similar
extents of reactivities with the respective peptide pools (
Fig. 1
) to
avoid misinterpretations due to differences in response
magni-tude. The comparison of the numbers of peptides recognized by
these individuals (
Table 2
) revealed no significant difference
be-tween natural infection and vaccination (Wilcoxon signed-rank
test).
Comparison with epitope predictions.
For epitope prediction
based on peptide–MHC-II binding affinity, we used the IEDB
database, which is the most comprehensive for human HLA class
II alleles and which allowed predictions for all MHC-II DRB1
alleles, all but one of the DRB3/4/5 alleles, and about two-thirds of
the DP and DQ alleles in our study participants. As a prerequisite
for these analyses we first determined the HLA class II type of all
individuals (see Tables S1 and S2 in the supplemental material).
For each of the different alleles and peptides tested experimentally,
the prediction program provided a percentile rank as a measure of
their propensity to be a CD4
⫹T cell epitope. In order to compare
these predictions with our experimental data, we selected the
pep-tides with the best prediction values (IEDB percentile rank score
of 5 or lower) and summed these data for all individuals in both
groups. The results displayed in
Fig. 5D
and
E
show the
distribu-tion of these predicted CD4
⫹T cell epitopes in the sequences of C,
prM/M, and E for the specific MHC-II alleles present in the two
study groups.
The epitope predictions for the two groups were almost
iden-tical (compare
Fig. 5D
and
E
), indicating that HLA class II allele
distributions were similar among the groups of vaccinated and
infected individuals. For the C protein, an excellent match with
the experimental data was obtained. The program most frequently
predicted the same set of peptides derived from helices 2 and 4 of
C. In E, a relatively good agreement/match was observed for the
weakly dominant peaks 1 and 5 of domains I and II, as well as
peptide peak 9 in the stem, whereas other experimentally
domi-nant reactivities of peptides of DI and DII and those of DIII were
not predicted to similar extents (
Fig. 5D
). Most importantly, the
peptide yielding the highest percentage of responders in both
vac-cinated and infected individuals (in cluster 7, encompassing
amino acids 329 to 343) was not within the top binders in the
prediction. On the other hand, several frequently predicted
epitopes did not have dominant counterparts in the experimental
data.
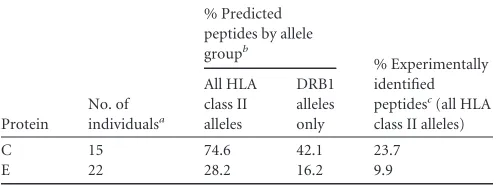
Quantification of epitope predictability.
To obtain a
quanti-tative measure of the congruence between epitope prediction and
experimental data in our study system, we determined the
follow-ing for C and E and every individual: (i) the percentage of
[image:8.585.298.545.87.155.2]exper-numbered 1 to 9. (C) Crystallographic structure of the flavivirus Kunjin C protein (24) consisting of four helices (H1 to H4; left panel). For the N-terminal region (gray line), no crystallographic data exist. Crystallographic structure of the TBE virus soluble E (23) consisting of three domains (DI, DII, and DIII; right panel). Recent data suggest that the stem-anchor region consists of three alpha-helices in the stem and two alpha-helices in the transmembrane (TM) anchor (34) (boxes). Dominant clusters labeled in panels A and B are colored as follows: C, green; E DI, red; E DII, yellow; E DIII, blue; E stem, magenta. N- and C-terminal residues are indicated. (D and E) Cumulative computer prediction of CD4⫹T cell epitopes for HLA class II alleles from vaccinated (n⫽39 subjects; number of predicted alleles, 233) (D) and infected (n⫽44 subjects; number of predicted alleles,⫽264) (E) individuals. The percentage of alleles predicting a specific single peptide is shown for peptides of all three structural proteins (C, prM/M, and E). In panels A, B, D, and E, lines below thexaxes indicate the TM anchor domain of prM/M (black) and the domains of the E protein (DI, red; DII, yellow; DIII, blue; stem, magenta; TM, black).
TABLE 2Number of C or E peptides recognized by matched pairs of vaccinated and infected individuals
Protein No. of matched pairsa
No. of peptides by subject groupb
P
Vaccinated Infected
Median Min Max Median Min Max
C 11 4.0 0 11 3.0 0 9 0.18
E 12 5.0 0 14 3.5 0 31 0.75
aThe magnitude of response to maxipools (ⱖ50 spots/106cells) was comparable
between the pairs of vaccinated and infected individuals included in this analysis.
bMin, minimum; max, maximum.
on November 7, 2019 by guest
http://jvi.asm.org/
imentally identified peptides that were also positive in the
predic-tion and (ii) the percentage of predicted peptides that were also
identified experimentally. The prerequisite for inclusion in this
analysis was the availability of prediction algorithms for all HLA
class II alleles identified in these individuals (see Tables S1 and S2
in the supplemental material). The results of these comparisons
are shown in
Table 3
. For C protein peptides, the epitope
predic-tions yielded an excellent match with the experimental data (ca.
75%), which was substantially lower for E (ca. 28%). Since in
many publications only DRB1 alleles were used as a basis for
epitope predictions (
48–53
), we also made a comparative
calcula-tion using DRB1 alleles only. As shown in
Table 3
, the congruence
of epitope prediction dropped from 75% to 42% for C peptides
and from 28% to 16% for E peptides. Of all predicted epitopes,
only 24% and 10% were also experimentally identified for C and
E, respectively (
Table 3
).
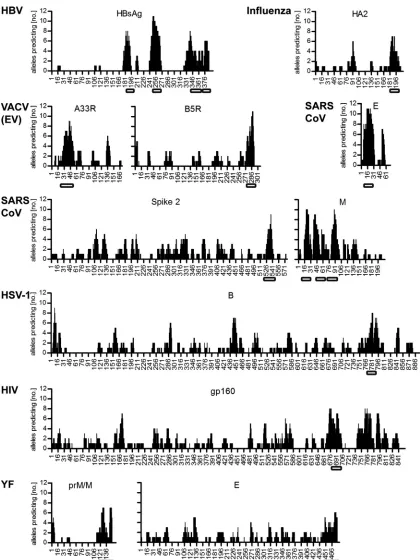
Transmembrane domains.
A striking feature of the predicted
patterns was the dominance of peptides from the C terminus of
the membrane proteins prM/M and E (
Fig. 5
), which did not have
a counterpart in the experimental data. In both proteins, these
sequences constitute a double membrane-spanning element (
Fig.
5
, labeled TM) that is derived from the specific mode of flavivirus
polyprotein processing and anchors these proteins first in the
en-doplasmic reticulum membrane and then in the viral membrane
(
54
). To analyze whether predicted immunodominance is a
gen-eral feature of viral transmembrane (TM) protein domains, we
performed CD4
⫹T cell epitope predictions for envelope proteins
of viruses for which experimental data (including those for TM
domain-derived peptides) were available. This included envelope
proteins of HBV (
50
,
55–58
), influenza virus (
40
,
59
,
60
),
VACV-EV (
61
,
62
), SARS-coronavirus (
63
,
64
), HSV-1 (
65
), and
HIV (
66
) as well as YF (
67
) and DEN (
68
) viruses. For each of these
viruses the TM domain-derived peptides (both at the C terminus
as in type I and at the N terminus as in type II membrane proteins)
were among those with the highest prediction frequency (
Fig. 6
).
However, in none of these cases was a dominant CD4
⫹T cell
response to such peptides found experimentally, with a single
ex-ception: one of the four TM domains (proximal to the N terminus,
amino acids 182 to 202) (
Fig. 6
) of hepatitis B virus surface antigen
(HBsAg) contained CD4
⫹T cell epitopes that were described to be
immunodominant in humans (
50
,
55–58
). In conclusion, the high
predictive values for CD4
⫹T cell epitopes in the TM domains of
viral envelope proteins is not confirmed by experimental data in
most instances.
DISCUSSION
In our study we exploited the opportunity to compare the
speci-ficities of CD4
⫹T cell responses after vaccination with an
alumi-num hydroxide-adjuvanted formalin-inactivated flavivirus
vac-cine to those after natural infection in two groups of individuals
with very similar HLA class II allele distributions. Since direct or
indirect information on the 3D structures of the viral structural
proteins is available, we were able to correlate immunodominance
patterns with structural characteristics of the antigens and to
as-sess the congruence of
in silico
epitope predictions on the basis of
specific features of individual proteins.
An important finding of our work is that the overall
propor-tions of reactivities with peptide pools from the three proteins
were similar in vaccinated and infected individuals (
Fig. 1F
)
al-though virus replication in infected individuals could
theoreti-cally affect protein abundance and relative proportions of the
three proteins in the host. In both groups, the response to the C
protein was strongly overrepresented relative to its molecular
weight, which was apparently due to a previously unrecognized
3-fold molar excess of C over prM/M and E in virus particles. The
extents of experimentally determined reactivities to peptides from
C, prM/M, and E were therefore completely concordant with the
amounts and sizes of these proteins in virions, suggesting that the
intrinsic propensities to induce a CD4
⫹T cell response were
sim-ilar for all three proteins.
The strong CD4
⫹T cell response to C should also be seen in the
light of its potential helper function in the production of
neutral-izing antibodies directed toward E. As shown for HBV and
influ-enza virus, B cells expressing envelope protein-specific antibodies
can internalize whole-virus particles and present peptides of
in-ternal proteins together with MHC-II at their plasma membranes.
As a consequence, CD4
⫹T cells specific for internal proteins can
provide help in the production of envelope protein-specific
neu-tralizing antibodies (
14–18
). Consistent with this scenario, we
found a significant correlation between the magnitudes of the
C-specific CD4
⫹T cell and neutralizing antibody responses (
Fig. 2
).
In the course of flavivirus infections (in contrast to vaccination
with inactivated vaccines) capsidless virus-like particles
contain-ing only prM/M and E can also be secreted (
54
). This could
theo-retically lead to a stronger envelope protein-specific CD4
⫹T cell
response in TBE patients than in vaccinees. However, the overall
reactivities with all three structural proteins were similar in
vacci-nated and infected individuals (
Fig. 1F
), suggesting that in both
instances the whole virus particle is the principal source of
pep-tides for MHC class II presentation. Surprisingly, the magnitude
of the TBE virus-specific CD4
⫹T cell responses to C and E were
significantly lower after infection than after vaccination (
Fig. 1B
).
This can be due to viral antagonism of the host immune response
during infection (
69
), an enhanced T cell response after booster
vaccination, and/or aluminum hydroxide-related effects (
70
,
71
).
Theoretically the reactivity pattern after infection could be less
focused than that elicited in response to exogenous protein
anti-gens because viral protein synthesis may override the DM editing
and peptide selection machinery in infected APCs (
12
). However,
we found no evidence for an increased breadth of CD4
⫹T cell
responses after infection compared to results after vaccination
although there is evidence that TBE virus replicates in dendritic
cells (
72
). In a comparison of the number of peptides recognized
by vaccinated and infected individuals that had about equal
over-TABLE 3Quantification of epitope predictability
Protein
No. of individualsa
% Predicted peptides by allele groupb
% Experimentally identified peptidesc(all HLA class II alleles) All HLA class II alleles DRB1 alleles only
C 15 74.6 42.1 23.7
E 22 28.2 16.2 9.9
aOnly individuals for whom predictions could be performed for all HLA class II alleles
were included.
bPercentage of experimentally identified peptides that were also positive in the
prediction. Values are means.
cPercentage of predicted peptides that were also identified experimentally. Values are
means.
Schwaiger et al.
on November 7, 2019 by guest
http://jvi.asm.org/
[image:9.585.40.288.78.171.2]all CD4
⫹T cell responses (
Table 2
), there was no statistically
sig-nificant difference between the two groups, indicating that, in this
specific case, infection does not lead to a broadening of the CD4
⫹T cell response.
Despite the strong variability of individual peptide specificities,
characteristic patterns of immunodominance were observed at
the population level, with both similarities and distinct differences
between vaccinated and infected individuals (
Fig. 5A
and
B
).
Eval-FIG 6Computer prediction of potential CD4⫹T cell epitopes from envelope proteins of different viruses. CD4⫹T cell epitopes for surface proteins of hepatitis B virus (HBV), influenza virus, vaccinia virus (VACV) (extracellular envelope virion [EV]), SARS-coronavirus (SARS-CoV), herpes simplex virus 1 (HSV-1), HIV, and yellow fever (YF) virus were predicted using common human HLA class II alleles. Positions of transmembrane domains within the respective amino acid sequences are indicated by open rectangles. The prediction patterns were very similar for YF virus and dengue virus, and the latter was therefore not included in the figure.
on November 7, 2019 by guest
http://jvi.asm.org/
[image:10.585.81.501.62.622.2]uations based on either the percentage of positive responders or
the magnitude of response to individual peptides yielded similar
patterns. The response to single peptides of the membrane protein
prM/M was very low (as was the case for DEN and YF viruses [
67
,
68
]) and did not allow a meaningful interpretation. Therefore, our
discussion of aspects of fine specificity is restricted to C and E. For
both proteins, distinct epitope clusters were identified that, at least
in some instances, were clearly linked to specific protein regions.
This was most apparent for peptides derived from helices 2 and 4
of the C protein, which dominated the response in both
vacci-nated and infected individuals, whereas peptides from helices 1
and 3 were underrepresented (
Fig. 5A
,
B
, and
C
, left panel). Most
strikingly, the N-terminal part of C (not resolved in the structure
determined for KUN virus and not predicted to have a helical
secondary structure) did not elicit any CD4
⫹T cell response.
The CD4
⫹T cell response to E was less focused than that to C,
but distinct preferences for specific sequence elements were also
observed in this case, especially with respect to DIII. Peptides of
this domain were clearly overrepresented in the reactivity patterns
of both vaccinated and infected individuals (
Fig. 5A
and
B
), and
three hot spots (
Fig. 5
, peaks 6, 7, and 8) could be discerned.
Structurally, these epitopes include

-sheets as well as loops
ex-tending from the lateral upper part of the domain (
23
) (
Fig. 5C
).
These loops protrude from the surface of the virion and have been
shown for different flaviviruses to be targets of strongly
neutraliz-ing antibodies in mice (
1
). Our findings are consistent with
pre-vious reports describing clusters of immunodominant epitopes in
limited protein regions, often at exposed sites of the proteins (
45
,
46
). A further structural link for immunodominance was
pro-vided by Landry in studies with influenza virus HA, in which
dom-inant epitopes were found at the C-terminal flanks of
conforma-tionally stable protein segments (
43
).
Despite the concordance of certain immunodominance
pat-terns between vaccinated and infected individuals, characteristic
differences were found, especially with respect to certain regions
in E. Specifically, none of the peptides in domains I and II
(desig-nated 1 to 5 in
Fig. 5A
and highlighted in
Fig. 5C
, right panels) that
were classified as dominant in vaccinated humans reached this
criterion in patients. Conversely, the two peptides designated 9 in
Fig. 5B
were dominant in infected but not vaccinated individuals.
These peptides are located in the so-called stem region of E which,
as resolved by cryo-electron microscopy of DEN virus particles,
consists of three alpha helices that are located beneath the E
pro-tein shell and interact with the viral membrane (
Fig. 1A
) (
34
).
Since the distributions of MHC-II alleles in the two groups were
very similar (as was also reflected in the identical patterns of
pre-dicted epitopes), it is unlikely that the differences between
vacci-nated and infected individuals resulted from HLA class II
hetero-geneity. Instead, they more likely reflect an influence of the
different routes of antigen presentation in the two groups and/or
antigen modifications in the preparation of the vaccine. There is
evidence from studies with influenza virus (
73
) that some peptides
are generated only in the course of infection and protein synthesis
in infected cells but not upon exogenous antigen uptake. On the
other hand, virus treatment with formalin (as is used for preparing
the TBE vaccine) results in protein cross-linking (
74
,
75
) and can
potentially affect antigen processing, the interaction of peptides
with MHC-II, DM editing, and TCR recognition. Specifically, the
cross-linking of E protein in the viral envelope is likely to prevent
its conversion into the trimeric postfusion structure (
76
,
77
) in the
acidic endolysosomal compartment of the APCs, resulting in a
different structural substrate for proteolytic processing.
Differ-ences in immunodominance patterns between vaccinated and
in-fected individuals may also be due to the adjuvant (aluminum
hydroxide) contained in the vaccine, which can modulate antigen
processing and the TCR-based selection of CD4
⫹T cell clones
(
13
). In this context it should also be considered that antigen
processing and presentation can be influenced by antibodies
bound to the antigen (
78
,
79
) which, in the case of virion-antibody
complexes, would be expected to modulate the CD4
⫹T cell
re-sponse to peptides from the antibody-accessible E protein but not
from the internally located C protein.
The comparison between experimentally determined and
pre-dicted epitopes yielded the major finding that the congruencies
varied strongly between proteins and specific structures within
these proteins. With the C protein, an excellent match was
achieved (75% of experimentally determined epitopes were also
predicted), and the patterns of immunodominance were virtually
superimposable. In contrast, predictions for E were much less
sat-isfactory, and about 70% of experimentally identified peptides did
not have an IEDB percentile rank score of 5 or lower. Most
im-portantly, the dominance of DIII-derived peptides observed after
both vaccination and natural infection was not apparent in the
prediction, suggesting the importance of protein-specific and
pro-tein domain-specific factors that can affect the match between
epitope prediction and experimental data.
[image:11.585.297.545.87.313.2]The comparative analysis of experimental and predicted data
also revealed that their congruence was significantly lower when
data were based on DRB1 alleles only. In this case, only 42% and
16% of experimentally determined C and E peptides, respectively,
would have been predicted (
Table 3
). Considering these data, the
common practice of using DRB1-based epitope predictions
be-fore the synthesis of peptides for experimental analyses may be
problematic because a number of CD4
⫹T cell specificities that
actually contribute to immune responses could be missed.
TABLE 4Hydrophobicity of peptides from the TBE E TM domain and C peptides with similar hydrophobicity levels
Protein and peptide position
(aa) Peptide sequence
% Hydrophobic amino acids within the peptide
Vaccinated responders (%)a
E
441–455 LGGAFNSIFGGVGFL 53 0.0
445–459 FNSIFGGVGFLPKLL 60 8.8
449–463 FGGVGFLPKLLLGVA 67 14.7
453–467 GFLPKLLLGVALAWL 80 11.8
457–471 KLLLGVALAWLGLNM 73 0.0
461–475 GVALAWLGLNMRNPT 60 2.9
465–479 AWLGLNMRNPTMSMS 53 0.0
469–483 LNMRNPTMSMSFLLA 60 5.9
473–487 NPTMSMSFLLAGGLV 60 8.8
477–491 SMSFLLAGGLVLAMT 67 8.8
481–495 LLAGGLVLAMTLGVG 67 0.0
C
29–43 PRVQMPNGLVLMRMM 67 9.7
33–47 MPNGLVLMRMMGILW 73 12.9
37–51 LVLMRMMGILWHAVA 80 48.4
41–55 RMMGILWHAVAGTAR 60 64.5
aPercentage of vaccinated responders recognizing the peptide.
Schwaiger et al.
on November 7, 2019 by guest
http://jvi.asm.org/
A very high risk of yielding strongly predicted epitopes that do
not contribute to CD4
⫹T cell responses became apparent for the
transmembrane domains of envelope proteins. The peptides
de-rived from this region are relatively hydrophobic (containing up
to 80% hydrophobic amino acids) (
Table 4
), which could bias
their performance in the ELISpot assays. However, some of the
most immunodominant peptides from the C protein are similarly
hydrophobic (
Table 4
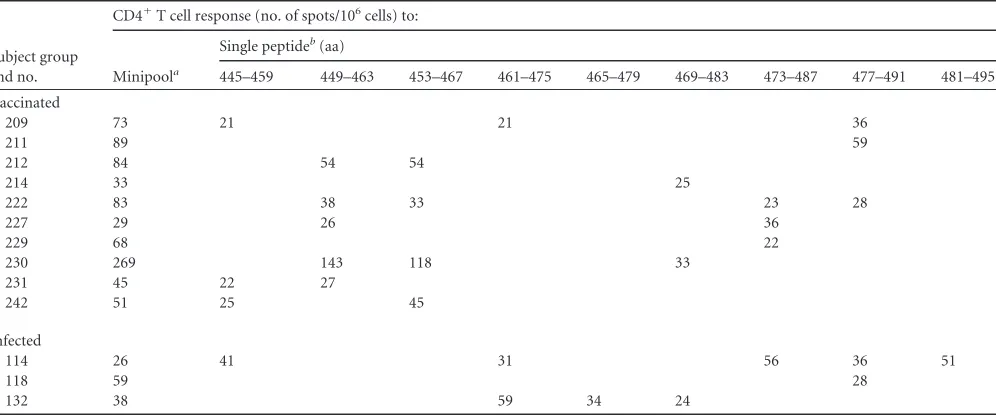
), and although this region was clearly
un-derrepresented at the population level, some individuals did
in-deed have robust reactivities with peptides derived from the
stem-anchor region of E (in both peptide pool and single-peptide
analyses) (
Table 5
). Similarly, in a mouse immunization study
with WN virus DNA and virus-like particle vaccines, a peptide of
the WN virus E protein TM domain was found to elicit a strong
CD4
⫹T cell response. The same peptide also enhanced the
pro-tective activity of a DEN virus vaccine (
80
). It thus appears that the
(mostly) negative results obtained with TM peptides are unbiased
and reflect an impairment of processing, presentation, and/or
TCR recognition that is not taken into account by T cell epitope
prediction algorithms (
19
). Such a conclusion is corroborated by
the fact that in an analysis of a large set of viral glycoproteins from
different virus families (
Fig. 6
), peptides of the TM domain were
among the most frequently predicted, but when they were
ana-lyzed experimentally, they failed to be associated with a similar
dominance (
40
,
59–67
). There was a single exception, the
N-ter-minal TM domain of HBsAg, which is described as being
immu-nodominant in humans (
50
,
55–58
). At least in the context of
full-length HBsAg, however, this sequence element has been
de-scribed to lie outside the membrane (
81
,
82
) and therefore may
have characteristics that differ from conventional TM domains.
Since the IEDB T cell epitope prediction algorithms predict
MHC-II–peptide binding affinities only (
37
,
38
) (with an excellent
match to experimentally determined affinities) (
83
), the
discrep-ancies observed with peptides of the TM domains are likely to be
associated with a suboptimal generation of such peptides through
the antigen-processing machinery. This could be due to their
shielding in lipid membranes or other structural features that
af-fect proteolytic processing. Alternatively, some peptides could be
more homologous to native human proteins than other regions of
the viral proteins, and T cells specific for such sequences may have
been deleted from the circulating repertoire. Since the IEDB
algo-rithms consider only MHC-II–peptide binding, they do not
ac-count for holes in the CD4
⫹T cell repertoire due to central/
peripheral tolerance. Additional research is thus required to
iden-tify influences of protein structure on immunodominance
pat-terns of CD4
⫹T cell responses that may ultimately allow further
improvements in CD4
⫹T cell epitope predictions.
ACKNOWLEDGMENTS
We thank Gabriela Perstinger, Ursula Sinzinger, Jutta Hutecek, Cornelia Stöckl, and Walter Holzer for excellent technical assistance.
This work was supported by the Austrian Science Fund FWF (project APW01212FW, to F.X.H.) and the Medical University of Vienna, the Austrian Science Fund FWF (project FWF-P22258-B12, to B.K.), and the EPSRC Cross-Discipline Interface Programme (2020 Science Pro-gramme, number EP/I017909/1, to B.K.).
REFERENCES
1.Pierson TC, Diamond MS.2013. Flaviviruses, p 747–794.InKnipe DM, Howley PM, Cohen JI, Griffin DE, Lamb RA, Martin MA, Rancaniello VR, Roizman B (ed), Fields virology, 6th ed, vol 2. Lippincott Williams & Wilkins, Philadelphia, PA.
2.Pierson TC, Diamond MS.2008. Molecular mechanisms of antibody-mediated neutralisation of flavivirus infection. Expert Rev. Mol. Med.
10:e12.http://dx.doi.org/10.1017/S1462399408000665.
3.Pierson TC, Fremont DH, Kuhn RJ, Diamond MS. 2008. Structural insights into the mechanisms of antibody-mediated neutralization of fla-vivirus infection: implications for vaccine development. Cell Host Mi-crobe4:229 –238.http://dx.doi.org/10.1016/j.chom.2008.08.004. 4.Swain SL, McKinstry KK, Strutt TM.2012. Expanding roles for CD4⫹T
cells in immunity to viruses. Nat. Rev. Immunol.12:136 –148.http://dx .doi.org/10.1038/nri3152.
[image:12.585.46.544.77.286.2]5.Sant AJ, McMichael A.2012. Revealing the role of CD4⫹T cells in viral immunity. J. Exp. Med.209:1391–1395. http://dx.doi.org/10.1084/jem .20121517.
TABLE 5IL-2 ELISpot results of CD4⫹T cell response to TBE virus E transmembrane domain peptides using minipool and single-peptide analysis
Subject group and no.
CD4⫹T cell response (no. of spots/106cells) to:
Minipoola
Single peptideb(aa)
445–459 449–463 453–467 461–475 465–479 469–483 473–487 477–491 481–495
Vaccinated
209 73 21 21 36
211 89 59
212 84 54 54
214 33 25
222 83 38 33 23 28
227 29 26 36
229 68 22
230 269 143 118 33
231 45 22 27
242 51 25 45
Infected
114 26 41 31 56 36 51
118 59 28
132 38 59 34 24
a
Minipool containing peptides spanning aa 441 to 495.
bResults in the ELISpot assay were negative for the peptides at aa 441 to 455 and aa 457 to 471.
on November 7, 2019 by guest
http://jvi.asm.org/
6.Vyas JM, Van der Veen AG, Ploegh HL.2008. The known unknowns of antigen processing and presentation. Nat. Rev. Immunol.8:607– 618.
http://dx.doi.org/10.1038/nri2368.
7.Hsing LC, Rudensky AY.2005. The lysosomal cysteine proteases in MHC class II antigen presentation. Immunol. Rev.207:229 –241.http://dx.doi .org/10.1111/j.0105-2896.2005.00310.x.
8.Neefjes J, Jongsma ML, Paul P, Bakke O. 2011. Towards a systems understanding of MHC class I and MHC class II antigen presentation. Nat. Rev. Immunol.11:823– 836.http://dx.doi.org/10.1038/nri3084. 9.Robinson J, Halliwell JA, McWilliam H, Lopez R, Parham P, Marsh SG.
2013. The IMGT/HLA database. Nucleic Acids Res.41:D1222–D1227.
http://dx.doi.org/10.1093/nar/gks949.
10. Corse E, Gottschalk RA, Allison JP.2011. Strength of TCR-peptide/ MHC interactions and in vivo T cell responses. J. Immunol.186:5039 – 5045.http://dx.doi.org/10.4049/jimmunol.1003650.
11. Baumgartner CK, Malherbe LP.2011. Antigen-driven T-cell repertoire selection during adaptive immune responses. Immunol. Cell Biol.89:54 – 59.http://dx.doi.org/10.1038/icb.2010.117.
12. Sant AJ, Chaves FA, Krafcik FR, Lazarski CA, Menges P, Richards K, Weaver JM.2007. Immunodominance in CD4 T-cell responses: implica-tions for immune responses to influenza virus and for vaccine design. Expert Rev. Vaccines6:357–368.http://dx.doi.org/10.1586/14760584.6.3 .357.
13. Baumgartner CK, Malherbe LP.2010. Regulation of CD4 T-cell receptor diversity by vaccine adjuvants. Immunology130:16 –22.http://dx.doi.org /10.1111/j.1365-2567.2010.03265.x.
14. Scherle PA, Gerhard W.1986. Functional analysis of influenza-specific helper T cell clones in vivo. T cells specific for internal viral proteins provide cognate help for B cell responses to hemagglutinin. J. Exp. Med.
164:1114 –1128.
15. Scherle PA, Gerhard W.1988. Differential ability of B cells specific for external vs. internal influenza virus proteins to respond to help from in-fluenza virus-specific T-cell clones in vivo. Proc. Natl. Acad. Sci. U. S. A.
85:4446 – 4450.http://dx.doi.org/10.1073/pnas.85.12.4446.
16. Russell SM, Liew FY.1979. T cells primed by influenza virion internal components can cooperate in the antibody response to haemagglutinin. Nature280:147–148.http://dx.doi.org/10.1038/280147a0.
17. Milich DR, McLachlan A, Thornton GB, Hughes JL.1987. Antibody production to the nucleocapsid and envelope of the hepatitis B virus primed by a single synthetic T cell site. Nature329:547–549.http://dx.doi .org/10.1038/329547a0.
18. Fischer A, Nash S, Beverley PC, Feldmann M.1982. An influenza virus matrix protein-specific human T cell line with helper activity for in vitro anti-hemagglutinin antibody production. Eur. J. Immunol.12:844 – 849.
http://dx.doi.org/10.1002/eji.1830121009.
19. Bryson CJ, Jones TD, Baker MP.2010. Prediction of immunogenicity of therapeutic proteins: validity of computational tools. BioDrugs24:1– 8.
http://dx.doi.org/10.2165/11318560-000000000-00000.
20. Heinz FX, Stiasny K.2012. Flaviviruses and their antigenic structure. J. Clin. Virol.55:289 –295.http://dx.doi.org/10.1016/j.jcv.2012.08.024. 21. Mukhopadhyay S, Kim BS, Chipman PR, Rossmann MG, Kuhn RJ.
2003. Structure of West Nile virus. Science302:248.http://dx.doi.org/10 .1126/science.1089316.
22. Kuhn RJ, Zhang W, Rossmann MG, Pletnev SV, Corver J, Lenches E, Jones CT, Mukhopadhyay S, Chipman PR, Strauss EG, Baker TS, Strauss JH.2002. Structure of dengue virus: implications for flavivirus organization, maturation, and fusion. Cell108:717–725.http://dx.doi.org /10.1016/S0092-8674(02)00660-8.
23. Rey FA, Heinz FX, Mandl C, Kunz C, Harrison SC.1995. The envelope glycoprotein from tick-borne encephalitis virus at 2 Å resolution. Nature
375:291–298.http://dx.doi.org/10.1038/375291a0.
24. Dokland T, Walsh M, Mackenzie JM, Khromykh AA, Ee KH, Wang S.
2004. West Nile virus core protein; tetramer structure and ribbon formation. Structure12:1157–1163.http://dx.doi.org/10.1016/j.str.2004.04.024. 25. Anthony DD, Lehmann PV.2003. T-cell epitope mapping using the
ELISPOT approach. Methods 29:260 –269. http://dx.doi.org/10.1016 /S1046-2023(02)00348-1.
26. Richards KA, Chaves FA, Krafcik FR, Topham DJ, Lazarski CA, Sant AJ.2007. Directex vivoanalyses of HLA-DR1 transgenic mice reveal an exceptionally broad pattern of immunodominance in the primary HLA-DR1-restricted CD4 T-cell response to influenza virus hemagglutinin. J. Virol.81:7608 –7619.http://dx.doi.org/10.1128/JVI.02834-06.
27. Nayak JL, Richards KA, Chaves FA, Sant AJ. 2010. Analyses of the
specificity of CD4 T cells during the primary immune response to influ-enza virus reveals dramatic MHC-linked asymmetries in reactivity to in-dividual viral proteins. Viral Immunol.23:169 –180.http://dx.doi.org/10 .1089/vim.2009.0099.
28. Stiasny K, Aberle JH, Chmelik V, Karrer U, Holzmann H, Heinz FX.
2012. Quantitative determination of IgM antibodies reduces the pitfalls in the serodiagnosis of tick-borne encephalitis. J. Clin. Virol.54:115–120.
http://dx.doi.org/10.1016/j.jcv.2012.02.016.
29. Stiasny K, Holzmann H, Heinz FX.2009. Characteristics of antibody responses in tick-borne encephalitis vaccination breakthroughs. Vaccine
27:7021–7026.http://dx.doi.org/10.1016/j.vaccine.2009.09.069. 30. Kiermayr S, Kofler RM, Mandl CW, Messner P, Heinz FX. 2004.
Isolation of capsid protein dimers from the tick-borne encephalitis flavi-virus and in vitro assembly of capsid-like particles. J. Virol.78:8078 – 8084.
http://dx.doi.org/10.1128/JVI.78.15.8078-8084.2004.
31. Heinz FX, Kunz C.1981. Homogeneity of the structural glycoprotein from European isolates of tick-borne encephalitis virus: comparison with other flaviviruses. J. Gen. Virol.57:263–274.http://dx.doi.org/10.1099 /0022-1317-57-2-263.
32. Laemmli UK, Favre M.1973. Maturation of the head of bacteriophage T4. I. DNA packaging events. J. Mol. Biol.80:575–599.
33. Schaffner W, Weissmann C.1973. A rapid, sensitive, and specific method for the determination of protein in dilute solution. Anal. Biochem.56:
502–514.http://dx.doi.org/10.1016/0003-2697(73)90217-0.
34. Zhang X, Ge P, Yu X, Brannan JM, Bi G, Zhang Q, Schein S, Zhou ZH.
2013. Cryo-EM structure of the mature dengue virus at 3.5-Å resolution. Nat. Struct. Mol. Biol.20:105–110.http://dx.doi.org/10.1038/nsmb.2463. 35. Ludajic K, Fae I, Fischer GF.2006. Characterization of a new HLA-DPB1 allele, DPB1*010103. Tissue Antigens67:255–256.http://dx.doi.org/10 .1111/j.1399-0039.2006.00554.x.
36. Fischer GF, Fae I, Petrasek M, Haas H, Mayr WR.1995. An HLA-DR11 variant (HLA-DRB1*1115) segregating in a family of Turkish origin. Tis-sue Antigens 45:143–144. http://dx.doi.org/10.1111/j.1399-0039.1995 .tb02432.x.
37. Wang P, Sidney J, Dow C, Mothe B, Sette A, Peters B.2008. A systematic assessment of MHC class II peptide binding predictions and evaluation of a consensus approach. PLoS Comput. Biol.4:e1000048.http://dx.doi.org /10.1371/journal.pcbi.1000048.
38. Wang P, Sidney J, Kim Y, Sette A, Lund O, Nielsen M, Peters B.2010. Peptide binding predictions for HLA DR, DP and DQ molecules. BMC Bioinformatics11:568.http://dx.doi.org/10.1186/1471-2105-11-568. 39. Knapp B, Giczi V, Ribarics R, Schreiner W.2011. PeptX: using genetic
algorithms to optimize peptides for MHC binding. BMC Bioinformatics
12:241.http://dx.doi.org/10.1186/1471-2105-12-241.
40. Gelder CM, Welsh KI, Faith A, Lamb JR, Askonas BA.1995. Human CD4⫹T-cell repertoire of responses to influenza A virus hemagglutinin after recent natural infection. J. Virol.69