METHOD DEVELOPMENT AND VALIDATION FOR THE
SIMULTANEOUS ESTIMATION OF
QUINAPRIL AND HYDROCHLOROTHIAZIDE IN
BULK AND TABLET DOSAGE FORM BY RP-HPLC
A Dissertation submitted to
THE TAMILNADU Dr. M.G.R. MEDICAL UNIVERSITY
Chennai-600032In partial fulfillment of the requirements for the award of degree of
MASTER OF PHARMACY
IN
PHARMACEUTICAL ANALYSIS
Submitted byRegister No. 261230551
Under the Guidance of
Dr. S. ANANDA THANGADURAI, M.Pharm., Ph.D.,
DEPARTMENT OF PHARMACEUTICAL ANALYSIS SWAMY VIVEKANANDHA COLLEGE OF PHARMACY
ELAYAMPALAYAM, TIRUCHENGODE - 637 205 TAMILNADU, INDIA.
Dr. N. N. Rajendran, M.Pharm., Ph. D.,
Principal, Swamy Vivekanandha College of Pharmacy,
Tiruchengode-637 205, Namakkal (DT), Tamil Nadu. Ph.: +91-4288-234417
CERTIFICATE
This is to certify that the dissertation entitled “METHOD DEVELOPMENT AND VALIDATION FOR THE SIMULTANEOUS ESTIMATION OF QUINAPRIL AND HYDROCHLOROTHIAZIDE IN BULK AND TABLET DOSAGE FORM BY RP-HPLC” submitted to The Tamil Nadu Dr. M.G.R. Medical University, Chennai, is a bonafide project work of HARINI. K (Reg. No: 261230551), in the Department of Pharmaceutical Analysis, Swamy Vivekanandha College of Pharmacy, Tiruchengode, for the partial fulfillment of award of the degree in Master of Pharmacy under the guidance of Dr. S. ANANDA THANGADURAI, M.Pharm., Ph.D., Swamy Vivekanandha College of Pharmacy, Tiruchengode.
Date:
Place: Elayampalayam [Dr. N. N. RAJENDRAN]
Dr. S. AnandaThangadurai, M. Pharm., Ph. D., Professor & Head, Department of Pharmaceutical Analysis,
Swamy Vivekanandha College of Pharmacy, Tiruchengode-637 205, Namakkal (DT), Tamil Nadu. Ph.: +91-4288-234417
CERTIFICATE
This is to certify that the dissertation entitled “METHOD DEVELOPMENT AND VALIDATION FOR THE SIMULTANEOUS ESTIMATION OF QUINAPRIL AND HYDROCHLOROTHIAZIDE IN BULK AND TABLET DOSAGE FORM BY RP-HPLC” submitted to The Tamil Nadu Dr. M.G.R. Medical University, Chennai, is a bonafide project work of HARINI. K (Reg. No: 261230551), in the Department of Pharmaceutical Analysis, Swamy Vivekanandha College of Pharmacy, Tiruchengode, for the partial fulfillment of award of the degree in Master of Pharmacy under my supervision & guidance. This work has not been submitted in part or full for the award of any degree or diploma of this or any other university.
Date:
Swamy Vivekanandha College of Pharmacy Tiruchengode-637 205, Namakkal (DT),
Tamil Nadu,India. Ph.: +91-4288-234417
EVALUATION CERTIFICATE
This is to certify that the dissertation entitled “METHOD DEVELOPMENT AND VALIDATION FOR THE SIMULTANEOUS ESTIMATION OF QUINAPRIL AND HYDROCHLOROTHIAZIDE IN BULK AND TABLET DOSAGE FORM BY RP-HPLC” submitted to The Tamil Nadu Dr. M.G.R. Medical University, Chennai, is a bonafide project work of HARINI. K(Reg.No: 261230551), in the Department of Pharmaceutical Analysis, Swamy Vivekanandha College of Pharmacy, Tiruchengode, for the partial fulfillment of award of the degree in Master of Pharmacy under the guidance of Dr. S. ANANDA THANGADURAI, M.Pharm., Ph.D., Swamy Vivekanandha College of Pharmacy, Tiruchengode.
Internal Examiner External Examiner
Examination Center: Swamy Vivekanandha College of Pharmacy.
DEDICATED
TO ALMIGHTY
AND
ACKNOWLEDGEMENT
Behind every successful venture, it is always said that there is an invisible force, which shapes the things in the right way and directions in which they should be. I found it moral duty to bow to that divine power and thank him for imbibing in me the strength required for the successful completion of the thesis work.
Ability and ambition are not enough for success many an able person fails to achieve anything worthwhile because he has not been properly guided. Success of any project depends solely on support, guidance and encouragement received from the guide and well-wishers.
It is with a sense of pride and pleasure that, I humbly look back to acknowledge, those who have been a source of encouragement in my entire endeavor.
Many Thanks to Almighty, for it is He who began this work in me and carried it throughout completion.
The completion of this dissertation is not only fulfillment of my dreams but also the dreams of my Parents, who have taken lots of pain for me in completion of my higher studies.
I take this privilege and pleasure to acknowledge the contributions of many individuals who have been inspirational and supportive throughout my work undertaken and endowed me with the most precious knowledge to see success in my endeavor. My work bears the imprint of all those people.
We submit our sincere thanks to our beloved chairman and secretary “VidyaRatna, Rashtriya Rattan, Hind Ratna” Prof. Dr. M. Karunanithi, B.Pharm., M.S., Ph.D., D. Litt., for providing all the facilities to carry out this thesis work.
It gives me great pleasure to record my deep sense of gratitude and indebtedness to Dr. S. AnandaThangadurai, M.Pharm., Ph.D., Prof & Head., Department of Pharmaceutical Analysis, whose guidance, support, critical evaluations and professional eminency have inspired me a lot to put optimum efforts towards the completion of my thesis work.
It is a great pleasure to utilize this unique opportunity to express my deep sense of gratitude to Dr. N.N.Rajendran, M.Pharm., Ph.D., Principal, Swamy Vivekanandha College of Pharmacy, for his encouragement and advice in completion of the work.
Department of Pharmaceutical Chemistry, for his continuous encouragement and support in completion of my course and dissertation successfully.
It would be unwise if I forget to express my sincere thanks and gratitude to Mr. M. Jambulingam, M.Pharm., Asst.professor, Department of Pharmaceutical Analysis for his valuable help, support and encouragement during the work.
I am elated to place on record my profound sense of gratitude Mr. D. Kamalakannan, M.Pharm., Asst. professor, Department of Pharmaceutical Analysis, for his timely help during the work.
Good friends are gift of God! I express my deep sense of gratitude and love towards my friends, well wishers and all my batch mates.
I would like to express my sincere thanks to C. Kalyani for providing constant source of inspiration and has always encouraged scientific thinking and instilled me a sense of discipline in my work.
I express my deep sense of gratitude and love to my father Mr. K. Anjaneyulu for timely help throughout the study without his support I wouldn’t have reached this place, my love and gratitude to my beloved Mother Mrs. K. Shashikala, from depth of my heart for giving me more than what I deserved. It gives me an immense pleasure to dedicate my research work at their feet without whose blessings and vision. I would not have been able to achieve this task.
I pay tribute to my beloved family for lifting me up till this phase of life. I thank them for their love, trust, patience and support and bearing all kinds of stress to make me what am.
I would like to express my sincere thanks to Mr. C. Senthil for their help and support in all my laboratory tests.
I would like to thank all those who have helped me directly or indirectly to complete this work successfully.
CONTENTS
CHAPTER NO. DESCRIPTION PAGES
1 INTRODUCTION 1-5
2 LITERATURE REVIEW 6-9
3 AIM AND OBJECTIVE 10
4 DRUG PROFILE 11-14
5 EXPERIMENTAL WORK 15-27
6 RESULTS AND DISCUSSION 28-55
7 SUMMARY & CONCLUSIONS 56-57
8 REFERENCES 58-59
INTRODUCTION
Analytical chemistry plays an increasingly important role in the pharmaceutical industry where, aside from QA, it is used in discovery of new drug candidates and in clinical applications where understanding the interactions between the drug and the patient are critical. Analytical chemistry is defined as the science and art of determining the composition of material in terms of elements or compounds contained in it1
. Analytical chemistry is divided into two branches quantitative and qualitative.. A qualitative method is the information about the identity of atomic or molecular species or functional groups in the sample. A quantitative method provides numerical information as to the relative amount of one or more of these components.
For analysis of these drugs different analytical methods are routinely being used. These analytical methods are classified as chemical and instrumental. The chemical methods include Gravimetric and Titrimetric. These methods are simple but less precise and more time consuming so now days these methods are not suggested for the routine analysis. The instrumental methods include electrochemical methods - Electro gravimetric method, Potentiometry, Colorimetry, Conductometry, Polarography and Optical methods - Absorption and Emission methods. The Absorption methods include Visible Spectrophotometry, Ultraviolet Spectrophotometry, Atomic Absorption Spectrophotometry, Infrared Spectrophotometry, and Emission methods include Emission Spectroscopy, Flame Photometry, Fluorimetry, etc. The other outstanding methods include isotopes, radioactivity, X-ray fluorescence and separation methods as various chromatographic principles viz. HPLC, GC, HPTLC, LC-MS2 .
Pharmaceutical analysis plays a major role today, and it can be considered as an interdisciplinary subject. Pharmaceutical analysis derives its principles from various branches of science like Chemistry, Physics, Microbiology, Nuclear Science, Electronics, etc. Analytical method is a specific application of a technique to solve an analytical problem. Analytical instrumentation plays an important role in the production and evaluation of new products and in the protection of consumers and the environment. This instrumentation provides the lower detection limits required to assure safe foods, drugs, water and air3
.
HPLC (High performance liquid chromatography)
the column. The different component in the mixture pass through the column at differentiates due to differences in their partition behavior between the mobile phase and the stationary phase.
Method development is the process of proving that an analytical method is acceptable for use in our laboratory to measure the concentration of an API (Active pharmaceutical ingredient) in a specific compounded dosage form. The development of a method of analysis of any compound is usually based on existing literature, using same or quite similar instrumentation. But now days HPLC based method is not similar as compare to existing literature based approaches. The development of new or any improved method should be beneficial in any way than the existing method.5
Method development usually requires selecting the method requirement and deciding the instrumentation to utilize for what purpose. There are different kinds of reasons for developing new methods for analysis:
-I. There is no any suitable method for a particular compound or combination of that compound.
II. The existing method may be tedious, contamination-prone or may be not well suitable.
III. The existing method may be too expensive, time consuming or may not be easily automated.
IV. The existing method may be having less accuracy or precision.
V. The existing method may not provide adequate sensitivity or analyte selectivity in the sample.
VI. There may be need of alternative method to confirm legal or scientific reasons. VII. Analytical data originally or turned by existing method.
Then word validation simply means, “Assessment of validity” or action of proving effectiveness. “The objective of validation of an analytical procedure is to demonstrate that it is suitable for its intended purpose. “According to ICH Guideline Federal Method Validation is an Error assessment process.
mandatory requirement for registration of any pharmaceutical product or pesticide formulation, validated methods are only applicable for proficiency testing, analytical methods should be validated unless the method employed is included in the relevant pharmacopoeia or other recognized standard reference.6
Validation parameters
Validation of analytical methods is an essential but time - consuming activity for most analytical development laboratories. It is therefore important to understand the requirements of method validation in more detail and the options that are available to allow for optimal utilization of analytical resources in a development laboratory.
Accuracy
The International Convention on Harmonization (ICH) defines accuracy is usually reported as percent recovery by the assay of known added amount of analyte in the sample or as the difference between the mean and the accepted true value together with the confidence intervals. The range for the accuracy limit should be within the linear range.7
Method Precision
The precision of an analytical procedure expresses the closeness of agreement between a series of measurements obtained from multiple samples of the same homogeneous sample under prescribed conditions. Precision is usually investigated at three levels: repeatability, intermediate precision, and reproducibility.
Repeatability
Repeatability is a measure of the precision under the same operating conditions over a short interval of time, that is, under normal operating conditions of the analytical method with the same equipment. It is referred to as intra - assay precision.
Intermediate Precision
Intermediate precision is defined as the variation within the same laboratory. Typical parameters that are investigated include day-to-day variation, analyst variation, and equipment variation.
Reproducibility
Reproducibility measures the precision between laboratories. This parameter is considered in the standardization of an analytical procedure
The detection limit (DL) is the lowest amount of analyte in a sample that can be detected but not necessarily quantities under the stated experimental conditions. The detection is usually expressed as the concentration of the analyte in the sample, for example, percentage, parts per million (ppm), or parts per billion (ppb).
Quantitation Limit
The Quantitation Limit (QL) is a characteristic of quantitative assays for low levels of compounds in sample matrices, such as impurities in bulk drug substances and Degradation products in finished pharmaceuticals. The detection is usually expressed as the concentration of the analyte in the sample, for example, percentage, parts per million (ppm), or parts per billion (ppb).
Linearity
ICH defines linearity of an analytical procedure as the ability (within a given range) to obtain test results of variable data (e.g., absorbance and area under the curve) which are directly proportional to the concentration (amount of analyte) in the sample. At least five concentration levels should be used. Under normal circumstances, linearity is acceptable with a coefficient of determination (r2
) of 0.997. Robustness
Robustness of an analytical procedure is a measure of the analytical method to remain unaffected by small but deliberate variations in method parameters and provides an indication of its reliability during normal usage.
The HPLC method was considered the choice of estimation, since this method is the most powerful of all chromatographic and other separative methods. The HPLC method has enabled analytical chemist to attain great success in solving his analytical problems.
In this study we have planned to develop a new simple, accurate, precise, RP-HPLC method for simultaneous estimation of Quinapril and Hydrochlorothiazide from bulk and pharmaceutical dosage form.
2. LITERATURE REVIEW
different biological fluids. Analytical methods are required to characterize drug substances and drug products composition during all phases of pharmaceutical development. Many experiments have been performed in different countries to determine the Quinapril and Hydrochlorothiazide by HPLC, UPLC, LC-MS, TLC and HPTLC methods which are summarized below.
UV-Visible spectroscopy has a simple, sensitive, accurate and reproducible method has been developed for simultaneous estimation of both the drugs by the Simultaneous equation method, using methanol as solvent. The two wavelengths 257 nm λmax of Quinapril Hydrochloride (QNA-H) and 271 nm λmax of Hydrochlorothiazide (HCTZ) were selected for the formation of Simultaneous equations. The two drugs follow Beer-Lambert’s law over the concentration range of 5- 30 µg/ ml of QNA-H and 2.5 – 15 µg/ ml of HCTZ. Recovery study was performed to confirm the accuracy of the method. The recovery of the Quinapril Hydrochloride and Hydrochlorothiazide were found near to 100 %. The Results were found to satisfactory and reproducible. The methods were validated as per ICH guidelines. The proposed methods have been applied successfully to the analysis of cited drugs in pharmaceutical formulations9
.
A Reversed-Phase High Performance Liquid Chromatographic (RP-HPLC) method for the simultaneous determination of quinapril (QNP) and hydrochlorothiazide (HCZ) in pharmaceutical dosage forms. In this method quinapril, hydrochlorothiazide and perindopril (internal standard) were separated using a reversed phase column (Hichrom C18; 250 ×4.6 mm i.d.; 10 µm) with acetonitrile: potassium dihydrogen phosphate (at pH 2.5; 0.067 M) (40:60 v/v) as a mobile phase. UV visible detector set at 211 nm and mobile phase was pumped at 1.0 mL/min flow rate. The chromatographic separation was performed at 25oC. In these conditions the retention times for quinapril, hydrochlorothiazide and perindoprile were 4.391, 3.237 and 3.931 min, respectively. Linearity was obtained in the concentration range of 2-30 µg/ mL for quinapril and 1.25-18.75 µg/ mL for hydrochlorothiazide. The proposed method has been fully validated and allows a number of cost- and time-saving benefits. It was successfully applied to the determination of QNP and HCZ in synthetic mixtures and in pharmaceutical dosage forms. The proposed method is simple, rapid and suitable for quality control (QC) applications10
.
using potassium Dihydrogen Phosphate buffer (pH 4.0 adjusted with Ortho Phosphoric acid) :Acetonitrile(70:30 v/v) mobile phase, andC18 column ODS(100 mm x 4.6 mm, 3.0 µ particle size) as stationary phase with detection wavelength of 215 nm. Linearity was obtained in the concentration range of 5-25 µg/ ml for both the drugs. The % recoveries of the both the drugs were found to be 99.50 – 101.50 % and 99.00 –101.06%respectively.The LOD were found to be 0.014 µg/ mL and 0.013 µg/ mL at 215 nm for Quinapril Hydrochloride and Hydrochlorthiazide respectively. Methods were statistically validated for Accuracy, precision, specificity, LOQ, and robustness according to ICH guidelines and can be used for analysis of combined dosage form11
.
Quinapril and quinaprilat concentrations were determined in perfusate, urine, and perfusate ultrafiltrate using a specific and sensitive reversed-phase high-performance liquid chromatographic procedure with radiochemical detection, coupled to liquid scintillation counting spectrometry. Quinapril and quinaprilat were measured in perfusate and urine after pretreatment with acetonitrile and subsequent centrifugation. Perfusate ultrafiltrate was used as collected. Two quinapril diketopiperazine metabolites, PD 109488 and PD 113413, were separated chromatographically from quinapril, quinaprilat, and from each other. Assay performance for quinapril and quinaprilat was assessed by examining precision and accuracy of the assay over four days. Using a 100-µl sample volume, the limit of quantitation for both 3H-quinapril and 3
H-quinaprilat (sp. act. ≈ 2.0 µCi/ µg) was 1 ng/ mL12
.
Ion- Pair HPLC was a simple, precise and rapid HPLC method has been developed and validated for the estimation of quinapril and hydrochlorothiazide simultaneously in combined dosage form. The mobile phase used was a mixture of 0.1% v/v triethylamine (pH 3.5), containing 1 mm of hexane sulphonic acid: acetonitrile (30:70% v/v). The detection of quinapril and hydrochlorothiazide was carried out on photo diode array detector at 220 nm. Results of the analysis were validated statistically and by recovery studies. The proposed method can be successfully used to determine the drug contents of marketed formulation13
.
wavelength of 215 nm. Calibration curves were linear over the ranges 20 to 1,000 ng/ mL for quinaprilat and 10 to 500 for quinapril. The limits of quantification were 20 and 10 ng/ mL for quinaprilat and quinapril, respectively. Extraction recoveries were higher than 90% for quinapril and 80% for quinaprilat. This method has been successfully applied to a bioequivalence study of quinapril in healthy subjects14
.
A novel, specific and sensitive ultra performance liquid chromatography tandem mass spectrometry (UPLC-MS/MS) method was developed for the simultaneous determination of quinapril and its active metabolite quinaprilat in human plasma. The method involves a simple, one-step extraction procedure coupled with an Acquity UPLC BEH C18 column (100 x 2.1 mm, i.d., 1.7 microm) with isocratic elution at a flow-rate of 0.2 mL/ min and lisinopril as the internal standard. Detection was performed on a triple-quadrupole tandem mass spectrometer in multiple reactions monitoring mode via electrospray ionization. Using 250 microL plasma, the methods were validated over the concentration range 5.010-500.374 ng/ mL for quinapril and 10.012-1000 ng/ mL for quinaprilat, with a lower limit of quantification of 5.010 ng/ mL for quinapril and 10.012 ng/ mL for quinaprilat. The intra- and inter-day precision and accuracy were within 10.0%. The recovery was 85.8, 62.6 and 61.3% for quinapril, quinaprilat and lisinopril, respectively. Total run time was 3.0 min only15.
A accurate, precise and sensitive UV Spectrophotometric method was developed for the determination of Nebivolol HCl (NEB-H) and Hydrochlorothiazide (HCTZ) in bulk as well as in the pharmaceutical formulation. Calibration curves were linear in range of 10-80 µg/ mL (r2=0.999) and 2-16 µg/ mL (r2=0.998) at λmax of 281 and 271nm for Nebivolol HCl and Hydrochlorothiazide respectively. The method was validated statistically16.
Quinapril hydrochloride and hydrochlorothiazide were simultaneously determined by HPTLC in pharmaceutical formulations. The drugs were separated on silica gel 60 F plates using suitable combination of solvents as mobile phase. The validation parameters, tested in accordance with the requirements of ICH guidelines, prove the suitability of methods17
.
reference and test solutions were carried out in 1 cm matched quartz cell over the range of 200-400 nm. Methanol and distilled water are used as solvent. Results were shown that the first method is the application of simultaneous equation. Where the linearity ranges for both the drugs were 5-35 µg/ mL. The second method is the determination of ratio of absorbance at 271 nm, the maximum absorption of HZ and isobestic wavelength 209 nm, the linearity ranges for both the drugs were 10-120 µg/ mL The third method is the first-order derivative method, where the CAP shows wavelength at 222 nm and HZ shows at 340 nm, and the linearity ranges for CAP and HZ were 1-30 µg/ mL and 1-40 µg/ mL, respectively. The proposed procedures were successfully applied for the simultaneous determination of both the drugs in commercial tablet preparation. The validity of the proposed methods was assessed by applying the standard addition technique where the percentage recovery of the added standard was found to be 99.52±0.214 and 99.00±0.165 using the simultaneous equation method, 99.76±0.684 and 99.58±0.279 using the graphical absorbance ratio method, and 99.45±0295 and 99.21±0.678 using first derivative method, for CAP and HZ, respectively. The proposed procedures are rapid, simple, require no preliminary separation steps, and can be used for routine analysis of both drugs in quality control laboratories18
.
3. AIM AND OBJECTIVE
formulation may be either in the new entities in the market or partial structural modification of the existing drugs or novel dosage forms or multi component dosage forms. The multi component dosage form proves to be effective due to the combined mode of action on the body. The complexity of dosage forms including the presence of multiple drug entities creates considerable challenge to the analytical chemist during the development of assay procedure. The estimation of individual drugs in these multi component dosage forms becomes difficult due to difficult extraction or isolation procedures.
The literature survey was carried out and revealed that very few methods are reported for the simultaneous estimation of these drugs in other combinations. Hence an attempt was made to develop a simple, specific, rapid, precise, accurate, linear, validated and cost efficient HPLC method for the simultaneous estimation of Quinapril and Hydrochlorothiazide in combined dosage forms was developed.
The main aim of the research was
To develop a method for the simultaneous estimation of Quinapril and Hydrochlorothiazide in bulk and pharmaceutical dosage form and Validate the method proposed in accordance with ICH guidelines for the intended analytical application.
To validate the developed RP-HPLC method by using various validation parameters such as accuracy, precision, linearity, system suitability, robustness, ruggedness, limit of detection and limit of quantitation.
4. DRUG PROFILE Hydrochlorothiazide
IUPAC Name19
:6-chloro-1,1-dioxo-3,4-dihydro-2H-1,2,4-benzothiadiazine-7-sulfonamide.
Molecular Formula : C7H8ClN3O4S2 Molecular Weight : 297.74
pKa : 7.9
Description:
A thiazide diuretic often considered the prototypical member of this class. It reduces the reabsorption of electrolytes from the renal tubules. This results in increased excretion of water and electrolytes, including sodium, potassium, chloride, and magnesium. It has been used in the treatment of several disorders including edema, hypertension, diabetes insipidus, and hypoparathyroidism.
Solubility:
Slightly or very slightly soluble in water; sparingly soluble in alcohol; soluble in acetone; freely soluble in dimethylformamide; n-butylamine; and solutions of alkali hydroxides; insoluble in ether, chloroform, and dilute mineral acids.
Melting point : 274C
Category : Anti-hypertensive
Diuretics
Sodium chloride symporter inhibitors
Pharmacodynamics : Thiazides such as hydrochlorothiazide promote water loss from the body (diuretics). They inhibit Na+
/Cl
activating calcium-activated potassium channels (large conductance) in vascular smooth muscles and inhibiting various carbonic anhydrases in vascular tissue.
Mechanism Of Action : Hydrochlorothiazide, a thiazide diuretic, inhibits water reabsorption in the nephron by inhibiting the sodium-chloride symporter (SLC12A3) in the distal convoluted tubule, which is responsible for 5% of total sodium reabsorption. Normally, the sodium-chloride symporter transports sodium and chloride from the lumen into the epithelial cell lining the distal convoluted tubule. The energy for this is provided by a sodium gradient established by sodium-potassium ATPases on the basolateral membrane. Once sodium has entered the cell, it is transported out into the basolateral interstitium via the sodium-potassium ATPase, causing an increase in the osmolarity of the interstitium, thereby establishing an osmotic gradient for water reabsorption. By blocking the sodium-chloride symporter, hydrochlorothiazide effectively reduces the osmotic gradient and water reabsorption throughout the nephron.
Pharmacokinetics: Absorption – 50-60% Protein binding – 67.9%
Metabolism – hydrochlorothiazide is not metabolized
Route of elimination – hydrochlorothiazide is not metabolized but is eliminated rapidly by the kidney. Hydrochlorothiazide crosses the placental barrier but not the blood barrier and is secreted in breast milk
Half life – 5.6 – 14.8 hours
Adverse affects: The most common signs and symptoms observed are those caused by electrolyte depletion (hypokalemia, hypochloremia, hyponatremia) and dehydration resulting from excessive diuresis. If digitalis has also been administered, hypokalemia may accentuate cardiac arrhythmias. The oral LD50 of hydrochlorothiazide is greater than 10 g/kg in the mouse and rat.
Dose : accuretic – 12.5mg tablets
IUPAC Name21
: (3S)-2-[(2S)-2-{[(2S
yl]amino} propanoyl] 3-carboxylic acid.
Molecular Formula : C25H30N2O5 Molecular Weight : 438.516 g/mol
Solubility : It is soluble in water, ethanol and methanol. Melting point : 120 - 130°C
pKa : strongly acidic - 3.6 and basic – 5.7
Category : Anti-hypertensive
Angiotensin converting enzyme inhibitors
Description : Quinapril is a prodrug that belongs to the angiotensin-converting enzyme (ACE) inhibitor class of medications. It is metabolized to quinaprilat (quinapril diacid) following oral administration. Quinaprilat is a competitive inhibitor of ACE, the enzyme responsible for the conversion of angiotensin I (ATI) to angiotensin II (ATII). ATII regulates blood pressure and is a key component of the renin-angiotensin-aldosterone system (RAAS). Quinapril may be used to treat essential hypertension and congestive heart failure.
Pharmacodynamics22
major effects, ATII induces the thirst response via stimulation of hypothalamic neurons. ACE inhibitors inhibit the rapid conversion of ATI to ATII and antagonize RAAS-induced increases in blood pressure. ACE (also known as kininase II) is also involved in the enzymatic deactivation of bradykinin, a vasodilator.
Mechanism of Action : Quinaprilat, the principle active metabolite of quinapril competes with ATI for binding to ACE and inhibits and enzymatic proteolysis of ATI to ATII. Decreasing ATII levels in the body decreases blood pressure by inhibiting the pressor effects of ATII. Quinaprilat also causes an increase in plasma renin activity likely due to a loss of feedback inhibition mediated by ATII on the release of renin and/or stimulation of reflex mechanisms via baroreceptors.
Pharmacokinetics :
Peak plasma concentrations of quinapril occur within one hour following oral administration. The extent of absorption is at least 60%.
Protein binding – 97%. Metabolism – Hepatic
Route of Elimination - Quinaprilat is eliminated primarily by renal excretion, up to 96% of an IV dose
Half life - Elimination half life is 2 hours with a prolonged terminal phase of 25 hours. Adverse Reactions / Side Effects:
Overdose may lead to severe hypotension. LD50=1739mg/kg (orally in mice). The most common adverse effects observed in controlled clinical trials were dizziness, cough, chest pain, dyspnea, fatigue, and nausea/vomiting.
Dose: accupril, quinapril – 20mg tablets.
5. EXPERIMENTAL WORK 5.1. MATERIALS AND METHODS
S.NO Name Model Make
1 Analytical balance Denver Secura
2 UV-Visible Spectrophotometer UV-3600 Shimadzu
3 HPLC HP Agilent 1100 Agilent
4 pH meter pH spear Eutech
5 Sonicator Branson 1510
ultrasonic cleaner
Branson
Chemicals used
S.NO Name Specification Grade
1 HPLC water MERCK Milli-Q
2 Acetonitrile MERCK HPLC
3 Potassium dihydrogen orthophosphate
MERCK HPLC
4 Orthophosphoric acid MERCK HPLC
5 Triethylamine MERCK HPLC
Active pharmaceutical Ingredient (pure drug)
S.NO Name Specification
1 Quinapril and Hydrochlorothiazide Reference standard
Marketed Formulation
S.NO Name Manufacturer
1 Accupril H(20+12.5mg) Pfizer limited
5.2. METHOD DEVELOPMENT
Selection of wavelength:
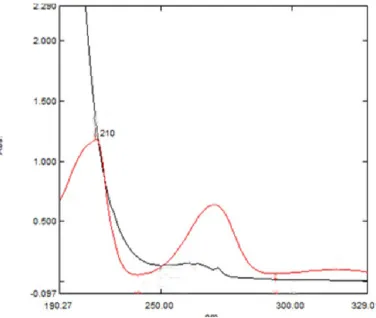
The known concentration of quinapril and hydrochlorothiazide equivalent to 100 µg mL-1 were weighed separately and dissolved in 100 mL volumetric flasks using mobile phase. The resulting solutions were scanned in the range of 200-400 nm.
The scanned chromatogram of Hydrochlorothiazide and Quinapril are overlaid and observed that isobestic point at 210 nm.
HPLC:
Selection of mobile phase:
To progress an accurate and precise RP-HPLC method for simultaneous estimation of Quinapril and hydrochlorothiazide, their standard solutions were injected into the HPLC system. Based on literature survey and solubility properties, various composition of mobile phase with different flow rates were used in order to regulate the optimized condition for effective separation of both drugs. A liquid chromatography system consists of HP Agilent 1100 equipped with isocratic pump and UV detector. The system was controlled by EZ CHROME software. The flow rate of Quinapril and Hydrochlorothiazide were tried from 0.8 to 1.2 mL.
Trial-1
Preparation of buffer:
Weigh accurately 2.72 gm of Potassium dihydrogen orthophosphate (KH2PO4) was dissolved in 900 mL of milli-Q water into a 1000mL beaker, sonicated and make up to the final volume add 0.6 mL of Triethylamine then adjust the solution to pH- 4.5 with dilute orthophosphoric acid (OPA) solution.
Preparation of mobile phase:
75 mL of potassium dihydrogen orthophosphate buffer of pH 4.5 and 25 mL of acetonitrile was taken into 100 mL volumetric flask, sonicated for 25 min and filtered.
Preparation of standard stock solution for Quinapril and Hydrochlorothiazide:
Standard stock solution of pure drugs were prepared separately by dissolving 20 mg of Quinapril with 7 mL diluent into a 10 mL clean dry volumetric flask and make up to 10 ml with mobile phase. Pipette out 1 mL and make up to 10mL to get a final concentration of 200 µg mL-1 (stock solution A). Dissolve 12.5 mg of Hydrochlorothiazide with 7 mL diluent into a 10 mL clean dry volumetric flask and made up to 10 mL (1250 µ g mL-1
) with mobile phase. Pipette out 1mL (1250 µg mL-1
) solution and dilute to 10 mL to get a final concentration of 125 µ g mL-1 (stock solution B).
Pipette out 1.0mL from stock solution A of Quinapril and stock solution B hydrochlorothiazide were mixed in a 10 mL volumetric flask and made up to volume with mobile phase to get a mixed standard solution containing 200 µ g mL-1 of Quinapril and 125 µg mL-1
ofHydrochlorothiazide as final concentration. Chromatographic conditions:
Ten micro liters of sample was injected by using auto injector and chromatogram was developed using potassium dihydrogen phosphate buffer : acetonitrile (75:25% v/v) as a mobile phase. The pH was maintained at 4.5. The flow rate was maintained at 0.8 mL min-1
and ⁰
column temperature was maintained at 30 C. Detector wavelength was fixed at 210 nm. Result obtained was shown in Table 1 and chromatogram was shown in Fig 2.
Trial-2
Preparation of buffer:
Weigh accurately 2.72 gm of Potassium dihydrogen orthophosphate (KH2PO4) was dissolved in 900 mL of milli-Q water into a 1000 mL beaker, sonicated and make up to the final volume add 0.6 mL of Triethylamine then adjust the solution to pH-4.5 with dilute orthophosphoric acid (OPA) solution.
Preparation of mobile phase:
70 mL of potassium dihydrogen orthophosphate buffer of pH 4.5 and 30 mL of acetonitrile was taken into 100 mL volumetric flask, sonicated for 25 min and filtered.
Preparation of standard stock solution for Quinapril and Hydrochlorothiazide:
Standard stock solution of pure drugs were prepared separately by dissolving 20 mg of Quinapril with 7 mL diluent into a 10 mL clean dry volumetric flask and make up to 10ml with mobile phase. Pipette out 1 mL and make up to 10mL to get a final concentration of 200 µg mL-1 (stock solution A). Dissolve 12.5 mg of Hydrochlorothiazide with 7 mL diluent into a 10 mL clean dry volumetric flask and made up to 10 mL (1250 µ g mL-1
) with mobile phase. Pipette out 1mL (1250 µg mL-1
) solution and dilute to 10 mL to get a final concentration of 125 µ g mL-1 (stock solution B).
Pipette out 1.0 mL from stock solution A of Quinapril and stock solution B hydrochlorothiazide were mixed in a 10 mL volumetric flask and made up to volume with mobile phase to get a mixed standard solution containing 200 µ g mL-1 of Quinapril and 125 µg mL-1
ofHydrochlorothiazide as final concentration. Chromatographic conditions:
Ten micro liters of sample was injected by using auto injector and chromatogram was developed using potassium dihydrogen phosphate buffer : acetonitrile (70:30% v/v) as a mobile phase. The pH was maintained at 4.5. The flow rate was maintained at 0.8 mL min-1
and ⁰
column temperature was maintained at 30 C. Detector wavelength was fixed at 210 nm. Result obtained was shown in Table 2 and chromatogram was shown in Fig 3
Trial-3
Preparation of buffer:
Weigh accurately 2.72 gm of Potassium dihydrogen orthophosphate (KH2PO4) was dissolved in 900 mL of milli-Q water into a 1000mL beaker, sonicated and make up to the final volume add 0.6 mL of Triethylamine then adjust the solution to pH-4.5 with dilute orthophosphoric acid (OPA) solution.
Preparation of mobile phase:
75 mL of potassium dihydrogen orthophosphate buffer of pH 4.5 and 35 mL of acetonitrile was taken into 100 mL volumetric flask, sonicated for 25 min and filtered.
Preparation of standard stock solution for Quinapril and Hydrochlorothiazide:
Standard stock solution of pure drugs were prepared separately by dissolving 20 mg of Quinapril with 7 mL diluent into a 10 mL clean dry volumetric flask and make up to 10 mL with mobile phase. Pipette out 1mL and make up to 10mL to get a final concentration of 200 µg mL-1 (stock solution A). Dissolve 12.5 mg of Hydrochlorothiazide with 7 mL diluent into a 10 mL clean dry volumetric flask and made up to 10 mL (1250 µ g mL-1
) with mobile phase. Pipette out 1 mL (1250 µ g mL-1
) solution and dilute to 10 mL to get a final concentration of 125 µg mL-1 (stock solution B).
Pipette out 1.0 mL from stock solution A of Quinapril and stock solution B hydrochlorothiazide were mixed in a 10 mL volumetric flask and made up to volume with mobile phase to get a mixed standard solution containing 200 µ g mL-1 of Quinapril and 125 µ g mL-1 of Hydrochlorothiazide as final concentration.
Chromatographic conditions:
Ten micro liters of sample was injected by using auto injector and chromatogram was developed using potassium dihydrogen phosphate buffer : acetonitrile (75:35% v/v) as a mobile phase. The pH was maintained at 4.5. The flow rate was maintained at 0.8 mL min-1
and column temperature was maintained at 30⁰C. Detector wavelength was fixed at 210 nm. Result obtained was shown in Table 3 and chromatogram was shown in Fig 4
Trial-4
Preparation of buffer:
Weigh accurately 2.72 gm of Potassium dihydrogen orthophosphate (KH2PO4) was dissolved in 900 mL of milli-Q water into a 1000 mL beaker, sonicated and make up to the final volume add 0.6 mL of Triethylamine then adjust the solution to pH-4.5 with dilute orthophosphoric acid (OPA) solution.
Preparation of mobile phase:
60 mL of potassium dihydrogen orthophosphate buffer of pH 4.5 and 40 mL of acetonitrile was taken into 100 mL volumetric flask, sonicated for 25 min and filtered.
Preparation of standard stock solution for Quinapril and Hydrochlorothiazide:
Standard stock solution of pure drugs were prepared separately by dissolving 20 mg of Quinapril with 7 mL diluent into a 10 mL clean dry volumetric flask and make up to 10 mL with mobile phase. Pipette out 1 mL and make up to 10 mL to get a final concentration of 200 µg mL-1
(stock solution A). Dissolve 12.5 mg of Hydrochlorothiazide with 7 mL diluent into a 10 mL clean dry volumetric flask and made up to 10 mL (1250 µg mL-1
) with mobile phase. Pipette out 1mL (1250 µg mL-1
) solution and dilute to 10 mL to get a final concentration of 125 µg mL-1
(stock solution B).
Pipette out 1.0 mL from stock solution A of Quinapril and stock solution B hydrochlorothiazide were mixed in a 10 mL volumetric flask and made up to volume with mobile phase to get a mixed standard solution containing 200 µ g mL-1 of Quinapril and 125 µ g mL-1 of Hydrochlorothiazide as final concentration.
Chromatographic conditions:
Ten micro liters of sample was injected by using auto injector and chromatogram was developed using potassium dihydrogen phosphate buffer : acetonitrile (60:40% v/v)as a mobile phase. The pH was maintained at 4.5. The flow rate was maintained at 0.8 mL min-1
and column temperature was maintained at 30⁰C. Detector wavelength was fixed at 210 nm. Result obtained was shown in Table 4 and chromatogram was shown in Fig 5.
OPTIMIZED METHOD Trial-5
Preparation of buffer:
Weigh accurately 2.72 gm of Potassium dihydrogen orthophosphate (KH2PO4) was dissolved in 900 mL of milli-Q water into a 1000mL beaker, sonicated and make up to the final volume add 0.6 mL of Triethylamine then adjust the solution to pH- 4.5 with dilute orthophosphoric acid (OPA) solution.
Preparation of mobile phase:
65 mL of potassium dihydrogen orthophosphate buffer of pH 4.5 and 45 mL of acetonitrile was taken into 100 mL volumetric flask, sonicated for 25 min and filtered.
Preparation of standard stock solution for Quinapril and Hydrochlorothiazide:
Standard stock solution of pure drugs were prepared separately by dissolving 20 mg of Quinapril with 7 mL diluent into a 10 mL clean dry volumetric flask and make up to 10 mL with mobile phase. Pipette out 1 mL and make up to 10mL to get a final concentration of 200 µg mL-1 (stock solution A). Dissolve 12.5 mg of Hydrochlorothiazide with 7 mL diluent into a 10 mL clean dry volumetric flask and made up to 10 mL (1250 µ g mL-1
) with mobile phase. Pipette out 1 mL (1250 µg mL-1
) solution and dilute to 10mL to get a final concentration of 125 µ g mL-1 (stock solution B).
Pipette out 1.0 mL from stock solution A of Quinapril and stock solution B hydrochlorothiazide were mixed in a 10 mL volumetric flask and made up to volume with mobile phase to get a mixed standard solution containing 200 µ g mL-1 of Quinapril and 125 µ g mL-1 of Hydrochlorothiazide as final concentration.
Chromatographic conditions:
Ten micro liters of sample was injected by using auto injector and chromatogram was developed using potassium dihydrogen phosphate buffer : acetonitrile (65:35% v/v) as a mobile phase. The pH was maintained at 4.5. The flow rate was maintained at 0.9 mL min-1
and column temperature was maintained at 30⁰C. Detector wavelength was fixed at 210 nm. Result obtained was shown in Table 5 and chromatogram was shown in Fig 6
5.2.1. ASSAY OF QUINAPRIL AND HYDROCHLOROTHIAZIDE Standard Stock preparation:
Standard stock solution of pure drugs were prepared separately by dissolving 20 mg of Quinapril with 7 mL diluent into a 10 mL clean dry volumetric flask and make up to 10 ml with mobile phase. Pipette out 1 mL and make up to 10mL to get a final concentration of 200 µg mL-1 (stock solution A). Dissolve 12.5 mg of Hydrochlorothiazide with 7 mL diluent into a 10 mL clean dry volumetric flask and made up to 10 mL (1250 µ g mL-1
) with mobile phase. Pipette out 1 mL (1250 µ g mL-1
) solution and dilute to 10 mL to get a final concentration of 125 µg mL-1 (stock solution B).
Preparation of standard solution of Quinapril and Hydrochlorothiazide:
Pipette out 1.0 mL from stock solution A of Quinapril and stock solution B hydrochlorothiazide were mixed in a 10 mL volumetric flask and made up to volume with mobile phase to get a mixed standard solution containing 200 µ g mL-1 of Quinapril and 125 µ g mL-1 of Hydrochlorothiazide as final concentration.
Preparation of test solution:
20 tablets were weighed and crushed into powder equivalent to 250 mg was transferred to 10 mL volumetric flask and dissolve it in7 mL of diluent and sonicated for 25 min, further the volume made up with mobile phase and filtered. From the filtered solution 2 mL was pipette out into a 10 mL volumetric flask and made up to 10 mL with mobile phase.
Inject 10 µl of standard and sample solutions into the chromatographic system and measure the areas for the Quinapril and Hydrochlorothiazide peaks. Results obtained were shown in Table 6 - 8and Fig 7-8
Amount of drug in tablet was calculated using following formula Sample area X standard weight
Amount present = X Dilution factor Standard area X sample weight
Percentage purity:
Amount present / label claim X 100
5.3 METHOD VALIDATION
The chromatographic conditions were validated by evaluating linearity, accuracy, method and system precision, limit of detection (LOD), limit of quantitation (LOQ) and robustness in accordance with ICH guidelines.
5.3.1 Specificity:
It is evaluated by injecting the blank, placebo and the control sample solution prepared as per the proposed method to check for the interference if any peak at the retention time of Quinapril and Hydrochlorothiazide. Results obtained were shown in Fig. 9 – 10.
5.3.2 Linearity and Range:
Preparation of standard stock solution for Quinapril and Hydrochlorothiazide:
Standard stock solution of pure drugs were prepared separately by dissolving 20 mg of Quinapril with 7 mL diluent into a 10 mL clean dry volumetric flask and make up to 10 ml with mobile phase. Pipette out 1 mL and make up to 10mL to get a final concentration of 200 µg mL-1 (stock solution A). Dissolve 12.5 mg of Hydrochlorothiazide with 7 mL diluent into a 10 mL clean dry volumetric flask and made up to 10 mL (1250 µ g mL-1
) with mobile phase. Pipette out 1 mL (1250 µ g mL-1
) solution and dilute to 10 mL to get a final concentration of 125 µg mL-1 (stock solution B).
Pipette out 0.25 ml of solution from stock solution A and B i.e. 50 µg mL-1 of Quinapril and 31.25 µg mL-1 of Hydrochlorothiazide stock solution respectively was taken in 10 mL of volumetric flask dilute up to the mark with mobile phase.
Preparation of linearity solution (50%):
Pipette out 0.5 mL of solution from stock solution A and B i.e.100 µg mL-1
of Quinapril and 62.5 µg mL-1
of Hydrochlorothiazide stock solution respectively was taken in 10 mL volumetric flask dilute up to the mark with mobile phase.
Preparation of linearity solution (75%):
Pipette out 0.75 mL of solution from stock solution A and B i.e.150 µ g mL-1
of Quinapril and 93.75 µg mL-1
of Hydrochlorothiazide stock solution respectively was taken in 10 mL volumetric flask dilute up to the mark with mobile phase.
Preparation of linearity solution (100%):
Pipette out 1.0 mL of solution from stock solution A and B i.e. 200 µg mL-1
of Quinapril and 125 µg mL-1
of Hydrochlorothiazide stock solution respectively was taken in 10mL volumetric flask dilute up to the mark with mobile phase.
Preparation of linearity solution (125%):
Pipette out 1.25 mL of solution from stock solution A and B i.e. 250 µg mL-1 of Quinapril and 156.25 µg mL-1
of Hydrochlorothiazide stock solution respectively was taken in 10 mL volumetric flask dilute up to the mark with mobile phase.
Preparation of linearity solution (150%):
Pipette out 1.5 mL of solution from stock solution A and B i.e. 300 µg mL-1 of Quinapril and 187.5 µg mL-1 of Hydrochlorothiazide stock solution respectively was taken in 10 mL volumetric flask dilute up to the mark with diluent.
Procedure:
Each level of the above solutions was injected into the chromatographic system and the peak area was measured. A graph was plotted (peak area versus concentration) and the correlation coefficient (r2
) was calculated. Result obtained was shown in Table 9 and chromatograph was shown in Fig 11 - 18
Standard preparation:
Standard stock solution of pure drugs were prepared separately by dissolving 20 mg of Quinapril with 7 mL diluent into a 10 mL clean dry volumetric flask and make up to 10ml with mobile phase. Pipette out 1 mL and make up to 10 mL to get a final concentration of 200 µg mL-1 (stock solution A). Dissolve 12.5 mg of Hydrochlorothiazide with 7 mL diluent into a 10 mL clean dry volumetric flask and made up to 10 mL (1250 µ g mL-1
) with mobile phase. Pipette out 1 mL (1250 µ g mL-1
) solution and dilute to 10 mL to get a final concentration of 125 µg mL-1 (stock solution B).
Preparation of standard solution of Quinapril and Hydrochlorothiazide:
Pipette out 1.0 mL from stock solution A of Quinapril and stock solution B Hydrochlorothiazide were mixed in a 10 mL volumetric flask and made up to volume with mobile phase to get a mixed standard solution containing 200 µ g mL-1
of Quinapril and 125 µg mL-1
of Hydrochlorothiazide. Pipette out 1 mL from standard 1 into 10 mL volumetric flask and make up the volume with mobile phase. Result obtained was shown in Table 10 and chromatogram was shown in Fig 19 – 24.
Procedure: The standard solution was injected for five times and measured the area for all five injections in HPLC. The %RSD was calculated.
5.3.4 Accuracy:
Preparation of standard stock solution for Quinapril and Hydrochlorothiazide:
Standard stock solution of pure drugs were prepared separately by dissolving 20 mg of Quinapril with 7 mL diluent into a 10 mL clean dry volumetric flask and make up to 10ml with mobile phase. Pipette out 1 mL and make up to 10mL to get a final concentration of 200 µg mL-1 (stock solution A). Dissolve 12.5 mg of Hydrochlorothiazide with 7mL diluent into a 10 mL clean dry volumetric flask and made up to 10 mL (1250 µ g mL-1
) with mobile phase. Pipette out 1mL (1250 µg mL-1
) solution and dilute to 10 mL to get a final concentration of 125 µ g mL-1 (stock solution B).
Pipette out 1.0 mL from stock solution A of Quinapril and stock solution B hydrochlorothiazide were mixed in a 10 mL volumetric flask and made up to volume with mobile phase to get a mixed standard solution containing 200 µ g mL-1 of Quinapril and 125 µg mL-1
ofHydrochlorothiazide as final concentration. Preparation of solution (50%):
Accurately weighed and transferred 0.25 mg of quinapril and 0.25 mg of hydrochlorothiazide working standard into a 10 mL clean dry volumetric flask, add 70 mL of diluent, sonicated for 25 minutes and make up to the final volume with diluents further the volume made up with diluent and filtered.
From the filtered solution about 2 mL of Quinapril and Hydrochlorothiazide was pippetted out into a 10 mL volumetric flask and made up to 10 mL with diluent. The solution was sonicated for 25 min and filtered. Same procedure was repeated for three times. Results observed were shown in Table 12-13 and chromatogram was shown in Fig 25 – 27.
Preparation of solution (100%):
Accurately weighed and transferred 0.5 mg of quinapril and 0.5 mg of hydrochlorothiazide working standard into a 10 mL clean dry volumetric flask, add 70 mL of diluent, sonicated for 25 minutes and make up to the final volume with diluents further the volume made up with diluent and filtered.
From the filtered solution about 2 mL of Quinapril and Hydrochlorothiazide was pipette out into a 10 mL volumetric flask and made up to 10 mL with diluent. The solution was sonicated for 25 min and filtered. Same procedure was repeated for three times. Results observed were shown in Table 12- 13 and chromatogram was shown in Fig 28 - 30
Preparation of solution (150%):
Accurately weighed and transferred 0.75 mg of quinapril and 0.75 mg of hydrochlorothiazide working standard into a 10 mL clean dry volumetric flask, add 7 mL of diluent , sonicated for 5 minutes and make up to the final volume with diluents further the volume made up with diluent and filtered.
Procedure:
The standard solution was injected in triplicate for Accuracy-50%, Accuracy-100% and Accuracy-150% solutions.
Calculate the amount found and Amount added for Quinapril & Hydrochlorothiazide and calculate the individual recovery and mean recovery values.
Sample peak area x weight of standard % Recovery = X 100
Standard peak area x weight of sample
5.3.5 Intermediate precision (Ruggedness):
Ruggedness is the degree of reproducibility of results obtained by the analysis of the same sample under a variety of normal test conditions i.e, different analysts, laboratories, instruments, reagents, assay temperatures, small variations in mobile phase, different days etc. (i.e. from laboratory to laboratory, from analyst to analyst). Acceptance criteria for ruggedness, the %RSD for the area of five standard injections should not be more than 2%.
Standard preparation:
Preparation of standard stock solution for Quinapril and Hydrochlorothiazide:
Standard stock solution of pure drugs were prepared separately by dissolving 20 mg of Quinapril with 7 mL diluent into a 10 mL clean dry volumetric flask and make up to 10 ml with mobile phase. Pipette out 1 mL and make up to 10mL to get a final concentration of 200 µg mL-1 (stock solution A). Dissolve 12.5 mg of Hydrochlorothiazide with 7 mL diluent into a 10 mL clean dry volumetric flask and made up to 10 mL (1250 µ g mL-1
) with mobile phase. Pipette out 1 mL (1250 µ g mL-1
) solution and dilute to 10 mL to get a final concentration of 125 µg mL-1 (stock solution B).
Preparation of standard solution of Quinapril and Hydrochlorothiazide:
Pipette out 1.0 mL from stock solution A of Quinapril and stock solution B hydrochlorothiazide were mixed in a 10 mL volumetric flask and made up to volume with mobile phase to get a mixed standard solution containing 200 µ g mL-1
mL-1 ofHydrochlorothiazide as final concentration. Result obtained was shown in Table 14 and chromatogram was shown in Fig 33 – 39.
5.3.6 Robustness:
As part of robustness, deliberate change in the flow rate and mobile phase composition was made to evaluate the impact on the method. The mixed standard solution is injected in two replicates and %RSD was calculated. Result obtained was shown in Table 15 - 18 and chromatogram was shown in Fig 40 – 47.
5.3.7 LOD and LOQ:
LOD is the smallest concentration of the analyte that gives measurable response (signal to noise ratio of 3). The LOQ is the smallest concentration of the analyte which gives response that can be accurately quantified (signal to noise ratio of 10). Results obtained were shown in Table 19 and chromatogram was shown in Fig 48 – 49.
Calculation:
LOD and LOQ of Quinapril and Hydrochlorothiazide were determined by using instrumental method. LOD and LOQ were calculated by the following formula:
LOD = S/N LOQ = S/N
RESULTS & DISCUSSION
6. RESULTS AND DISCUSSION 6.1 METHOD DEVELOPMENT:
6.1.1 Selection of wavelength:
The isobestic point was found at 210nm with characteristic peak as shown in the Fig. 1 and was selected UV-Visible detector in HPLC analysis of Quinapril and Hydrochlorothiazide.
Fig. 1: Isobestic point of Quinapril and Hydrochlorothiazide
6.1.2 DEVELOPMENT TRAILS: Selection of flow rate:
The flow rate was changed from 0.8-1.2 mL min-1
and the chromatogram was developed. The drugs eluted with small differences in fronting and tailing except at 1.2 mL min-1
and it was selected for analysis.
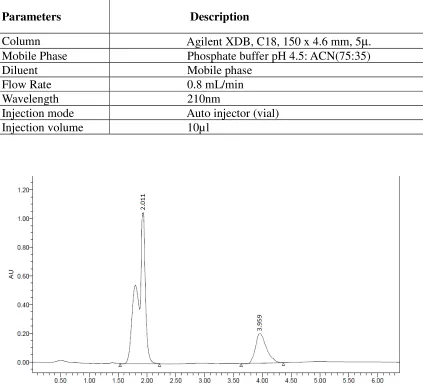
[image:41.612.90.466.70.388.2]Trial-1
Table No. 1: Chromatographic condition
Parameters Description
Column Agilent XDB, C18, 150 x 4.6 mm, 5°. Mobile Phase Phosphate buffer pH 4.5: ACN (75:25) Diluent Mobile phase
Injection mode Auto injector (vial) Injection volume 10µl
Fig 2: Chromatogram of HCTZ and QUINAPRIL Observation
QUINAPRIL was eluted properly but HCTZ was not eluted. So the mobile phase has been changed for next trial.
Trial-2
Fig 3: Chromatogram of HCTZ and QUINAPRIL Observation
Both HCTZ and QUINAPRIL were eluted properly, but they are not sharp. So the mobile phase has been changed for next trial.
Parameters Description
Column Agilent XDB, C18, 150 x 4.6 mm, 5µ.
Mobile Phase Phosphate buffer pH 4.5: ACN(70:30)
Diluent Mobile phase
Flow Rate 0.8mL/min
Wavelength 210nm
Injection mode Auto injector (vial)
Trial-3
Table No. 3: Chromatographic condition
Parameters Description
Column Agilent XDB, C18, 150 x 4.6 mm, 5µ. Mobile Phase Phosphate buffer pH 4.5: ACN(75:35) Diluent Mobile phase
Flow Rate 0.8 mL/min Wavelength 210nm
Injection mode Auto injector (vial) Injection volume 10µl
Fig 4: Chromatogram of HCTZ and QUINAPRIL
Observation
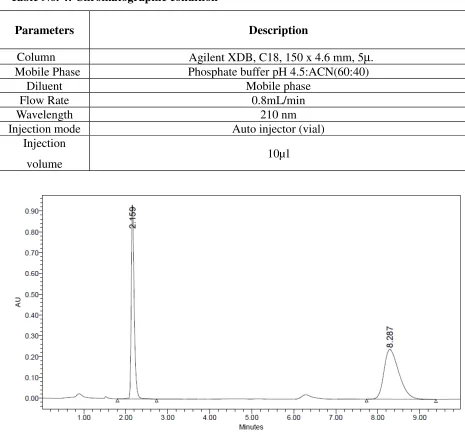
Trial-4
Table No. 4: Chromatographic condition
Parameters Description
Column Agilent XDB, C18, 150 x 4.6 mm, 5µ. Mobile Phase Phosphate buffer pH 4.5:ACN(60:40)
Diluent Mobile phase
Flow Rate 0.8mL/min
Wavelength 210 nm
Injection mode Auto injector (vial)
Injection
volume 10µl
Fig 5: Chromatogram of HCTZ and QUINAPRIL
Observation
QUINAPRIL run time was found to be more and theoretical plates was not within the limit. So the flow rate was changed for next trial.
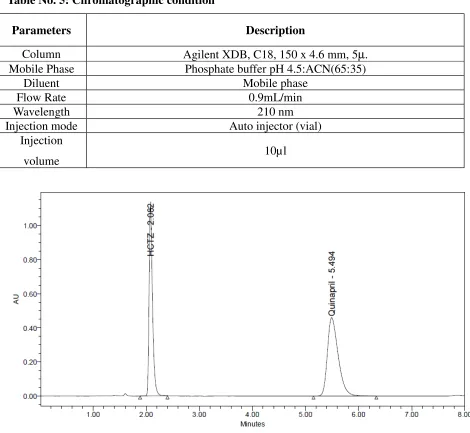
Trial-5
Table No. 5: Chromatographic condition
Parameters Description
Column Agilent XDB, C18, 150 x 4.6 mm, 5µ. Mobile Phase Phosphate buffer pH 4.5:ACN(65:35)
Diluent Mobile phase
Flow Rate 0.9mL/min
Wavelength 210 nm
Injection mode Auto injector (vial)
Injection
volume 10µl
Fig 6: Chromatogram of HCTZ and QUINAPRIL
Observation
Resolution, theoretical plates and symmetric factor were found to be within the limit. So this method was finalized as the optimized method.
ASSAY:
Assay determines the content of specific components such as Quinapril and Hydrochlorothiazide in the given formulation (Accupril) by means of measuring the peak area values of the standard and sample. The calculation was shown below by substituting the values in the following formula.
S. No
Standard
Hydrochlorothiazide Quinapril
1 4940155 6445231
2 4937371 6436697
3 4905375 6447105
[image:47.612.59.543.312.468.2]Avg 4927633 6443011
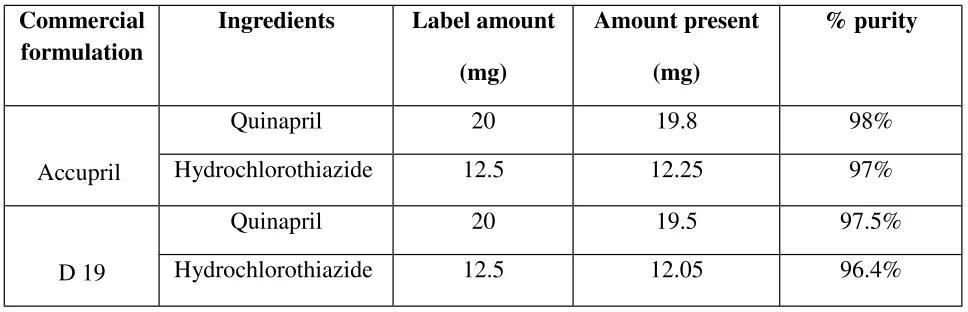
Table 7: Marketed formulations. Commercial
formulation
Ingredients Label amount (mg)
Amount present (mg)
% purity
Accupril
Quinapril 20 19.8 98%
Hydrochlorothiazide 12.5 12.25 97%
D 19
Quinapril 20 19.5 97.5%
[image:47.612.60.545.506.602.2]Hydrochlorothiazide 12.5 12.05 96.4%
Table 8: Assay data for tablets of Quinapril and Hydrochlorothiazide
S.No
Sample
Hydrochlorothiazide Quinapril
1 4947356 6349954
2 4936963 6364801
3 4942884 6363923
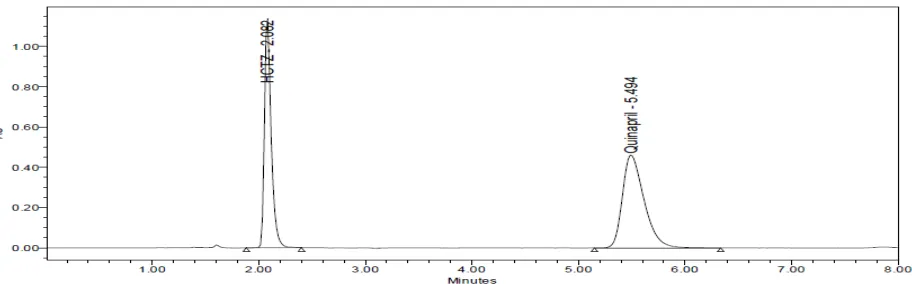
Fig. 7: Standard chromatogram of Quinapril and Hydrochlorothiazide
Fig.8: Chromatogram of marketed formulation of Quinapril and Hydrochlorothiazide Calculation:
Formula:
Amount present:
Sample area X standard weight
[image:48.612.93.524.357.547.2]Percentage purity:
Amount present/label claim X 100
6.2. METHOD VALIDATION 6.2.1 Specificity:
Specificity is the ability to assess unequivalently the analyte in the presence of components, which may be expected to be present. Typically these might include impurities, matrix, degradants etc. It is evaluated by injecting the blank and the control sample solution prepared as per the proposed method to check for the interference if any peak at the retention time of Hydrochlorothiazide and Quinapril.
The specificity of the HPLC method was complete separation of Hydrochlorothiazide and Quinapril was noticed in presence of tablet excipients. In addition there was no interference at the retention time of Hydrochlorothiazide and Quinapril in the chromatogram of placebo solution.
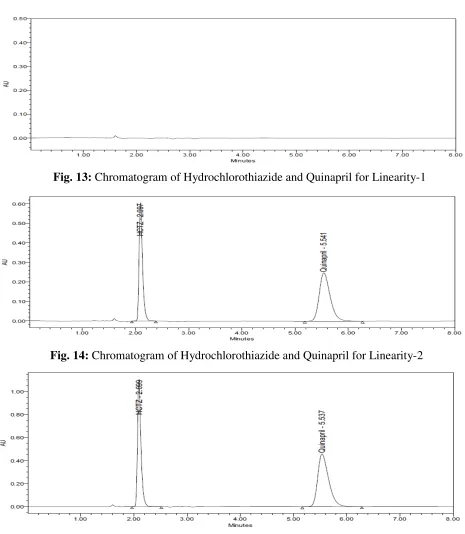
Fig 10: Chromatogram of marketed formulation of Hydrochlorothiazide and Quinapril 6.2.2 Linearity:
[image:50.612.80.536.72.214.2]Linearity is determined by calculating the regression line using a mathematical treatment of the results (i.e. least mean squares) vs. analyte concentration. The range of the method is the interval between the upper and lower levels of an analyte that have been determined with acceptable precision, accuracy and linearity. It is determined on either a linear or nonlinear response curve (i.e. where more than one range is involved) and is normally expressed in the same units as the test results.
Table 9:
S.No Hydrochlorothiazide Quinapril
Conc. (µg mL-1
) Area Conc. (µg mL-1
) Area
1 31.25 1380726 50 1652079
2 62.5 2644058 100 3328244
3 93.75 4021937 150 5048620
4 125 5258825 200 6637747
5 156.25 6607297 250 8283624
Fig. 11: Calibration graph of Hyrochlorothiazide
Fig. 13: Chromatogram of Hydrochlorothiazide and Quinapril for Linearity-1
Fig. 14: Chromatogram of Hydrochlorothiazide and Quinapril for Linearity-2
[image:52.612.76.541.57.591.2]Fig. 16: Chromatogram of Hydrochlorothiazide and Quinapril for Linearity-4
Fig. 17: Chromatogram of Hydrochlorothiazide and Quinapril for Linearity-5
Fig. 18: Chromatogram of Hydrochlorothiazide and Quinapril for Linearity-6 Acceptance criteria: linear when correlation coefficient is 0.999
Result :
The relationship between the concentration of Hydrochlorothiazide and Quinapril was linear in the specific range and the correlation coefficient was found to be within the limit. The correlation coefficient of Hydrochlorothiazide and Quinapril was found to be 0.999 and 0.999.
The precision of an analytical method is the degree of agreement among individual test results obtained when the method is applied to multiple sampling of a homogenous sample. Precision is a measure of the reproducibility of the whole analytical method (including sampling, sample preparation and analysis) under normal circumstances. Precision is determined by using the method to assay a sample for a sufficient number of times to obtain statistically valid results. The precision is then expressed as the relative standard deviation.
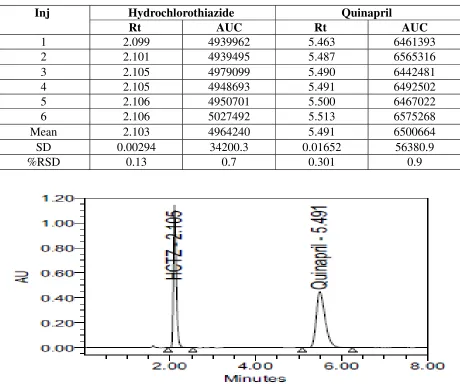
Table 10: Method precision:
Inj Hydrochlorothiazide Quinapril
Rt AUC Rt AUC
1 2.099 4939962 5.463 6461393
2 2.101 4939495 5.487 6565316
3 2.105 4979099 5.490 6442481
4 2.105 4948693 5.491 6492502
5 2.106 4950701 5.500 6467022
6 2.106 5027492 5.513 6575268
Mean 2.103 4964240 5.491 6500664
SD 0.00294 34200.3 0.01652 56380.9
%RSD 0.13 0.7 0.301 0.9
Fig. 20: Chromatogram of Hydrochlorothiazide and Quinapril for method precision - 2
Fig. 21: Chromatogram of Hydrochlorothiazide and Quinapril for method precision - 3
Fig. 23: Chromatogram of Hydrochlorothiazide and Quinapril for method precision - 5
Fig. 24: Chromatogram of Hydrochlorothiazide and Quinapril for method precision – 6 Acceptance criteria: % RSD of the sample replicates should not be more than 2.
Result:
In the present study, the % RSD for Hydrochlorothiazide and Quinapril was found to be 0.7 and 0.9 respectively. The % RSD value indicates good degree of precision within the specified range. 6.2.4 System suitability parameters:
Table 11: System suitability parameters
S. No Parameters Hydrochlorothiazide Quinapril
1 Theoretical plates 5136 3516
2 Symmetric factor 1.5 1.7
3 Resolution 6.9 6.3
Acceptance criteria: Theoretical plate’s ≥ 2000, symmetric factor ≤ 2.
Result: From the above table it was concluded that result obtained was within the limit.
6.2.5 Accuracy:
Accuracy is a measure of the closeness of test results obtained by a method to the true value. Accuracy indicates the deviation between the mean value found and the true value. It was done by recovery study. The test solutions were prepared by spiking at about 50%, 100%, and 150% of specification limit to placebo and analyzed by the proposed HPLC method. The percentage and percentage relative standard deviation of the recovery were calculated and shown in Table 11 -12 and Fig. 25-33.
Table-12
AMOUNT OF SPIKED
ACCURACY FOR HYDROCHLOROTHIAZIDE
Peak Area Amount of added (mg) Amount recovered (mg) % Recovery Average recovery % RSD 50%
2440388 6.25 6.18 99.00218
99.72 0.73
2476269 6.25 6.27 100.4578
2457425 6.25 6.23 99.69335
100%
4946928 12.5 12.54 100.344 100.823 0.42
[image:57.612.65.547.509.700.2]4978885 12.5 12.62 100.9922
150%
7463555 18.75 18.92 100.9277
100.814 0.61
7495944 18.75 19 101.3657
[image:58.612.69.546.72.552.2]7405940 18.75 18.77 100.1486
Table : 13
AMOUNT OF SPIKED
ACCURACY FOR QUINAPRIL
Peak Area Amount of added (mg) Amount recovered (mg) % Recovery Average recovery % RSD 50%
3275013 10 10.89 100.8947 100.9286 0.65
3297815 10 10.15 101.5972
3255511 10 10.02 100.2939
100%
6526276 20 20.14 100.5289 100.82 0.47
6580356 20 20.27 101.3619
6528315 20 20.11 100.5603
150%
9859133 30 30.37 101.2448 101.11 0.12
9843137 30 30.32 101.0806
[image:58.612.86.530.426.592.2]9835361 30 30.3 101.0007