Development and Validation of RP-HPLC Method for the Simultaneous Estimation of Paracetamol and Tramadol Hydrochloride in Tablet Dosage Form
10
0
0
Full text
(2) 93 K.Shivaramakrishna et al / Int. J. of Pharmacy and Analytical Research Vol-3(1) 2014 [92-101]. many reported methods for analysis of tramadol9-13 or paracetamol14-17 either alone or in combination with other drugs18-20 in pharmaceutical dosage forms. Very few reports are there on simultaneous estimation of paracetamol and tramadol. They were determined in human plasma samples using liquid chromatography (LC-MS)21-22. In tablets they were estimated using spectrophotometry23-24, HPTLC25-. 26. , GC-MS27 and HPLC27-30 methods. Till date, to the best of our knowledge, Two method has been reported in the literature. This manuscript describes the development and validation, in accordance with ICH guidelines, of rapid, economical, precise and accurate isocratic reversed-phase HPLC method for analysis of paracetamol and tramadolHCl in table dosage form. Figure-1 Paracetamol. Figure-2 Tramadol HCl. MATERIALS AND METHODS Chemicals. Instruments. paracetamol and tramadolHCl obtained from Bio Leo.lab.Pvt.Ltd, Hyderabad, as a gift samples. Potassium dihydrogen orthophosphate & Dipotassium hydrogen orthophosphate (AR Grade), ortho-phosphoric acid (AR Grade), Acetonitrile (HPLC Grade), were purchased from Merck (India) Ltd., Worli, Mumbai, India. Tablet formulation (Altracet) was purchased from local market, containing par acetamol (325 mg), tramadol HCl(37.5 mg). Double distilled water was used throughout the experiment.. Waters HPLC 2 2695 series consisting 4 pump. Auto sampler with 5 racks, each rack has 24 vials holding capacity with temperature control. Auto injector has capacity to inject 5µL to 500µL. UVVis Detector with PDA. Thermostat column compartment connected it has a capacity to maintain 5°C to 60°C column temperature. Waters (alliance) HPLC System is equipped with Empower-2 software.. ANALYTICAL METHOD DEVELOPMENT. Optimization of UV conditions. Figure-3 Isobestic point of paracetamol and tramadol HCl rate of 0.8 mL min-1 with run time of 8min. Chromatographic Conditions Mobile phase and sample solutions were filtered A waters symmetry C-18 column (150 mm x 4.6 through a 0.45 μm membrane filter and degassed. mm i.d., 5-μm) was used for chromatographic The detection of both drugs was carried out at 268 separation. The mobile phase composed of nm. Acetonitrile and mixed phosphate buffer (60:40 v/v); pH adjusted to 3.5 with trietalamine at a flow Figure-4 Optimized Chromatogram. www.ijpar.com.
(3) 94 K.Shivaramakrishna et al / Int. J. of Pharmacy and Analytical Research Vol-3(1) 2014 [92-101]. Fig: 4 Optimized Chromotogram. METHODOLOGY Mobile phase preparation Buffer preparation. Precision. 0.01 M Potassium dihydrogen orthophosphate adjust pH to 3.5 with triethylamine. Mix buffer and Acetonitrile at 60 : 40 ratio sonicate the resulting solution and degass it using vacuum filtration through 0.4 micron membrane filter.. The system precision of the method was verified by six replicate injections of standard solution containing paracetamol and tramadol HCl. The method precision ws carried out the analyte six times using the proposed method. Repeatability was measured by multiple injections of a homogenous sample of paracetamol and tramadol HCl.. Standard stock solution preparation Weigh and transfer 500 mg of Paracetamol working standard and 50 mg of Tramadol working standard into 200 mL volumetric flask, add 50 mL of diluent and sonicate to dissolve and dilute to volume with diluent.. Standard preparation Transfer 10 mL of standard stock solution into 100 mL volumetric flask and dilute to volume with diluent.. Sample Preparation Finely grind pre weighed 20 tablets. Transfer grinded sample quantitatively equivalent to 500 mg of Paracetamol and 50 mg of Tramadol in to 200 mL volumetric flask add 50 mL of diluent, sonicate to dissolve for 10 minutes and dilute to volume with diluent. Further filter the solution through filter paper. Dilute 10 ml of filtrate to 100 ml with mobile phase. Procedure Inject 20 µL of blank solution, placebo solution, Standard solution, Disregard peaks due to blank and placebo if any.. Accuracy Accuracy was carried out by % recovery studies at three different concentration levels. To the preanalyzed sample solution of paracetamol and tramadol HCl; a known amount of standard drug powder of paracetamol and tramadol HCl were added at 80, 100 and 120 % level.. Specificity and Selectivity Specificity of the method was determined through study of resolution factor of drug peak from the nearest resolving peak. Specificity is a procedure to detect quantitatively the analyte in presence of component that may be expected to be present in the sample matrix, while selectivity is the procedure to detect qualitatively the analyte in presence of components that may be expected to be present in the sample matrix.. Limit of detection and Limit of quantitation Sensitivity of the proposed method was estimated in terms of Limit of Detection (LOD) and Limit of Quantitation (LOQ). LOD = 3.3 x ASD/S and LOQ = 10 x ASD/S, Where, ‘ASD’ is the average standard deviation and ‘S’ is the slope of the line.. Robustness VALIDATION OF METHOD The HPLC method was validated in accordance with ICH guidelines.. Robustness was evaluated by making deliberate variations in few method parameters such as variation of wave length; flow rate and change in mobile phase. www.ijpar.com.
(4) 95 K.Shivaramakrishna et al / Int. J. of Pharmacy and Analytical Research Vol-3(1) 2014 [92-101]. composition. The robustness of the method was studied for paracetamol and tramadol HCl. obtained for both drugs when the pH of the mobile phase (buffer) was adjusted to 3.5. The flow rate of the mobile phase was 0.8 mL min-1. Under optimum chromatographic conditions, the retention time for paracetamol and tramadol HCl was found to be 2.250 and 3.378 min, respectively when the detection was carried out at 268 nm. A typical chromatogram of two drugs is shown in (Figure 3).. RESULTS AND DISCUSSION Selection of Chromatographic Conditions and Optimization of Mobile Phase Mobile phase was optimized to separate paracetamol and tramadol HCl using Symmetry C-18 column (150 mm x 4.6 mm i.d., 5μm). Initially, ACN and phosphate buffer in the ratio of (60:40) were tried as mobile phase but the splitting of the peaks for both these drugs was observed. Therefore, after adjustment of pH of mixed phosphate buffer to 3.5 with Triethyle amine, and mobile phase composition (ACN and phosphate buffer in 60:40 % v/v) was tried for resolution of both drugs. Good resolution and symmetric peaks were. LINEARITY DATA The Linear detector response for Paracetamol and Tramadol hydrochloride is demonstrated by concentration versus Area. Over the range of 25 to 150% with respect to the target concentration (Dosage).. Table-1 For Peak Area of Paracetamol %. Conc(mcg). Area. 25. 62.500. 456678. 50. 125.000. 937710. 75. 187.500. 1390513. 100. 250.000. 1858978. 125. 312.500. 2312992. 150. 375.000. 2781544. Figure- 5 Calibration curve for Paracetamol. Area under curve. LINEARITY OF PARACETMOL 3000000 2500000 2000000 1500000 1000000 500000 0. 2781544 y = 18662x - 16062 2312992 R² = 0.9999 1858978 1390513 900710 456678 0. 50. 100. 150. Concentration(%). Table-2 For Peak Area of Tramadol hydrochloride %. Conc(mcg). Area. 25. 6.25. 106154. 50. 12.50. 217752. 75. 18.75. 322674. 100. 25.00. 431677. 125. 31.25. 537365. 150. 37.50. 647178. www.ijpar.com. 200.
(5) 96 K.Shivaramakrishna et al / Int. J. of Pharmacy and Analytical Research Vol-3(1) 2014 [92-101]. Figure-6 Calibration curve for Tramadol hydrochloride. Area under curve. LINEARITY OF TRAMADOL 700000 600000 500000 400000 300000 200000 100000 0. y = 4312x - 162.87 R² = 0.9999. 0. 50. 100. 150. 200. Concentration(%). Table-3 PRECISION S No. Name. Paracetamol. Tramadol HCL. 1. S-Precision-1. RT 2.251. Area 1851720. RT 3.384. Area 429022. 2. S-Precision-2. 2.251. 1872084. 3.378. 433645. 3. S-Precision-3. 2.252. 1888269. 3.376. 436348. 4. S-Precision-4. 2.251. 1876113. 3.372. 433992. 5. S-Precision-5. 2.252. 1898421. 3.371. 438659. 6. S-Precision-6. 2.249. 1898764. 3.365. 438738. Average. 2.251. 1880895. 3.374. 435067. Standard Deviation. 0.0011. 18069.4. 0.007. 3680.74. RSD. 0.0487. 0.961. 0.19. 0.85. Table-4 Method Precision S No. Name. Paracetamol. Tramadol HC. 1. M-Precision-1. RT 2.253. Area 1844884. RT 3.381. Area 428605. 2. M-Precision-2. 2.252. 1859494. 3.379. 431560. 3. M-Precision-3. 2.251. 1880747. 3.380. 434968. 4. M-Precision-4. 2.251. 1866063. 3.376. 433370. 5. M-Precision-5. 2.250. 1886423. 3.375. 437676. 6. M-Precision-6. 2.252. 1885501. 3.372. 437554. Average. 2.252. 1870519. 3.377. 433956. Standard Deviation. 0.0010. 16616.7. 0.003. 3536.26. RSD. 0.0466. 0.888. 0.102. 0.815. www.ijpar.com.
(6) 97 K.Shivaramakrishna et al / Int. J. of Pharmacy and Analytical Research Vol-3(1) 2014 [92-101]. Table-4 System Precision & Method Precision S No. Name. Paracetamol. Tramadol HCL. 1. S-Precision-1. RT 2.251. Area 1851720. RT 3.384. Area 429022. 2. S-Precision-2. 2.251. 1872084. 3.378. 433645. 3. S-Precision-3. 2.252. 1888269. 3.376. 436348. 4. S-Precision-4. 2.251. 1876113. 3.372. 433992. 5. S-Precision-5. 2.252. 1898421. 3.371. 438659. 6. S-Precision-6. 2.249. 1898764. 3.365. 438738. 7. M-Precision-1. 2.253. 1844884. 3.381. 428605. 8. M-Precision-2. 2.252. 1859494. 3.379. 431560. 9. M-Precision-3. 2.251. 1880747. 3.380. 434968. 10. M-Precision-4. 2.251. 1866063. 3.376. 433370. 11. M-Precision-5. 2.250. 1886423. 3.375. 437676. 12. M-Precision-6. 2.252. 1885501. 3.372. 437554. Average. 2.251. 1875707. 3.376. 434511. Standard Deviation. 0.001. 17414.999. 0.005. 3489.901. % RSD. 0.047. 0.928. 0.154. 0.803. Result. Acceptance criteria. System and Method precision. The % of RSD for Area and RT from Repeated injections should not be more than 2.0%.. Paracetamol % of RSD for RT Area. = =. ACCURACY. 0.047% 0.928%. The accuracy of the test method is demonstrated by % of recovery. The sample preparations are spiked with known amount of standard at three concentration levels and injected three times (Like 80% 100% and 120%).. Tramadol HCL % of RSD for. RT Area. = =. 0.154% 0.803%. Accuracy data. Table-5 Standard area S No. Paracetamol. Tramadol HCL. 1. Area 1858978. Area 431677. 2 Avg. 1855741 1857360. 431265 431471. Table-6 Placebo S No. Paracetamol. Tramadol HCL. 1 2 Avg. Area 0 0 0. Area 0 0 0. www.ijpar.com.
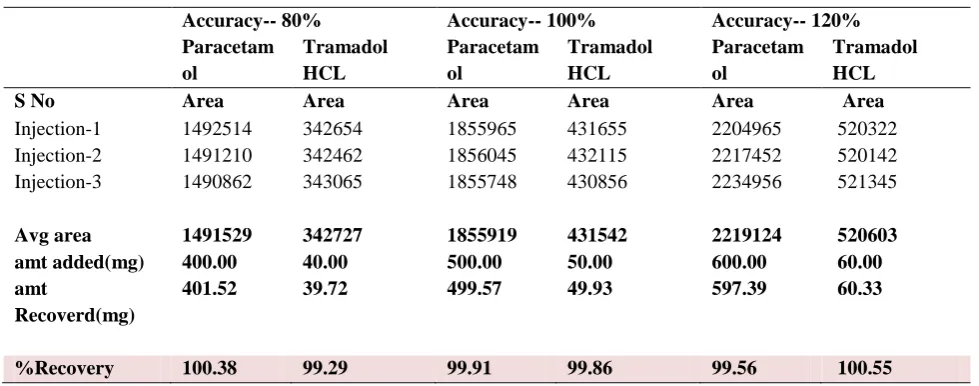
(7) 98 K.Shivaramakrishna et al / Int. J. of Pharmacy and Analytical Research Vol-3(1) 2014 [92-101]. Table -7 Accuracy for Paracetamol and Tramadol hydrochloride Accuracy-- 80% Paracetam Tramadol ol HCL Area Area 1492514 342654 1491210 342462 1490862 343065. Accuracy-- 100% Paracetam Tramadol ol HCL Area Area 1855965 431655 1856045 432115 1855748 430856. Accuracy-- 120% Paracetam Tramadol ol HCL Area Area 2204965 520322 2217452 520142 2234956 521345. Avg area amt added(mg) amt Recoverd(mg). 1491529 400.00 401.52. 342727 40.00 39.72. 1855919 500.00 499.57. 431542 50.00 49.93. 2219124 600.00 597.39. 520603 60.00 60.33. %Recovery. 100.38. 99.29. 99.91. 99.86. 99.56. 100.55. S No Injection-1 Injection-2 Injection-3. Results (% Of Recovery) Paracetamol : At 80% = 100.38 % At 100% = 99.91 % At 120% = 99.56 % Tramadol HCL : At 80% = 99.29 % At 100% = 99.86% At 120% = 100.55 %. Acceptance criteria The % of recovery should be between 98 to 102%.. LIMIT OF DETECTION (LOD) S.NO. Table-8 Limit Of detection results. Name LOD Value (µg/ml). 1.. Paracetamol. 1.8704. 2.. Tramadol hydrochloride. 1.254. Table-9 Limit of Quantitation (LOQ)results. S.NO Name LOQ Value( µg/ml) 1. Paracetamol 5.6679 2.. Tramadol hydrochloride. ROBUSTNESS Robustness for Paracetamol and Tramadol hydrochloride. The robustness of test method is. 3.8008. demonstrated by carrying out intentional method variations like mobile phase flow changes, mobile phase compositions and column oven temperature variations etc.... www.ijpar.com.
(8) 99 K.Shivaramakrishna et al / Int. J. of Pharmacy and Analytical Research Vol-3(1) 2014 [92-101]. Table-10 Robustness for Paracetamol and Tramadol hydrochloride S No. Tramadol HCL. RT. Area. RT. Area. 1. Standard. 2.251. 1875707. 3.376. 434511. 2. Robustness-MP-Flow Change-1. 2.036. 1708651. 3.030. 395193. 3. Robustness-MP-Flow Change-2. 2.517. 2145545. 3.756. 495949. 4. Robustness-Column Oven Temperature-1. 2.238. 1916291. 3.570. 443878. 5. Robustness-Column Oven Temperature-2. 2.323. 1351173. 3.146. 181897. The results are mentioned below Paracetamol Flow1 = 2.036 min Flow2 = 2.517 min Temp-1 = 2.238 min Temp-2 = 2.323 min. Standard preparation Transfer 10 ml of standard stock solution in to 100 mL volumetric flask and make up to volume with diluent.. Sample Preparation. Tramadol HCL Flow1 Flow2 Temp-1 Temp-2. Paracetamol. = = = =. Transfer sample quantitatively equivalent to 500 mg of Paracetamol and 50 mg of Tramadol in to 200 mL volumetric flask add 50 mL of diluent, sonicate to dissolve for 10 minutes and dilute to volume with diluent. Further filter the solution through filter paper. Dilute 10 ml of filtrate to 50 ml with mobile phase.. 3.030 min 3.756 min 3.570 min 3.146 min. Acceptance criteria The result should show some variation from standard results.. Procedure Inject 20 µL of blank solution, standard solution, and sample solution record the chromatogram. And calculate percentage of assay.. ASSAY Assay for Paracetamol and Tramadol hydrochloride. Table-11 Paracetamol Tramadol HCL. 500-mg 50-mg. Avg wt. 850-mg Table-12 Paracetamol. Tramadol HCL. S No. Name. RT. Area. RT. Area. 1. Standard-1. 2.252. 1869495. 3.380. 431562. 2. Standard-2. 2.254. 1880747. 3.382. 434968. 2.253. 1875121. 3.381. 433265. Avg 3. Sample-1. 2.253. 1865425. 3.378. 430662. 4. Sample-2. 2.250. 1880655. 3.381. 431265. 2.252. 1873040. 3.380. 430964. Avg.
(9) 100 K.Shivaramakrishna et al / Int. J. of Pharmacy and Analytical Research Vol-3(1) 2014 [92-101]. Table-13 Results for Paracetamol 200 100 99.93 850 mg/Tab. 1873040. 500. 10. 1875121. 200. 100. 850. 10. 100. 430964. Table- 14 Results for Tramadol hydrochloride 50 10 200 100 99.84 850 mg/tab. 433265. 200. 100. 850. 10. 100. Assays result Paracetamol Tramadol HCL. 499.45. 49.73. %Assay 99.89. %Assay 99.47. SYSTEM SUITABILITY PARAMETERS = =. 99.89 % 99.47 %. Table-15 System suitability parameters results for Paracetamol and Tramadol hydrochloride. Results Parameters Tailing factor Theoretical plates per column Resolution. 1.14. Tramadol hydrochloride 1.10. 3621. 5322. Paracetamol. 6.24. CONCLUSION. ACKNOWLEDGEMENT. The developed RP-HPLC method is simple, precise, accurate, selective and reproducible. The method has been found to be adequately rugged and robust and can be used for simultaneous determination of Paracetamol and Tramadol hydrochloride in tablet formulation. The method was validated as per ICH guidelines.. The authors are thankful to Bio Leo lab.Pvt.Ltd, Hyderabad for providing a gift samples, the authors are also thankful to Department of pharmaceutical analysis, Smt. Sarojini Ramulamma college of pharmacy, Palamuru University, Mahaboobnagar, Andhra Pradesh for encouragement. REFERENCES [1] Singh S, Singh B, Bahuguna R, Wadhwal L and Saxena R, J. Pharma Biomed. Anal., 2006, 41, 10371040. [2] Mohammadi A, Haririan I, Rezanour N, Ghiasi L and Walker R B, J. Chromatogr. A, 2006, 1116, 153157. [3] Ivana I, Ljiljana Z and Mira Z, J Chromatogr. A, 2006, 1119, 209-215. [4] International Conference on Harmonization, Q1A (R2) Stability Testing of New Drug Substances and Products International Conference on Hormonization, IFPMA, Geneva, 2003. [5] Satoskar R S, Bandarkar S D and Ainapare S S, Pharmacology and Pharmacotherapeutics., 16th ed., Popular prakashan, Mumbai, 1999, 164. [6] Indian Pharmacopoeia Vol III. Published by The Indian pharmacopoeia commission, Ghaziabad, 2007, 1516. [7] Grosa G, Grosso E D, Russo R and Allegrone G, J. Pharma Biomed. Anal., 2006, 41, 798-803. [8] Lintz W., Barth H, Osterloh G and Schmidt-Bothelt E, Drug Res., 1998, 48, 889-899. [9] Krzek J and Starek M, Biomed. Chromatogr., 2004, 18, 589-599. [10] Kartinasari W F, Palupi T and Indrayanto G, J. Liq. Chromatogr. Related Tech., 27, 2004, 737-744. [11] Wiwin F K, Tini P and Gunawan I, J. Liq. Chromatogr. Related Tech., 2005, 27, 737-744.. www.ijpar.com.
(10) 101 K.Shivaramakrishna et al / Int. J. of Pharmacy and Analytical Research Vol-3(1) 2014 [92-101]. [12] Yalda H A, Faezeh S H, Aboul-Enein Y and Alireza F, J. Chromatogr. B, 2006, 830, 207-211. [13] Rajasekhar K K, Shankarananth V, Jyosthna P, Chowdary S P and Reddy D P, J. Pharm. Res., 2011, 4, 386-387. [14] Morelli B and Gowda K, J. Pharm Biomed Anal., 1989, 7, 577-584. [15] Lau G S N and Critchley J A J H, J. Pharm. Biomed. Anal., 1994, 12, 1563-1572. 16. Bosch M E, Ruiz Sanchez A J, Sanchez Rojas F and Bosch Ojeda C, J. Pharm. Biomed. Anal., 2006, 42, 291-321. [16] Lakshminarayan K V, Ind. J. Pharm. Sci., 2007, 69, 147-149. [17] Sawant R, Bhangale L, Josh R and Lanke P, J. Chem. Metrol., 2010, 4, 21-27. [18] Gharge D, and Dhabale P, Int. J. Chem. Anal. Sci., 2010, 1, 58-61. [19] Srinivasan K K, Alex J, Shirwaikar A A, Jacob S, Sunil Kumar M R and Prabu S L, Indian J. Pharm. Sci., 2007, 69, 540-545. [20] Zhu T, Ding L, Guo X, Yang L and Wen A, Chromatographia, 2007, 66, 171-178. [21] Tan Z, Ouyang D, Zhou G, Wang L, Li Z, Wang D, Chen G, Huang S, Liu Y, Hu D and Zhou H, Yaowu Fenxi Zazhi, 2005, 25, 795-798. [22] Li Y, Wan X, Wang G and Cui J, Zhongguo Yaoxue Zazhi (Beijing, China), 2006, 41, 1594-1595. [23] Narayan S, Kumar P, Sindhu R K, Tiwari A and Ghosh M, Der Pharma Chemica, 2009, 1, 72-78. [24] Mary Titus J F, Thenmozhi A, Sridharan D and Palanivelu M, Int. J. Pharma Recent Res. 2009, 1, 2226. [25] Sam Soloman W D, Vijai Anand P R, Shukla R, Sivakumar R and Venkatnarayanan R, Int. J. Chem. Tech. Res. 2010, 2 [26] Belal T, Awad T and Clark C R, J. Chromatogr. Sci., 2009, 47, 849-854. [27] Liu X, Shi J, Liu Y and He Z, Shenyang Yaoke Daxue Xuebao, 2004, 21, 111-113. [28] Birajdar A S, Meyyanathan S N and Suresh B, Int. J. Pharmaceuit. Res. Devp., 2010, 1, 1-6 [29] Kalra K, Naik S, Jarmal G and Mishra N, Int. J. Appl. Chem., 2009, 5, 73-76. *******************************. www.ijpar.com.
(11)
Figure

Related documents
We found that pleural fluid presepsin levels were significantly higher in cases of empyema and para- pneumonic effusion compared with other types of effusions, as well as in cases
The K-Means clustering approach and Watchdog mechanism are implemented to detect the spoofing attack and to localize them in wireless sensor network.. Block diagram of
Hydrochemical heterogeneity in an upland catchment: further characterisation of the spatial, temporal and depth variations in soils, streams and groundwaters of the
The patterns of change reflect a three component mix of clay- sized sediment types: (1) localised lithogenous sources rich in smectite with subsidiary amounts of amorphous
The DECAF Score: predicting hospital mortality in exacerbations of chronic obstructive pulmonary disease.. Assicot M, Gendrel D, Carsin H, Raymond J, Guilbaud J,
For 24 hours, there was a progressive decline in central vision that began to reverse after beginning a new medical food developed for addressing retinal ischemia associated with
With regard to technical flood control measures it became evident that the effectiveness of flood control mea- sures depends on many different factors, which cannot be considered
Hepatic cirrhosis, tumor number, and maximum tumor diameter were independent prognostic factors of long- term outcomes in this cohort, and anti-HBV therapy after treatment
