City, University of London Institutional Repository
Citation
:
TauSiesakul, B., Gkoktsi, K. & Giaralis, A. (2014). Compressive sensing spectral
estimation for output-only structural system identification. Paper presented at the 7th
Stochastic Computational Mechanics Conference, 15-18 June 2014, Santorini, Greece.
This is the accepted version of the paper.
This version of the publication may differ from the final published
version.
Permanent repository link:
http://openaccess.city.ac.uk/13620/
Link to published version
:
Copyright and reuse:
City Research Online aims to make research
outputs of City, University of London available to a wider audience.
Copyright and Moral Rights remain with the author(s) and/or copyright
holders. URLs from City Research Online may be freely distributed and
linked to.
City Research Online:
http://openaccess.city.ac.uk/
[email protected]
COMPRESSIVE SENSING SPECTRAL ESTIMATION FOR
OUTPUT-ONLY STRUCTURAL SYSTEM
IDENTIFICATION
BAMRUNG TAUSIESAKUL1, KYRIAKI GKOKTSI2 and AGATHOKLIS GIARALIS3
1Department of Civil Engineering, City University London, EC1V 0HB, UK.
E-mail: [email protected]
2Department of Civil Engineering, City University London, EC1V 0HB, UK..
E-mail: [email protected]
3Department of Civil Engineering, City University London, EC1V 0HB, UK..
E-mail: [email protected]
In this paper a compressive sensing (CS), sub-Nyquist, non-uniform deterministic sampling technique is considered in conjunction with a computationally efficient power spectrum estimation approach for frequency domain output-only system identification of linear white noise excited structural systems. The adopted CS sensing spectral estimation approach assumes multi-band input random signals/stochastic processes without posing any signal sparsity requirements and therefore it is applicable to linear structures with arbitrary number of degrees of freedom and level of damping. Further, it applies directly to the sub-Nyquist (CS) measurements and, thus, it by-passes the computationally demanding signal reconstruction step from CS measurements. Numerical results pertaining to the acceleration response of a damped structure with closely-spaced natural frequencies are provided to demonstrate the effectiveness of the considered approach to provide reliable estimates of natural frequencies by means of the standard frequency domain peak-picking algorithm of operational modal analysis using up to 90% fewer measurements compared to the Nyquist rate sampled data. It is envisioned that this study will further familiarize the structural dynamics community with the potential of CS-based techniques for vibration-based structural health monitoring and condition assessment of engineering structures.
Keywords: Compressive Sensing, Power Spectrum Estimation, Output-only System Identification, ARMA Filter, Multi-band Stationary Random Processes, Multi-coset sampling.
1 Introduction and Motivation
Operation modal analysis (OMA), also referred to as output-only modal analysis, is a widely used vibration-based technique for condition assessment, design verification, and health monitoring of civil engineering structures (e.g., Reynders 2012). It relies on certain concepts and techniques from the fields of (linear) structural dynamics, system identification, and modal testing (e.g., Ewins 2000) to derive dynamic properties (e.g.
natural frequencies, damping ratios, and mode shapes) by acquiring and processing low-amplitude acceleration signals from structures excited by ambient (assumed to be white) noise. From a technological viewpoint, the use of wireless sensor networks (WSNs) has been an important development in OMA of civil structures in the past 15 years (e.g., Lynch 2007, Spencer and Yun 2010). Compared to arrays of wired sensors, WSNs allow for more economical and rapid
implementation of OMA. In fact, the current consensus is that WSNs will become the preferred way to monitor civil structures via OMA once the practical constraints of limited energy availability of battery operated sensor nodes and data transmission bandwidth are addressed in a cost-effective and robust manner.
To this aim, it has been recently recognized that theoretical and technological developments from the emerging field of compressive sensing (CS) may offer new viable strategies to reduce costs in WSNs for OMA (Park et al. 2014, O’Connor et al. 2014, Yang and Nagarajaiah 2015). In a nutshell, CS asserts that if an N-length discrete-time signal/vector ∈N×1
x (assumed to be
sampled at the Nyquist rate from an analog continuous-time signal) or its linear transformation a on a basis of vectors collected in the Ψ∈N×Ν matrix (i.e.,
=
x Ψα) has only J non-zero entries (“J-sparse”), then xcan be faithfully retrieved (with high probability) from only M proportional to J·log(N/J) non-uniform random measurements y=ΦΨα, where
1
M×
∈
y and Φ∈M N× is an appropriately defined random matrix, by solving an
1
optimization problem (e.g., Baraniuk 2007). This result suggests that CS can be used to simultaneously acquire and compress signals (i.e., reduce their dimensions from N to M<<N) by exploiting their potentially “sparse” structure in some domain (e.g., the Fourier domain). In fact, although not yet commercially available, various sub-Nyquist CS-based random sampling devices have been theoretically developed and prototyped along these lines (e.g., Tropp et al. 2010, Mishali and Eldar 2010). To this end, wireless sensors equipped with such sampling devices enable slower sampling rates and, therefore, reduced energy consumption (and monetary cost) compared to the currently used analog-to-digital converters (ADCs) operating at least at
the Nyquist rate. These gains become more important in monitoring stiff structures and/or higher modes of vibration. Furthermore, CS-based sampling reduces data storage requirements at the sensor, while the amount of (compressively sensed) data to be transmitted may be low depending on the sparsity of the acquired signals. It is noted, however, that, in principle, CS is not as effective in reducing the amount of transmitted data, which is the most energy consuming operation in wireless sensors, as off-line lossy or lossless data compression algorithms applied to Nyquist sampled signals before wireless transmission at on-board micro-processors in the currently used non-CS sensors (Lynch 2007). Still, efficient CS data acquisition may circumvent the off-line compression step and therefore reduce the size, complexity, and cost of sensors. On the antipode, the computational burden is transferred to the base station since signal reconstruction from compressive sensed signals is a computationally demanding operation.
explored the potential of CS-based OMA in conjunction with blind source separation for mode shape and natural frequency estimation. In a different study, Park et al. (2014) recognized that for the purposes of modal system identification of linear systems, signal reconstruction in time-domain from CS measurements is not necessary. In this regard, they considered a singular value decomposition based algorithm to retrieve mode shapes directly from sub-Nyquist non-uniform random measurements assumed to be acquired by means of the “random demodulator” device of Tropp et al. (2010). Although reasonably accurate results in terms of mode shapes were derived from noisy field recorded data pertaining to a bridge structure, the theoretical development of Park et al. (2014) relies on the assumption of undamped free vibrating deterministic structural response signals (i.e., the analog version of x is a multi-tone signal expressed as a superposition of harmonics with unknown amplitudes and frequencies), which is not aligned with the assumption of white noise excited structures of the standard OMA.
In this study, the potential of a sub-Nyquist non-uniform deterministic sampling technique in conjunction with computationally efficient power spectrum estimation directly from CS acceleration measurements is explored for frequency domain system identification of linearly vibrating white noise excited structural systems. In particular, a discrete-time implementation of a CS sampling device considered in Ariananda and Leus (2012), alongside periodic (deterministic) sampling strategies proposed by Tausiesakul and Gonzalez-Prelcic (2013 and 2014) are adopted. The considered sampling scheme can accommodate multi-band random signals (stochastic processes) and does not require any signal sparsity assumption (see also Cohen and Eldar 2014). In this regard, the herein considered CS-based
strategy for output-only system identification is theoretically applicable to both lightly and heavily damped randomly (white noise) excited structures, whereas it by-passes the computationally demanding signal reconstruction in time-domain from the sub-Nyquist measurements.
The remainder of the paper is organized as follows. Section 2 introduces the adopted device and multi-coset sampling strategy for stochastic processes (random signals). Section 3 reviews the mathematical details to accomplish power spectrum estimation directly from CS measurements, while section 4 outlines the optimization problem that needs to be solved to design efficient deterministic sampling patterns. Section 5 pertinent provides numerical results to assess the applicability and accuracy of the adopted approach by considering simulated acceleration data from a white noise excited two degree of freedom linear structure with closely-spaced natural frequencies. Finally, section 6 summarizes conclusions and points to directions for future work.
2 Multi-coset Compressive Sampling of Stochastic Processes
2.1 Sampling Strategy and Device
Let x(t) be a continuous in time t complex-valued wide-sense-stationary stochastic process characterized by the power spectrum Px(ω) in the domain of frequencies ω
band-limited by 2π/T. Broadly speaking, compressive sensing (CS) aims to sample realizations of this process at a rate lower than the Nyquist sampling rate 1/Τ (in Hz), and still be able to faithfully estimate the power spectrum Px(ω). To this aim, the multi-coset
sampling strategy is herein adopted (see e.g. Misali and Eldar 2009), according to which the grid of Nyquist samples x(nT) is divided into blocks of N consecutive samples and
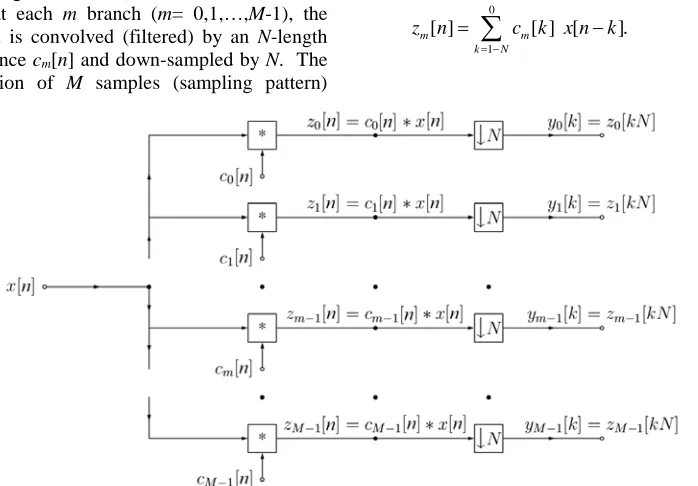
from each block M (<N) Nyquist-rate samples are selected. The resulting sampling is periodic with period N; non-uniform since any subset of M samples may be selected from a total of N Nyquist-rate samples within each block; and deterministic since the position of the M samples on the Nyquist grid of samples x(nT) is defined a priori once and applies to all considered blocks. The above sampling strategy can be implemented by utilizing M interleaved analog-to-digital converters (ADCs) operating at a sampling rate 1/(NT) as discussed in Ariananda and Leus (2012). A discrete-time model of such a sampling device is shown in Figure 1 in which the discrete-time signal x[n]= x(n/T) enters M branches and at each m branch (m= 0,1,…,M-1), the signal is convolved (filtered) by an N-length sequence cm[n] and down-sampled by N. The
selection of M samples (sampling pattern)
within each block is governed by the coefficients cm[n] of the filter written as
1, ,
[ ]
0, ,
m m
m
n n
c n
n n
= −
= ≠ −
(1)
where there is no repetition in nm , i.e.,
1 2, 1 2.
m m
n ≠ −n ∀m ≠m (2)
The output of the m-th branch is given by
[ ] [ ],
m m
y k =z kN (3)
where
z
m[ ]
⋅
is expressed as0
1
[ ] [ ] [ ].
m m
k N
z n c k x n k
= −
[image:5.485.72.421.270.513.2]=
∑
− (4)Figure 1. Discrete-time model of the considered multi-coset sampling device (Ariananda and Leus 2012).
2.2 Relation of the Input and Output
Correlation Functions
Consider the cross-correlation function between the output sequences of the different branches of the device in Figure 1 and the
autocorrelation function of the input signal to the device given by
{
1 2}
1, 2[ ] [ ] [ ] ,
m m
y y y m m
r k =E y l y∗ l−k (5)
{
}
[ ] [ ] [ ] ,
x x
r n =E x m x m∗ −n (6)
respectively, where Ea{·} is the mathematical expectation operator with respect to a and the “*” superscript denotes complex conjugation. Further, consider the pattern cross-correlation function between the different sampling patterns of each branch of the same device expressed as 1 2 1 2 0 , 1 [ ] [ ] [ ]. m m
c c m m
k N
r n c k c∗ k n
= −
=
∑
− (7)Substituting Eq. (1) into Eq. (6), yields
2 1 1, 2[ ] [ ( )].
m m
c c m m
r n =δ n− n −n (8)
where δ[n]=1 for n=0 and δ[n]=0 for n≠0. It can be shown that the following relationship holds (Ariananda and Leus 2012)
1
0
[ ] [ ] [ ],
l
k l k l
=
=
∑
−y c x
r R r (9)
where ry[k] is the M2-by-1 vector collecting
the output cross-correlation functions
1, 2 m m
y y
r
between the M branches of the considered sampling device evaluated at index k, that is,
0 0 0 1 1 1 1
, , T , , [ ] [ ] [ ] [ ] [ ] , M M M
y y y y
y y y y
k r k r k
r k r k
− − = y
r
(10)
x
r [n] is the N-by-1 vector collecting the input autocorrelation function evaluated at certain indices as in
[
]
T[ ] [ ] [ 1]
[( 1) 1] ,
x x
x
n r nN r nN
r n N
= +
+ −
x
r
(11)
and Rc[l] is the M2-by-N matrix defined as
T
[ ] [ ] [ ]
[ ] [ ] ,
l l l
l l
=
0 0 0 M-1
1 1 M-1 M-1
c c ,c c ,c
c ,c c ,c
R r r
r r
(12)
where
1 2 1 2 1 2 1 2
, , ,
T
,
[ ] [ ] [ 1]
[( 1) 1] .
m m m m m m
m m
c c c c c c
c c
n r nN r nN
r n N
= − − + r (13)
In all previous equations and hereafter the “T” superscript denotes matrix transposition. By assuming that the autocorrelation function of the input signal in Eq. (6) takes on negligible values outside the range -L≤k≤L (in practice this will always hold for some L, depending on the level of damping of the structural system being monitored), Eq.(9) can be cast in the form of (Ariananda and Leus 2012)
,
y c x
r = R r (14)
in which ry is the M2(2L+1)-by-1 vector defined as
[0] [ ]L [ L] [ 1] Τ,
= T T T − T −
y y y y y
r r r r r (15)
x
r is the N(2L+1)-by-1 vector defined as
[0] [ ]L [ L] [ 1] Τ,
= T T T − T −
x x x x x
r r r r r (16)
andRc is the M2(2L+1)-by-N(2L+1) matrix given as
[0] [1]
[1] [0]
[1] [0] ,
[1] [0] = c c c c
c c c
c c
R O O R R R O O R O R R
O O O R R
(17)
where O is the zero matrix.
In the next section, an estimator of the power spectrum of the input signal x[n] is considered (and therefore of the process x(t)) derived from the cross-correlation functions between the output sequences of the M branches of the sampling device in Figure 1 upon solving Eq. (10) for rx. These cross-correlation functions are, in turn, estimated directly from the output sequences from each branch in Eq. (3) (i.e., CS measurements). For a Q-long Nyquist sampled input signal x[n] the total number of the output measurements are only MQ/N (M<N) with M/N being the compression ratio.
3 Power Spectrum Estimation Directly from
CS Measurements
Under the assumption that x[n] (the input discrete-time random signal/process in Figure 1) is sampled at the Nyquist rate from a band-limited continuous-time process x(t), the power spectrum of the latter process can be expressed by means of the Wiener-Khintchine theorem within the 0≤ω≤2π range as
( )
[ ] e in ,x x
n
P ω r n ω
∞
−
=−∞
=
∑
(18)where i= −1. The above equation can be discretized using a Nyquist grid and cast in matrix-vector form as
, =
x (2L +1)N x
s F r (19)
where Fnis the N(2L+1)-by-N(2L+1) standard discrete Fourier transform (DFT) matrix and
x
s is a N (2L+1)-by-1 vector given as
T
1
(0) 2
(2 1)
1
2 ((2 1) 1) . (2 1)
x x
x
P P
L N
P L N
L N
π
π
= +
+ −
+
x
s
(20)
Consider the unbiased estimator of the cross-correlation function in Eq. (5) defined as
{ } { }
1 2 1 2
1 min 0,
,
max 0,
1
ˆ [ ] [ ] [ ]
m m
K k
y y m m
l k
r k y l y l k
K k
− +
∗ =
= −
−
∑
, (21)where K is the number of measurements. An estimate of the vector spectrum sx of Eq.(19) can be reached by inverting Eq. (14) as
1
ˆ = ( H )− Hˆ ,
x (2L+1)N c c c y
s F R R R r (22)
where the “-1” superscript denotes matrix inversion and a “H” denotes Hermitian transposition. In the last equation, the (2L+1)M2-by-1 vector ˆ
y
r is defined in a similar way as the vector ry in Eq. (15), where the cross-correlation of Eq.(5) is replaced by the estimator in Eq.(21). To ensure that the pseudo-inverse matrix
1
(R RHc c)−RcH exists, the sampling patterns cm[n] has to be designed such that Rc has full
column rank. It turns out that this design task is equivalent to the selection of M different rows from the identity matrix IN of size N. Importantly, although the sampling pattern correlation matrix Rc is large (i.e., of size M2(2L+1)-by-N(2L+1)), the fact that it has a sparse structure as shown in Eq. (17) can be exploited to reduce the required computational effort to obtain its pseudo-inverse as (Tausiesakul and Gonzalez-Prelcic 2013)
,
=
-1 H -1 H
c c
-1 H
c
H -1 H
c c c
-1 H
c
-1 H
c
-1 H
c
Λ (α)R [0] Λ (α)R [1]
O Λ (α)R [0] (R R ) R O O
Λ (α)R [1]
O O O
Λ (α)R [1]
O Λ (α)R [0]
where Λ(α) is the N-by-N diagonal matrix with the diagonal
[
α α1 2 αN]
,Τ
=
α (24)
in which αp( )n for p= 1,2,…N is given by
2 1 1 2
2 1
1 1
0 0
( ) 1 ( )
1 ( ) ,
r
M M
n r m m
m m
r m m
n n n
N n n n
α δ δ − − = = = − + − − + + − + − −
∑ ∑
n (25)and n is the sequence of M positive integer numbers expressed as
[
]
T0 1 M 1 ,
n n n −
=
n (26)
which defines the sampling pattern in Eq. (1). Substituting Eqs. (15) and (23) into Eq. (22) yields ˆ ˆ 0 0 ˆ 0 -1 ˆ 0 ˆ 0 -ˆ 0 -2 ˆ 0 -1 ˆ 1 1 ˆ 1 L L L = + + x (2L+1)N -1 H c y -1 H c y -1 H c y -1 H c y -1 H c y -1 H c y -1 H c y -1 H c s F
Λ (α)R [ ]r [ ]
Λ (α)R [ ]r [ ] Λ (α)R [ ]r [ ] Λ (α)R [ ]r [ ]
Λ (α)R [ ]r [ ] Λ (α)R [ ]r [ ] Λ (α)R [ ]r [ ]
Λ (α)R [ ]
ˆ 1 -, ˆ
1 - 1
ˆ 1 -1 ˆ 1 0 L L L + y -1 H c y -1 H c y -1 H c y -1 H c y
r [ ]
Λ (α)R [ ]r [ ] Λ (α)R [ ]r [ ]
Λ (α)R [ ]r [ ] Λ (α)R [ ]r [ ]
(27)
in which
1 2 1 2
1 2 1 1 , , 0 0 ˆ [ ] [ ] ˆ [ ] [ ].
m m m m
M M
c c y y
m m k l
k r l
− − ∗ = = =
∑ ∑
-1 H c y -1Λ (α)R r
Λ (α) r (28)
In the next section, a constraint optimization problem is formulated to define the n sequence in Eq. (26) or, equivalently, the sampling pattern in Eq. (1) such that the sampling matrix Rc in Eq. (17) attains a pseudo-inverse and therefore the spectrum
x
s can be estimated directly from the CS measurements using Eq. (27).
4 Design of the Multi-coset Sampling Pattern
Consider the M2(2L+1)-by-M2(2L+1) covariance matrix of the estimator of ry defined as
{
H}
ˆy =Ex (ˆ −Ex{ }) (ˆ ˆ −Ex{ })ˆ ,
r y y y y
C r r r r (29)
and assume that the number of branches M is known. Further, assume that the input signal x[n] is zero-mean circularly-symmetric complex-valued Gaussian i.i.d. noise (note that although this assumption is unrealistic for x[n] being acceleration response of white noise excited linear structural systems, it is only considered herein to facilitate the derivation of the sampling pattern of the device in Figure 1 and is not restrictive to the class of simulated or recorded signals that can be treated by this device). Then, it can be shown that ˆ
y
r
C possesses the block-diagonal structure (Ariananda and Leus 2012)
{
}
ˆ ˆ ˆ[ ] ,
for 0,1, , , 1 , k
k L L
= ∈ − −
y y y
r r r
where ˆ ˆ[ ]k
y y
r r
C is the M2-by-M2 covariance matrix given by
0 0 0 0 0, 0 0 1
0 0 1 0 0 0 1 1
1 0 1 0 1 0 1 1
0 1 0 1
0 1 1 1
4
ˆ ˆ x
, , , , , , , , , , , , , , , 1 [ ]
[0] [0] [0] [0]
[0] [0] [0] [0]
[0] [0] [0] [0]
[0] [0] [0] [0]
M M M M
M M
M M
c c c c c c c c
c c c c c c c c
c c c c c c c c
c c c c
c c c c k
K k
r r r r
r r r r
r r r r
r r r r σ − − − − − − − − ∗ ∗ ∗ ∗ ∗ ∗ ∗ ∗ = − y y r r C
1, 1 1, 1
.
[0] [0]
M M M M
c c c c
r − − r −
− ∗ (31)
By observing that
ˆ ˆ ˆ ˆ
1
[ ]k K [0],
K k =
−
y y y y
r r r r
C C (32)
the matrix in Eq.(29) can be concisely written (and efficiently computed using any higher level programming language) as
(
)
ˆy =K ⊗ ˆ ˆy y[0] ,
r r r
C Λ(β) C (33)
where ⊗is the Kronecker product and β is the (2L+1)-length sequence
T
1 1 1
1
1 1
. 1
K K K L
K L K
= − − − − β (34)
Let fMSE( )n be the normalized mean square error (MSE) of the power spectrum estimator in Eq. (22), given by
{
2}
x E MSE 4 x 1 ˆ E ( ) 1 1
(2 1) 2
L
l f
N L
K = K l σ
− = + + −
∑
x x s s n , (35) where E⋅ is the Euclidean norm. Setting n0=0 in Eq.(26), the optimum design of the
sampling sequence n can be achieved by solving the optimization problem (Tausiesakul and Gonzalez-Prelcic 2014)
MSE MSE
0
1
1
ˆ arg min ( ) ( ) 1,
1
{2,3, , 1},
2 0,
1
s.t. ,
2
{ 1, ,
1
1}, 2
{1, 2, , 2}, r n r M m m f n n N n n N n n
N M m
m M α − − = ≥ ∀ ∈ + = = ∈ + − + + ∀ ∈ − n n n (36)
where MSE( ) 1 MSE( ) 2
f n = f n is given by
1 2 2 1
1 1
MSE 2
0 0 1 ( )
1
( ) .
( )
m m
M M
m m n n
f α − − − = = − =
∑ ∑
n n (37)The above sampling pattern design approach for power spectrum estimation directly from the CS measurements using the multi-coset sampling device of Figure 1 can be further improved in terms of MSE by using a weighted least square error criterion (Tausiesakul and Gonzalez-Prelcic 2013). The following section provides selected numerical results for both the above approaches of multi-coset sampling pattern design.
5 Numerical Example
of a white noise excited two degree-of-freedom (DOF) structural system with closely spaced natural frequencies is considered. Specifically, the system has natural frequencies ω1=20rad/s and ω2=25rad/s, and a common ratio of critical damping of 5% for both modes of vibration. The amplitude of the frequency response function (FRF) squared of the system (transfer function) for acceleration output, sometimes called accelerance in the field of modal testing (Ewins 2000), is plotted in logarithmic dB scale and normalized to its peak value in Figure 2 (thick solid gray curve). The ratio of the two peak values attained by this transfer function at the two natural frequencies is 2.84. Under the assumption of ideal white noise input, which is in alignment with OMA, this transfer function becomes the “target” (known) power spectral density (PSD) function that is sought to be captured by the CS sampling device of Figure 1. Since the device considered assumes Nyquist sampled discrete-time input signals, the considered analog structural system is replaced by a surrogate digital auto-regressive moving average (ARMA) filter whose transfer function traces closely (is practically identical within the frequency range of interest), with
the PSD of the analog system (broken curve in Figure 2). The coefficients of this ARMA filter are derived by the auto/cross correlation matching method (see e.g., Spanos and Zeldin 1998), commonly used for spectrum compatible simulation (see e.g., Giaralis and Spanos 2009).
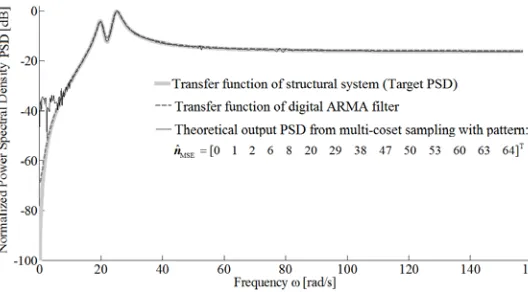
[image:10.485.110.374.421.567.2]For illustration purposes, a multi-coset sampling device with a large number of channels, M=14, and low sampling rate at the ADCs, N=128, is considered which achieves a compression ratio of M N/ 11% (i.e., only 11% of the Nyquist sampled input data are acquired by the device). The sampling pattern shown in the legend of Figure 2 is utilized derived by solving the least squares optimization problem in Eq. (36) assuming K=1768 and L=5. The analytically obtained normalized power spectrum estimate from this device is further plotted in Figure 2. It is shown to capture well the salient attributes of the system transfer function such as the location of the two prominent peaks (natural frequencies) and their amplitude. This PSD has been derived by using Eqs. (9) and (19), along with the autocorrelation function of the ARMA filter in Eq. (6).
Figure 2. Acceleration transfer function of a two degree of freedom structural system (target PSD) with damping ratio 5% for all modes and natural frequencies ω1=20rad/s and ω2=25rad/s, and theoretical PSD
obtained from a multi-coset sampling device in Figure 1 with M=14 and N=128.
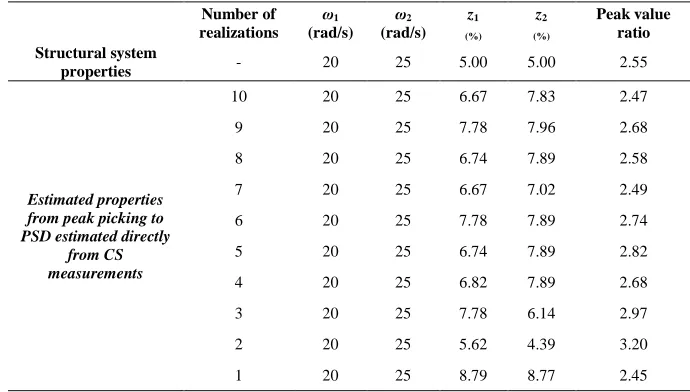
Table 1. Estimated properties of the two degree of freedom structural system with transfer function shown in Figure 2 from frequency domain peak-picking technique applied to average
PSDs estimated directly from CS measurements for different number of realizations.
Figure 3. Estimated PSDs from Nyquist sampled and CS sampled simulated data (K=1768, M=14 and
N=128) vis-a-vis the target PSD (transfer function of considered two degree of freedom structural system).
Furthermore, the consideration of the ARMA filter compatible with the considered structural system allows for the efficient generation of simulated x[n] random signals compatible with the target PSD by filtering discrete-time clipped Gaussian white noise sequences. In this regard, 10 such sequences of 228608 length each are generated and
colored (filtered) through the ARMA model. Next, the thus generated x[n] signals enter the sampling device with M=14 and N=128. In Figure 3, a PSD estimated directly from CS measurements for a single x[n] input realization is plotted against the target PSD. This PSD has been derived by using Eqs. (21), (27) and (28). The considered CS
Number of realizations
ω1
(rad/s)
ω2
(rad/s)
z1 (%)
z2 (%)
Peak value ratio Structural system
properties - 20 25 5.00 5.00 2.55
Estimated properties from peak picking to PSD estimated directly
from CS measurements
[image:11.485.68.413.325.521.2]measurements are taken from a number of K=1786 blocks of N=128 length, and for each block one sample is acquired at each of the M=14 branches. Therefore, a total number of 1786·14= 25004 non-uniform sampled CS measurements are acquired according to the sampling pattern shown in Figure 2. For comparison, the PSDs estimated from 10 Nyquist sampled realizations x[n] (case of N=M=1) where each realization comprises 1786·128= 228608 uniformly Nyquist sampled measurements, are also superposed in Figure 3 derived by means of the standard periodogram for spectral estimation. The considered estimated PSD from simulated CS measurements follows closely the target PSD and confirms the good quality of matching achieved by the PSD derived from the auto-correlation function of the ARMA filter in Figure 2.
Importantly, for the purpose of system identification, error quantification between the estimated CS PSDs from simulated data and the theoretical PSD (e.g., in the mean square sense) may not be an appropriate metric to assess the potential of the herein considered CS-based approach. Rather, the aim is to ensure that reasonable estimates of the structural system properties can be derived from the estimated PSDs. In this respect, the standard peak-picking (PP) in frequency domain algorithm of operational modal analysis (e.g., Reynders 2012) is herein considered to derive natural frequencies, damping ratios and peak value ratios from the CS estimated PSDs. Table 1 summarizes the thus estimated structural properties from averaged PSDs derived from a different number of CS sampled realizations. Remarkably, natural frequencies are accurately retrieved even in the case of considering a single CS sampled realization (i.e., 25004 non-uniform sampled measurements following the multi-coset sampling pattern of Figure 2). Furthermore,
the accuracy of the estimated values of the damping ratios derived fall roughly within the expected range of the PP algorithm. Lastly, the ratio of the estimated peak values attained by the CS PSDs compare relatively well with the value attained by the “target” PSD which is a promising indication of the applicability of the considered approach for mode shape estimation.
6 Concluding Remarks
A multi-coset, sub-Nyquist, non-uniform deterministic sampling strategy to acquire compressive sensed (CS) acceleration measurements of linear white noise excited structural systems has been considered in conjunction with a computationally efficient power spectrum estimation approach for frequency domain output-only system identification. The adopted CS spectral estimation approach assumes multi-band random signals (i.e., realizations of wide sense stationary stochastic processes) without posing any signal sparsity requirements and therefore it is applicable to linear structures with arbitrary number of degrees of freedom and level of damping. Further, it applies directly to the sub-Nyquist CS measurements and, thus, it by-passes the computationally demanding signal reconstruction step from CS measurements as is the case with recent work considering random CS sampling for operational modal analysis. The applicability and effectiveness of the considered approach in undertaking output-only system identification using a reduced number of measurements compared to the Nyquist rate has been demonstrated by a numerical example involving a linear damped two degree-of-freedom white noise excited structure with closely spaced natural frequencies. Further on-going work by the authors addresses the issues of assessing the sensitivity of the approach to additive noise
to the acquired CS signals and of extending the presented approach to the multi-channel case for mode shape extraction directly from CS measurements.
Acknowledgments
The reported research work has been funded by EPSRC, UK under grant EP/K023047/1. The second author further acknowledges the support of City University London through a University studentship.
References
Ariananda, D. D. and Leus, G., Compressive wideband power spectrum estimation, IEEE Trans. Signal Proces., 60(9), 4775-4789, Sept., 2012.
Baraniuk, R.G. Compressive sensing. IEEE Signal Proces. Mag., 24, 118-121, Jul, 2007.
Cho, S., Yun, C. B., Lynch, J. P., Zimmerman, A. T., Spencer Jr., B. F. and Nagayama, T., Smart wireless sensor technology for structural health monitoring of civil structures, Int. J. Steel Struc., 8(4), 267-275, 2008.
Cohen, D. and Eldar, Y.C., Sub-Nyquist sampling for power spectrum sensing in cognitive radios: A unified approach, IEEE Trans. Signal Proces., 62(15), 3897-3910, Aug., 2014.
Ewins, D. J., Modal Testing: Theory practice and application, 2nd ed., Research Study Press, Baldock, 2000.
Giaralis, A. and Spanos, P.D. Wavelets based response spectrum compatible synthesis of accelerograms- Eurocode application (EC8).
Soil Dyn. Earthquake Eng., 29(1), 219-235, Jan., 2009.
Leus, G. and Ariananda, D. D., Power spectrum blind sampling, IEEE Signal Proces. Let., 18(8), 443-446, Aug., 2011.
Lynch, J. P., An overview of wireless structural health monitoring for civil structures, Phil. Trans. R. Soc. A, 365(1851), 345-372, Feb., 2007.
Mishali, M. and Eldar, Y. C., Blind multiband signal reconstruction: Compressed sensing for
analog signals, IEEE Trans. Signal Proces., 57(3), 993-1009, Mar., 2009.
O’Connor, S.M., Lynch, J.P. and Gilbert, A.C. Compressed sensing embedded in an operational wireless sensor network to achieve energy efficiency in long-term monitoring applications, Smart Mater. Struct. 23(8), 085014, Jul., 2014.
Park, J. Y., Wakin, M. B. and Gilbert, A. C., Modal analysis with compressive measurements, IEEE Trans. Signal Proces., 62(7), 1655-1670, Apr., 2014.
Reynders, E., System identification methods for (operational) modal analysis: review and comparison, Arch. Comput. Methods Eng., 19(1), 51-124, Mar., 2012.
Spanos, P.D. and Zeldin, B.A. Monte Carlo treatment of random fields: A broad perspective, Appl. Mech. Rev., 51(3), 219-237, Mar., 1998.
Spencer, B.F.J. and Yun, C.B. Wireless sensor advances and applications for civil infrastructure monitoring. NSEL Report No 24, University of Illinois at Urbana-Champaign, 2010.
Tausiesakul, B. and Gonzalez-Prelcic, N., Power spectrum blind sampling using minimum mean square error and weighted least squares, in
Proc. 47th Asilomar Conf. Signals, Systems and Computers (ACSSC 2013), 153-157, Pacific Grove, CA, Nov., 2013.
Tausiesakul, B. and Gonzalez-Prelcic, N., Power spectrum blind sampling using optimal multicoset sampling patterns in the MSE sense, in Proc. IEEE Int. Conf. Acoust., Speech, Signal Process. 2014 (ICASSP 2014), Florence, Italy, May, 2014.
Tropp, J.A., Laska, J.N., Duarte, M.F., Romberg, J.K., Baraniuk, R.G., Beyond Nyquist: Efficient sampling of sparse bandlimited signals. IEEE Trans. Inform. Theory., 56(1), 520-544, Jan. 2010.