Rochester Institute of Technology
RIT Scholar Works
Theses Thesis/Dissertation Collections
12-1-2010
Modeling and simulation of JP-8 fuel based hybrid
solid oxide fuel cell system
Kalyan Nishtala
Follow this and additional works at:http://scholarworks.rit.edu/theses
This Thesis is brought to you for free and open access by the Thesis/Dissertation Collections at RIT Scholar Works. It has been accepted for inclusion in Theses by an authorized administrator of RIT Scholar Works. For more information, please [email protected].
Recommended Citation
Modeling and Simulation of JP-8 Fuel
Based Hybrid Solid Oxide Fuel Cell
System
by
Kalyan Nishtala
A Thesis Submitted in Partial Fulfillment of the Requirements for the Degree of Master of Science in Mechanical Engineering
Advised by
Dr. Tuhin Das, Assistant Professor, Mechanical Engineering Department of Mechanical Engineering
Kate Gleason College of Engineering Rochester Institute of Technology
Rochester, New York December 2010
Approved By:
Dr. Tuhin Das,
Assistant Professor, Mechanical Engineering Advisor
Dr. Steven Weinstein,
Department Head, Chemical and Biomedical Engineering
Dr. Robert Stevens,
Assistant Professor , Mechanical Engineering
Dr. Edward Hensel,
Thesis Release Permission Form
Rochester Institute of Technology
Kate Gleason College of Engineering
Modeling and Simulation of JP-8 Fuel Based Hybrid Solid Oxide Fuel Cell
System
I, Kalyan Nishtala, hereby grant permission to the Wallace Memorial Library reproduce my thesis in whole or part.
c
⃝
Copyright 2010 by Kalyan Nishtala
Acknowledgments
The following thesis, while an individual work, benefited from the insights and direction of several people. In the first place, I would like to record my sincere gratitude to Dr. Tuhin K. Das for his supervision, advice, guidance, unflinching encouragement and support from the very early stage of this research. The joy and enthusiasm he has for his research have inspired and enriched my growth as a student.
Next, I wish to thank the complete Thesis Committee: Dr. Steven Weinstein and Dr. Robert Stevens. Each individual provided insights that guided and challenged my thinking, substantially improving the finished product. Also, the generous financial support provided by both the Mechanical Engineering Dept. at RIT, ONR (grant #N000140810704) have been invaluable to me, allowing me to pursue my degree and research.
In addition to the technical assistance above, I received equally important assistance from family and friends. I thank my parents for the sacrifices they made to support my education. You have been with me through thick and thin and given me the confidence to believe that I can achieve anything I set my mind to.
I would like to express my deep admiration and gratitude for the knowing and unknow-ing support provided by my dear friend, Nimisha Sunknow-ingh. Your critical evaluation of this thesis document has helped me produce work beyond my standards.
Abstract
Solid Oxide Fuel Cells (SOFC) are solid state energy conversion devices that operate at high temperatures (800 to 1000 ∘C). Their inherent advantage of fuel flexibility, tolerance
to impurities, faster chemical kinetics with non precious catalyst materials and capability of supporting bottoming cycle components make them an attractive proposition for energy generation in comparison to other fuel cell technologies. To assist the advancement of this technology, this work develops dynamic, computer-based, mathematical models of an Auto-thermal reformer (ATR) based SOFC system with Jet Propellant-8 as the fuel to the ATR.
Limitations in the existing models of SOFC systems lie in handling of complex hy-drocarbon mixtures and also in simulating start up conditions. Although experimental data necessary to model these accurately is currently not available, this work puts forth a structured method for model development and management. Hierarchical libraries are developed herein, allowing easy modification of the models on multiple levels for simula-tion of various SOFC system configurasimula-tions, which can help in improving accuracy as and when experimental data is accessible. The comprehensive model consists of submodels for individual components, namely, the fuel cell stack, an ATR reformer, boiler, mixer, heat exchangers, pump, blower, and bottoming cycle components like Stirling engine.
Contents
Acknowledgments . . . . iv
Abstract . . . . v
List of Figures . . . . ix
List of Tables . . . . xi
Nomenclature . . . . xii
1 Introduction. . . . 1
1.1 Motivation . . . 1
1.2 Fundamentals of Solid Oxide Fuel Cell Systems . . . 3
1.3 Fundamentals of External Reformers . . . 4
1.4 Auto-thermal Reformer Models . . . 6
1.5 System Configuration . . . 9
1.6 Objectives . . . 12
2 Fundamental Models . . . . 14
2.1 Control Volume Models . . . 14
2.1.1 Solid Volume . . . 17
2.1.2 Gas Control Volume . . . 18
2.2 1-D Discretization . . . 20
3 Auto-Thermal Reformer Modeling . . . . 22
3.1 Fundamentals of Auto-Thermal Reformer . . . 22
3.1.1 Reactions Scheme . . . 25
3.1.2 Reaction Rate Equations . . . 26
3.1.3 Oxygen to Carbon (O/C) Ratio and Steam to Carbon (S/C) Ratio . . 27
3.2 Preliminary Model . . . 29
3.2.1 Kinetic Model . . . 29
3.2.2 Reactor Model . . . 30
4 Jet Propellant 8 (JP-8) . . . . 36
4.1 Introduction to JP-8 . . . 36
4.1.1 JP-8 Surrogate . . . 37
4.2 Auto-Thermal Reforming of JP-8 - Reaction Scheme . . . 37
4.3 JP-8 Reaction Kinetics . . . 39
4.3.1 Rate Laws . . . 40
4.3.1.1 Power Law Models . . . 40
4.3.1.2 Specific Reaction Rate / Reaction Rate Constant . . . 41
4.3.1.3 Equilibrium Constant(𝐾𝑒) . . . 42
4.3.2 JP-8 Reaction Rate Laws . . . 42
5 Component Models . . . . 45
5.1 Mixer . . . 45
5.2 Auto-thermal Reformer . . . 48
5.3 Boiler . . . 50
5.4 Heat Exchanger . . . 55
5.5 Burner . . . 56
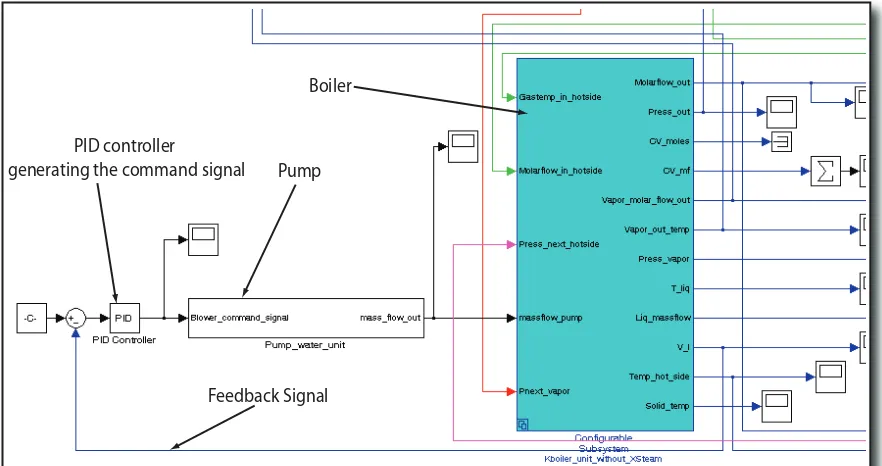
5.6 Air Blowers and Water Pump . . . 60
5.7 Stirling Engine . . . 62
5.8 SOFC Stack . . . 64
5.8.1 Anode and Cathode Reactions . . . 66
5.8.2 Voltage Calculation . . . 67
5.9 Condenser . . . 69
6 Simulation Results . . . . 72
6.1 Mixer . . . 72
6.2 ATR . . . 73
6.3 Boiler . . . 75
6.4 SOFC . . . 77
6.5 Condenser . . . 79
6.6 Burner . . . 81
6.7 Stirling Engine . . . 82
6.8 Boiler Validation Results . . . 83
7 Implementation . . . . 87
7.1 Model Management . . . 87
7.1.1 Hierarchical Libraries . . . 88
7.1.2 Model Reuse . . . 89
7.1.4 Uniform Bus Structure . . . 89
7.1.5 Resolution and Flexibility . . . 90
7.1.6 Expedient Storage . . . 91
7.2 MATLABⓇ / SimulinkⓇ . . . 92
8 Conclusions and Future Work . . . . 93
References . . . . 95
List of Figures
1.1 Separate anode and cathode reactions for SOFC using𝐻2fuel . . . 3
1.2 Schematic of System Configuration . . . 11
2.1 Thermal interaction between Solid volume and Gas CV . . . 16
2.2 1-D Discretization of Solid Volume . . . 21
3.1 Schematic of an Auto-Thermal Reformer . . . 23
3.2 Gas composition along reactor length as determined experimentally for ATRs(Figure courtesy:[41]) . . . 24
3.3 Effect of S/C ratio and A/C ratio (A/C=(O/C)/4) on Hydrogen yield(Figure courtesy:[51]) . . . 28
3.4 Effect of S/C ratio and A/C ratio (A/C=(O/C)/4) on carbon formation for methane(Figure courtesy:[52]) . . . 28
3.5 Heat Transfer Network in a Discretized ATR . . . 30
3.6 ATR Exhaust Gas Temperature . . . 33
3.7 ATR Product Concentrations . . . 34
3.8 ATR Control Volume Pressure . . . 35
3.9 ATR Solid Volume Temperature and Exhaust Molar Flow Rate . . . 35
5.1 Difference between a reactive and a non-reactive control volume . . . 46
5.2 Transition for complete POX to complete TOX . . . 50
5.3 Heat transfer network in the Steam drum model . . . 52
5.4 Heat transfer network in the HEX model . . . 56
5.5 Heat transfer network in the Co-flow HEX model . . . 57
5.6 Heat transfer network in the Counter-flow HEX model . . . 58
5.7 Heat Transfer Network for Combustor . . . 59
5.8 Pump Map (adapted from [2]) . . . 61
5.9 PID controller implementation . . . 62
5.10 PV diagram of an ideal Stirling cycle (adapted from [69]) . . . 63
5.11 Schematic of a Planar SOFC . . . 65
5.12 Heat transfer network a Planar SOFC . . . 66
5.13 Types of Condensation implemented . . . 69
6.1 Mixer Results . . . 73
6.2 ATR Results . . . 74
6.3 ATR Residuum Efflux . . . 75
6.4 Boiler Simulation Results . . . 76
6.5 Simulation Results for SOFC . . . 77
6.6 Anode and Cathode Residuum for SOFC . . . 78
6.7 Cell Voltage variation for SOFC . . . 79
6.8 Simulation results for Condenser . . . 80
6.9 Simulation results for the Burner . . . 81
6.10 Burner Residuum Efflux . . . 82
6.11 Power Output of the Stirling Engine . . . 83
6.12 Boiler Validation Results . . . 84
6.13 Boiler Validation Results . . . 85
7.1 Approach to Heirarchical Library Development . . . 88
List of Tables
3.1 Kinetic Parameters[44] . . . 29
3.2 Equilibrium Constants[44] . . . 29
3.3 Adsorption Constants[44] . . . 29
3.4 Model Parameters . . . 32
3.5 Validation Results . . . 34
4.1 JP-8 Surrogate Composition . . . 37
4.2 List of JP-8 Reactions . . . 39
1 Planar Fuel Cell Geometry and Properties . . . 101
2 ATR Physical and Thermophysical Properties . . . 102
3 Burner Physical and Thermophysical Properties . . . 102
4 Boiler Physical and Thermophysical Properties . . . 103
5 Pump, Stirling Engine, Condenser & Mixer Properties . . . 103
Nomenclature
𝐴 Area, (m2)
𝐴𝑐𝑜𝑛𝑑 Area of conduction,(𝑚2)
𝐴𝑐𝑜𝑛𝑣 Area of convection,(𝑚2)
𝐶 Specific Heat Capacity,(𝐽/𝑚𝑜𝑙.𝐾)
𝐶𝑣 Specific Heat Capacity at constant Volume,(𝐽/𝑚𝑜𝑙.𝐾)
𝐹 Faraday’s constant, (96485.34C/mol)
𝐺 Gibbs Free Energy, (𝐽)
𝐺𝑜 Gibbs free energy at standard pressure,(𝐽) Δ𝐺𝑅𝑥 Gibbs free energy of reaction,(𝐽)
𝐻 Enthalpy, (𝐽)
ℎ Molar Enthalpy,(𝐽/𝑚𝑜𝑙)
ℎ𝑐𝑜𝑛𝑣 Coefficient of Convective Heat Transfer,(𝑊/(𝑚2.𝐾))
ℎ𝑜
𝑓 Enthalpy of Reaction,(𝐽/𝑚𝑜𝑙)
𝑖 Current draw,(𝐴)
𝑖𝑐𝑒𝑙𝑙 Current demand for particular cell,(𝐴)
𝐽𝑜 Exchange current density,(𝐴/𝑚2)
𝐽𝑙𝑖𝑚 Limiting current density,(𝐴/𝑚2)
𝑘𝑐𝑜𝑛𝑑 Coefficient of Conductive Heat Transfer,(𝑊/(𝑚.𝐾))
𝑘𝑣𝑎𝑝 Rate constant for vaporization
𝑘𝑏𝑜𝑖𝑙 Rate constant for boiling
𝑘𝑓 Flow Rate Constant,(𝑚𝑠)
𝐾𝑒 Equilibrium Constant, (Units vary with reaction)
k Modified Specific Reaction Rate Constant, (Units vary with reaction)
𝐿 Length,(𝑚)
𝑀𝑠 Mass of solid structures and Catalyst Bed,(𝑘𝑔) ˙
𝑚 Rate of mass flow,(𝑘𝑔/𝑠) ˙
𝑚𝑝𝑢𝑚𝑝 Rate of mass flow from pump,(𝑘𝑔/𝑠)
𝑀𝑊 Molecular Weight,(𝑘𝑔/𝑚𝑜𝑙)
𝑁 Number of moles,(𝑚𝑜𝑙)
𝑛 Number of electrons participating in electrochemical reaction ˙
𝑁 Molar flow rate,(𝑚𝑜𝑙/𝑠) ˙
𝑁𝑓 Molar flow rate of fuel,(𝑚𝑜𝑙/𝑠) ˙
𝑁𝑝𝑢𝑚𝑝 Molar flow rate of from pump,(𝑚𝑜𝑙/𝑠) 𝒩𝑐𝑒𝑙𝑙 Number of cells
𝑃 Pressure,(𝑃 𝑎)
𝑝 Partial Pressure,(𝑃 𝑎) ˙
𝑄 Net rate of heat transfer into a solid or gaseous volume,(𝑊) ˙
𝑄𝑐𝑜𝑛𝑑 Rate of heat transfer into a solid volume via conduction,(𝑊) ˙
𝑄𝑐𝑜𝑛𝑣 Rate of heat transfer into a solid volume via convection,(𝑊)
𝑅 Reaction rate of particular reaction,(𝑚𝑜𝑙/𝑠𝑒𝑐)
𝑟 Species rate of formation,(𝑚𝑜𝑙/𝑠)
𝑟𝑣𝑎𝑝 Rate of Vaporization,(𝑚𝑜𝑙/𝑠)
𝑟𝑏𝑜𝑖𝑙 Rate of Boiling,(𝑚𝑜𝑙/𝑠)
𝑅𝑢 Universal Gas Constant, (8.314𝐽/(𝑚𝑜𝑙.𝐾))
𝑆 Entropy,(𝐽/𝐾)
𝑇 Temperature,(𝐾)
𝑢𝑏𝑙𝑜 Pump Command Signal, (n/a)
𝑉 Volume,(𝑚3)
V Voltage,(𝑉)
V𝑐𝑜𝑛𝑐 Concentration loss,(𝑉)
V𝑁 𝑒𝑟𝑛𝑠𝑡 Nernst potential,(𝑉)
V𝑜ℎ𝑚 Ohmic loss,(𝑉)
𝑉𝑙 Volume of liquid in the boiler drum,(𝑚3) 𝒳 Species mole fraction,(𝑚𝑜𝑙/𝑚𝑜𝑙)
X Quality of steam,(𝑚𝑜𝑙/𝑚𝑜𝑙)
𝜌𝑤𝑎𝑡𝑒𝑟 Density of Water,(𝑘𝑔/𝑚3)
𝜔𝑏𝑙𝑜 Pump Speed,(𝑟𝑝𝑚)
𝜔0 Nominal Pump Speed,(𝑟𝑝𝑚)
𝜏𝑏𝑙𝑜 Blower Time Constant,(𝑠)
Ω𝑎𝑛𝑜𝑑𝑒 Area specific resistance of anode,(Ω/𝑚2) Ω𝑐𝑎𝑡ℎ𝑜𝑑𝑒 Area specific resistance of cathode,(Ω/𝑚2) Ω𝑒𝑙𝑒𝑐𝑡𝑟𝑜𝑙𝑦𝑡𝑒 Area specific resistance of electrolyte,(Ω/𝑚2) Ω𝑖𝑛𝑡𝑒𝑟𝑐𝑜𝑛𝑛𝑒𝑐𝑡 Area specific resistance of interconnect,(Ω/𝑚2)
Subscripts
𝑚 Unit Number in discretized models
𝑠 Solid
𝑐𝑜𝑛𝑑 Conductive
𝑐𝑜𝑛𝑣 Convective
𝑔 Gas
𝐶𝑉 Control Volume
𝑖𝑛 at inlet
𝑜 at outlet
𝑖 Values 1-15 representing species
𝑗 Values 1-18 representing reactions
𝑧 Total number of species involved
𝑠𝑎𝑡 at saturation
𝑖𝑔 Ideal Gas
𝑐𝑜𝑛𝑑𝑠 Condensation
𝑓 Fuel
𝑝𝑢𝑚𝑝 Pump
𝑙 Liquid
𝑠2𝑣, 𝑠𝑣 From solid CV to vapor CV
𝑠2𝑙, 𝑠𝑙 From solid CV to liquid CV
Chapter 1
Introduction
1.1 Motivation
Energy is the very lifeblood of today’s society and economy. Our work, leisure, and our economic, social and physical welfare all depend on the sufficient, uninterrupted supply of energy. Yet we take it for granted – and energy demand continues to grow, year after year. The challenge today is to conserve the traditional fossil energy sources such as oil that are ultimately limited, and maximize the energy that can be extracted from them till they last. We must strive to make these more sustainable to avoid the negative impacts of global climate change, the growing risk of supply disruptions, price volatility, air pollution, and even political instability that are associated with today’s energy systems [1].
This calls for immediate action to promote greenhouse gas emission-free energy sources offering cleaner, more-efficient alternatives to the combustion of gasoline and other fossil fuels. The energy policy of many technologically advanced nations advocates securing energy supply while at the same time reducing emissions that are associated with climate change.
Fuel cell systems are currently under intensive development by several manufactur-ers for both stationary and mobile applications [2]. Several fuel cell technologies have been developed over the last decades, such as Polymer Electrolyte Membrane Fuel Cells (PEMFC), Alkaline fuel cells (AFC), Solid Oxide Fuel Cells (SOFC), and Molten Carbon-ate Fuel Cells (MCFC) [3, 4]. Among these, Solid Oxide fuel cells stand out due to their inherent simplicity in design and the existence of only two phases, solid and gas.
Solid oxide fuel cells (SOFCs) have increasingly been recognized as a viable high tem-perature fuel cell technology. There is no liquid electrolyte with its attendant material cor-rosion and electrolyte management problems. The operating temperature of 600∘- 1000∘C,
[4] allows internal reforming, promotes rapid kinetics with non-precious catalytic materi-als, and produces high quality byproduct heat for cogeneration or for use in a bottoming cycle, similar to the MCFC, [5]. It is Carbon Monoxide tolerant and can use it as fuel unlike other fuel cells.
The high temperature of the SOFC, however, places stringent requirements on its ma-terials. The development of suitable low cost materials and the low cost fabrication of ceramic structures are presently the key technical challenges facing SOFCs [6]. This also dictates the slow rise and fall in cell temperatures, to preserve integrity of materials and assemblies [7].
1.2 Fundamentals of Solid Oxide Fuel Cell Systems
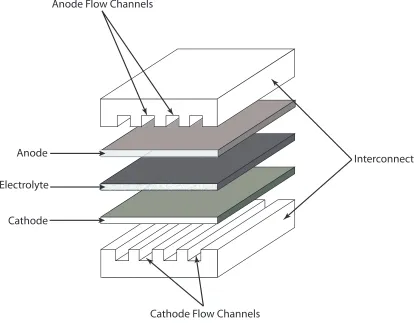
The Solid Oxide Fuel Cell is an eletrochemical device for the conversion of chemical en-ergy of a fuel into electricity and heat. Today’s state-of-the-art SOFCs utilize Yttria Sta-bilized Zirconia (𝑌 𝑆𝑍) as the electrolyte; a ceramic metal composite (cermet) comprised of Nickel and 𝑌 𝑆𝑍 as the anode; and Lanthanum Strontium Manganite or 𝐿𝑆𝑀 as the cathode. The interconnect material is alkali doped 𝐿𝑎𝐶𝑟𝑂3 (lanthanum chromite), with the specific dopant (typically,𝑆𝑟,𝐶𝑎or𝑀𝑔), [8], and concentration being selected to best match the thermal expansion of the other fuel cell components in the geometry of inter-est [9]. All this materials being solids, high temperatures (800∘-1000∘C) are necessary to
assure high ionic (for electrolyte) and electronic (for electrodes and interconnect) conduc-tivities [10].
Electrolyte Porous Anode
Porous Cathode
H2 + O2- → H
2O + 2e
-1 _
2O2 + 2e
- → O
2-Fuel
Air
L o a d
Overall Cell reaction: H
2 +
_ 1
2O2 → H2O
Figure 1.1: Separate anode and cathode reactions for SOFC using𝐻2fuel
oxidize the fuel to form water. The oxidation process involves expulsion of two electrons which run through the external circuit back to the cathode, in the process, completing the circuit. Figure 1.1 depicts the individual anode and cathode reaction along with the overall cell reaction.
The primary fuel for SOFCs, Hydrogen, can be generated from external reformers, by reforming hydrocarbon fuels, placed upstream of the fuel cell or through SOFC internal reforming itself. However, internal reforming in the SOFC is limited to lighter hydrocar-bon [11, 12], as reforming of heavy hydrocarhydrocar-bons within the SOFC tends to be sluggish, prolonging the start up duration. The major types of external reformers their operation, their advantages and disadvantages will be discussed in the next section.
1.3 Fundamentals of External Reformers
This section introduces some key concepts of external fuel processors and gives a compar-ative analysis of various types of external fuel reformers. External reformers significantly contribute to the total system dynamics of an SOFC system. The reforming process can be carried out using a variety of procedures. Among them, thermo-chemical conversion of fuels to hydrogen remains the most prevalent means. Electrolysis is also attractive given its zero carbon-dioxide emission. However, the process is inefficient due to its high electrical energy requirement [13, 14]. The use of bio-reactors for hydrogen production has also been explored in recent years. The technology is still in early stages with severe technical diffi-culties and is far from industrial applications [13, 14]. There are three primary methods for thermo-chemical production of hydrogen, namely Steam Reforming (SR), Catalytic Par-tial Oxidation (POX), and Auto-Thermal Reforming(ATR) [15]. In addition plasma based reformers are also being researched.
in the presence of a catalyst to produce hydrogen, carbon monoxide, and carbon diox-ide. These reformers are well suited for long periods of steady-state operation and can deliver relatively high concentrations of hydrogen. The primary SR reaction is strongly en-dothermic and reactor designs are typically limited by heat transfer, rather than by reaction kinetics. Consequently, the reactors are designed to promote heat exchange and tend to be large and heavy. Indirect heat transfer (across a wall) makes conventional steam reformers less attractive for the rapid start and dynamic response [16].
In Partial Oxidation reformers (POX) fuel reacts with a sub-stoichiometric amount of oxygen. The initial oxidation reaction results in heat generation and high temperatures. The heat generated from the oxidation reaction raises the gas temperature to over 1000∘C,
whereby it is relatively easy to steam-reform the remaining (usually methane and other py-rolysis products) or added hydrocarbons or oxygenates, by injecting an appropriate amount of steam into this gas mixture. The oxidation step may be conducted with or without a catalyst [16].
As compared to steam reformation, POX has the advantage of a short start-up time because of the fast exothermic nature of the reaction. On the other hand, the exothermic nature of the reaction and the heat transfer limitation within the catalyst make it difficult to control the catalyst temperature and reformate composition. Localized hot spots can overheat and sinter the catalyst [15].
POX has a complex reaction system. The reaction produces various intermediate species and radicals which decreases the purity of the output stream. There are also coke precur-sors which cause catalyst deactivation for both precious and non-precious metal catalysts. Pure oxygen and air have been used as oxidizer in these systems. However, the effect of the presence of inert gas such as nitrogen in the partial oxidation can reduce the efficiency of the reformer by lowering the output stream hydrogen concentration, hence the fuel cell electrical efficiency by lowering the open circuit voltage. In general, there is no control over the chemical species in POX [15].
start the fuel processing in POX mode (exothermic) and then add in water to transition to SR mode (endothermic) [17]. Auto-thermal reformers represent an incisive approach by their simplicity and compactness. In ATR fuel, water, and air are fed together into the reactor. This process is carried out in the presence of a catalyst, which controls the reaction pathways and thereby determines the relative extents of the oxidation and steam reforming reactions. The SR reaction absorbs part of the heat generated by the oxidation reaction, limiting the maximum temperature in the reactor. The net result is a slightly exothermic process. But in order to achieve the desired conversion and product selectivity, an appropriate catalyst is essential [16]. Further discussion on ATRs is held in chapter 3.
Plasma reformers have been the latest development in the field of fuel reformers. Ther-mal plasma reactors (plasmatrons) have different constructive variants (induction, DC and microwave plasmatrons). Basically, the plasmatron comprises two water-cooled metallic tubular electrodes. A spark occurs in the gap between the electrodes, and the incoming feedstock gas blows the arc into the arc chamber. The working gas can be injected directly or tangentially into the gap between electrodes. Applying an external magnetic field can enhance the gas rotation [18]. The gas is ionized and ionic collisions result in reformation of the feed stock. This method is becoming increasingly popular, however, for this tech-nology to be able to compete with conventional reforming techniques, significant amount of research is necessary. Such research is already underway, but the commercial viability is still far from realization.
1.4 Auto-thermal Reformer Models
were in the terms of accessible gas phase partial pressures and contained a denominator re-sulting from the adsorption of reacting species on the surface of the catalyst. Subsequently, these equations were used liberally by other researchers in their studies. In addition, Xu and Froment also proposed the rate determining steps of the reaction schemes.
In 1996, Ma et al. [20] studied the catalytic oxidation of methane experimentally in order to derive expressions for calculating the rate of partial oxidation reactions which form an integral part of auto-thermal reformers. These expressions were comparatively similar to those derived by Xu and Froment during their experiments on steam reforming although the oxidation reactions being unidirectional in nature did not contain an equilibrium constant term.
In 2001, Ahmed et al. [16] described in detail the working of the three principle modes of fuel reforming to produce hydrogen rich reformate - steam reforming, partial oxidation reforming and auto-thermal reforming. Basic reaction schemes, process efficiencies, im-portant process parameters, fuel options and possible challenges of each type of reformer were discussed in detail. A model similar to that of Ahmed et al.’s can be found in [21].
Barrio et al. [22] combined the stream reforming rate laws given by Xu and Froment and the partial oxidation reaction rate laws given by Ma et al. to construct a basic model of an auto thermal reactor. The thermal analysis of their model was directed towards the minimization of hot spots on the auto thermal catalyst surface. Other similar models were studied by Boehme et al. [23].
and consequently, provided a definitive method for calculating the diffusion and thermal heat transfer coefficients for an auto thermal reformer.
Chan et al. [27] further extended their studies by enhancing their model to take into ac-count the radially varying gas velocity in the axial direction; the radially varying porosity of the reactor; and the effectiveness of the gas diffusing into the porous catalyst pellets. Fur-ther insights into the auto-Fur-thermal reforming process were obtained by studying the effect of varying inlet gas temperatures and reformer radius. It was also noted that partial oxi-dation was dominant in the front portion, auto thermal in the mid portion, while a slightly stronger presence of steam reforming was found at the rear portion of the reactor.
In 2001, Danial et al. [28] modeled an auto-thermally reformed gasoline fueled PEMFC system to identify the influence of various operating parameters on system performance and to investigate the related tradeoff scenarios. The authors found that lowering the reforming temperatures yielded higher fuel processor efficiencies, particularly if the fuel cell exhaust gas heat energy was utilized. Their model included components like fuel pumps, boilers, heat exchangers etc. However, their research did not include start up simulations.
Cold start up simulations were examined by Springmann et al. [31], for the Daimler Chrysler group. The primary objective of these simulations was to assess system capabili-ties for onboard hydrogen production for automobile applications, to assess system start up time and to determine ways to reduce it. The authors found the control of air to fuel ratio and the availability of steam during the cold start to be of great importance to minimize the start up time.
Further studies on start ups of fuel cell reformers were done by Ahmed et al. [32]. The purpose of these studies was to design a fuel processor capable of a fast start. As a result of these studies, Ahmed et al designed hardware and a start-up strategy that in combination could produce the requisite hydrogen flow rates within 60 seconds.
It is evident from a survey of the existing literature that the use of JP-8 as feed gas for fuel cell systems and start up simulations has not been throughly explored in the dynamic modeling regime. Most of the efforts with regards to start up cycles have been dedicated towards minimizing the start up time. In addition, current models assume that the fuel en-tering the reformer is formerly vaporized and hence phase change is not considered in such models. Research in this regard is necessary to evaluate the system’s flexibility in han-dling a variety of fuels and its capability in competing with conventional energy generation devices such as IC engines which have a significantly lower start up time. If explored in further depth, these facets of fuel cell systems will contribute significantly to the relevant research currently available.
1.5 System Configuration
such equipment is well developed, having been employed, for other application [33]. Thus, a fuel cell system constitutes of the fuel cell itself, external reformer if hydrogen is directly inaccessible, turbo-machinery components to drive the working fluids around the system, heat exchangers and boilers, and bottoming cycle components to harness extra-neous exhaust energy. One such system, the one being modeled for this thesis, is shown in Fig. (1.2). The system consists of the following components:
∙ Air Blowers: Pump air into the mixer and the cathode of the fuel cell.
∙ Water Pump: Supplies water to the boiler.
∙ Mixer: Forms a homogeneous mixture of air, fuel and steam.
∙ ATR: Reforms the fuel(JP-8) mixed with steam and air from the mixer to produce hydrogen rich reformate.
∙ Steam Generator/Boiler: Produces steam necessary for the reformation of the fuel. It uses the exhaust heat from the ATR.
∙ Heat Exchangers (HEX): The anode HEX preheats the influx to the anode from the heat of the anode exhaust gases. The cathode HEX preheats the incoming air from the blower using the exhaust heat of the cathode efflux.
∙ SOFC: Uses hydrogen rich reformate from the ATR and air from the blower to covert their chemical energy to electrical energy through electrochemical oxidation of hy-drogen to form steam as byproduct.
∙ Condenser: Condenses any steam left in the flow to water leaving behind a mixer of combustible gases free of steam.
∙ Burner: Burns left over fuel in the flow and increases its temperature that can be used by the Stirling engine as a heat source.
SO
FC
ATR
Pum
p
An
ode
HEX
Ca
th
ode
HEX
Con
den
ser
Bur
ner
Boiler
St
eam
Mix
er
W
at
er
Fuel
Air
Air
Sti
rlin
g
En
gin
e
Blo
w
er
Blo
w
er
Ca
th
ode
An
[image:27.612.152.469.99.669.2]ode
1.6 Objectives
The primary objective of this thesis is to mathematically model ATR based hybrid SOFC systems. Broadly, this thesis will serve as a preliminary platform to model complex, de-tailed and control oriented SOFC systems. Section 1.4 annotates the shortcomings of ex-isting models of SOFC systems. The modeling effort presented in this work will address these issues and will try to overcome the deficiencies of the existent models. Adopting a systems perspective, the research develops a comprehensive mathematical model that cap-tures the essential physical phenomena including thermodynamics, heat transfer, chemical kinetics, pressure dynamics, and electrochemistry. The characteristics of the system are studied through a model-based analytical approach. The research has been conducted in the Hybrid Sustainable Energy Systems (HySES) Laboratory in the Mechanical Engineer-ing Department at Rochester Institute of Technology.
The model development efforts at the HySES laboratory are aimed to generate a de-tailed understanding of the system dynamics of SOFC systems leading to predictive tools for control. The models presented in this thesis are progressions of such models. In ad-dition to the essential dynamics listed earlier, this research work discusses modeling of phase change phenomenon, start-up simulations and use of heavy hydrocarbon fuel like JP-8. Earlier research work, in the HySES lab and in the research community in general, has seldom included such phenomena in their research work. This is the major contribu-tion of this work to the research community which can lead to more accurate, risk-free and inexpensive mode of experimentation.
∙ Come up with a structured method for model development and management allowing easy modification of the models on multiple levels for simulation.
∙ Capability of capturing essential dynamics such as heat transfers, chemical kinetics, electro chemistry, thermodynamics and pressure dynamics.
∙ Enable Start-up simulations.
∙ Incorporate complex hydrocarbons such as JP-8.
∙ Keep models simplistic and phenomenological to allow futuristic real time simula-tions and development of control schemes.
Chapter 2
Fundamental Models
2.1 Control Volume Models
The modeling methodology presented in this chapter is a generalized approach which more or less pertains to all the component models which constitute the entire system. For pro-cessing speed while capturing transients, a lumped model approach is chosen. This is opposed to using a computational, finite-element model where a system of equations must be solved iteratively at each time step. The iterative approach could provide additional details regarding some of the internal flows or species distribution, and it could be help-ful to resolve specific system design challenges. However, running real-time simulations with this type of model would prove impossible, and for the desired system level analysis finite elements would be more cumbersome than helpful. This non-iterative approach does not preclude it from all the benefits of a discretized model [14]. The discretized modeling approach will be explained in subsequent sections of this chapter.
In order to achieve level of simplicity mentioned above the following assumptions were made while the modeling effort was being carried out. They are noted and justified where appropriate in the derivations that follow.
∙ Lumped solid control volumes with uniform properties
∙ Homogeneous gas mixtures with uniform properties
∙ Neglect radiative heat transfer
∙ One-dimensional flow
∙ No body forces (gravity) in flow direction
∙ Neglect local changes in kinetic energy
∙ Darcys law for frictional effects
∙ Ideal gas equation of state
∙ Constant specific heats
∙ Combustion reactions are instantaneous
The essential dynamics of the system can be represented through fundamental solid volume and gas control volume models [34]. Features unique to the solid volume and gas control volume have been itemized below:
Solid Volume:
∙ Constitutes the entire solid mass including catalyst mass if catalyst is present.
∙ Primarily serves to capture the thermal characteristics of the system
∙ Conductive heat transfer along the length of the solid volume has been accounted for by discretizing the model. Heat transfer takes place between adjacent elements via conduction.
∙ Captures convective heat transfer to the gas control volume
Gas Control Volume:
∙ Gas control volumes represent the flow of fuel, air, and water vapor through the system
∙ Reactive gas control volumes capture the kinetics of reactions. Hence the composi-tion of the influx is not necessarily same as that of the efflux
∙ Conversation of mass , energy and momentum is implemented in the Gas CV.
∙ In addition to capturing the reaction kinetics, other transients such the pressure dy-namics of the system are also captured here.
Gas Control Volume
Solid Volume
Acond
Aconv
hconv
kcond
Ts,m
Tg
Ts,m+1
[image:32.612.146.460.333.586.2]Lcond
Figure 2.1: Thermal interaction between Solid volume and Gas CV
2.1.1 Solid Volume
As mentioned earlier, Solid control volumes represent the solid physical structures of the system that contain the gas flows. In the model they primarily serve to capture the thermal characteristics of the system. The rate of change of temperature of the solid volume is de-pendent on the net rate of heat transfer into the volume through the following fundamental energy balance equation:
𝑀𝑠𝐶𝑠𝑇˙𝑠 =
∑ ˙
𝑄𝑠 (2.1)
where, the total heat flux,𝑄˙𝑠, into the volume is the sum of both convective and conductive heat transfer,𝑇˙𝑠is the temperature of the solid volume and𝑀𝑠and𝐶𝑠are the solid volume mass and specific heat capacity of the solid material respectively. The conductive heat transfer between individual solid volumes is modeled using the Fouriers law of conduction, [35]. The conductive heat transfer from the𝑚𝑡ℎelement to the(𝑚+ 1)𝑡ℎelement is :
˙
𝑄𝑐𝑜𝑛𝑑 =𝐴𝑐𝑜𝑛𝑑𝑘𝑐𝑜𝑛𝑑
(𝑇𝑠,𝑚−𝑇𝑠,𝑚+1)
𝐿𝑐𝑜𝑛𝑑
(2.2)
where 𝑄𝑐𝑜𝑛𝑑 is the conductive heat transferred, 𝐴𝑐𝑜𝑛𝑑 is the conductive area, 𝑘𝑐𝑜𝑛𝑑 is the conductive heat transfer coefficient,a known material property, 𝑇𝑠,𝑚+1 and 𝑇𝑠,𝑚 are the temperatures of the𝑚+ 1𝑡ℎand the𝑚𝑡ℎelements, respectively.
Newtons law of cooling [35] has been used to model convective heat transfer between solid and gaseous control volumes. The convective heat transfer within the 𝑚𝑡ℎ element from the gas control volume into the solid volume can be expressed as
˙
𝑄𝑐𝑜𝑛𝑣=𝐴𝑐𝑜𝑛𝑣ℎ𝑐𝑜𝑛𝑣(𝑇𝑔,𝑚−𝑇𝑠,𝑚) (2.3)
2.1.2 Gas Control Volume
As mentioned earlier, Gas control volumes represent the flow of fuel, air, and water vapor through the system. Each molecular species is tracked separately, as the composition of an incoming gas may change due to chemical reactions within the volume. The gas mixture within the volume is considered homogeneous with uniform properties; therefore, the flow leaving the volume exhibits the same values for these properties as the flow within the volume.
The gas control volume model consists of energy balance, mass balance and pressure dynamics equations and captures the reaction kinetics arising from fuel reforming and elec-trochemistry (SOFC).
The Energy balance of the CV follows the conservation of energy for a compressible fluid control volume with one dimensional flow [38]. The subsequent derivation leads to the energy balance equation presented below. For the complete derivation refer to [14].
𝑑
𝑑𝑡(𝑁𝐶𝑉𝑇𝑔) =
1
𝐶𝑣,𝑔
( ˙
𝑁𝑖𝑛ℎ𝑖𝑛−𝑁˙𝑜ℎ𝑜−𝑄˙𝑐𝑜𝑛𝑣+𝑟𝑖ℎ𝑜𝑓
)
(2.4)
The Mass balance of the CV follows conservation of mass for a one-dimensional com-pressible flow, [38]. Derivation from this primary principles yields the mass balance equa-tion for an individual species as employed in the model. For complete derivaequa-tion refer to [14].
𝑑
𝑑𝑡(𝑁𝐶𝑉𝒳𝑖) = ˙𝑁𝑖𝑛𝒳𝑖,𝑖𝑛−𝑁˙𝑜𝒳𝑖,𝑜+𝑟𝑖 (2.5)
where specific values of subscripts 𝑖, 𝑖 = 1,2,⋅ ⋅ ⋅ , 𝑧, correspond to the species involved in the chemical reactions. It has been assumed that all the gases in the control volume are driven out of the control volume at the end of the reaction,
𝒳𝑖 =𝒳𝑖,𝑜 (2.6)
𝑧 ∑
𝑖=1
𝒳𝑖 = 1⇒
𝑧 ∑
𝑖=1 ˙
𝒳𝑖 = 0 (2.7)
Summing up the other variables for all elements, we have
˙
𝑁𝐶𝑉 = ˙𝑁𝑖𝑛−𝑁˙𝑜+
𝑧 ∑
𝑖=1
𝑟𝑖 (2.8)
Conservation of momentum principles for a compressible fluid control volume with one dimensional flow yield the momentum balance equations. However, to contend with the complexities of fluid friction, this can be replaced with Darcys law, [38], which can be written for either the inlet flow or exit flow as,
˙
𝑚𝑖𝑛 = 𝑘𝑓(𝑃𝐶𝑉,𝑝𝑟𝑒𝑣𝑖𝑜𝑢𝑠−𝑃𝐶𝑉)
˙
𝑚𝑜 = 𝑘𝑓 (𝑃𝐶𝑉 −𝑃𝐶𝑉,𝑛𝑒𝑥𝑡)
(2.9)
where𝑘𝑓 is a flow rate constant determined from experimental data, but based on physical properties of the fluid and geometry. Equation 2.9 is then divided by the molecular weight,
𝑀𝑊𝑔, to obtain molar flow rate,
˙
𝑁𝑖𝑛 = (𝑘𝑓(𝑃𝐶𝑉,𝑝𝑟𝑒𝑣𝑖𝑜𝑢𝑠−𝑃𝐶𝑉))/𝑀𝑊𝑔,𝑖𝑛 ˙
𝑁𝑜 = (𝑘𝑓(𝑃𝐶𝑉 −𝑃𝐶𝑉,𝑛𝑒𝑥𝑡))/𝑀𝑊𝑔,𝑜
(2.10)
To incorporate dynamics resulting from pressure and density changes in the system the assumption of an ideal gas is made. Thus, the pressure in each volume is calculated by,
𝑃𝐶𝑉 =𝑁𝐶𝑉𝑅𝑢𝑇𝐶𝑉/𝑉𝐶𝑉 (2.11)
2.2 1-D Discretization
Many material properties such as 𝐶𝑣 and ℎ are found as functions of temperature, and because heat is being generated and transferred in various places in the system, there are often significant temperature gradients from one point to another as shown in Eq.(2.12), [39]:
𝐶𝑝,𝑖(𝑇)/𝑅𝑢 =𝛼+𝛽𝑇 +𝛾𝑇2 +𝛿𝑇3+𝜀𝑇4 (2.12)
where 𝛼, 𝛽, 𝛾, 𝛿, 𝜀 are all temperature dependent quantities that can be found in many thermodynamics text books.
The lumped control volume approach, assumes that properties such as temperature and pressure are uniform throughout the volume. While knowing all the details of the internal temperature distribution is not necessary for the desired analysis, neglecting these gradients can have a negative effect on the overall accuracy of the model. To improve the accuracy of the model then, a one dimensional discretization scheme can be applied to the control volume method, [14].
The system is discretized only in the direction of flow, which itself has been modeled as a 1-D flow. To implement this change requires only minor modification of the generic control volume equations developed in section 2.1.
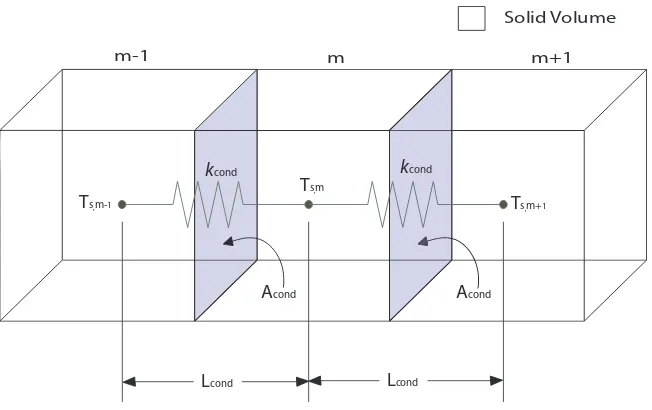
For the solid control volume the overall energy balance in Eq. (2.1) remains the same, but𝑄˙𝑠 includes two conduction terms. Based on Eq. (2.2) and Fig. (2.2) the total 𝑄˙𝑐𝑜𝑛𝑑 can be written as [14],
∑ ˙
𝑄𝑐𝑜𝑛𝑑=𝐴𝑐𝑜𝑛𝑑𝑘𝑐𝑜𝑛𝑑
(𝑇𝑠,𝑚−𝑇𝑠,𝑚+1−𝑇𝑠,𝑚−1)
𝐿𝑐𝑜𝑛𝑑
(2.13)
where the cross-sectional area,𝐴𝑐𝑜𝑛𝑑, and the length,𝐿𝑐𝑜𝑛𝑑, of each element is the same. Also the surface area for convection, 𝐴𝑐𝑜𝑛𝑣, in Eq. (2.3), is scaled based on the length of the element.
Acond
kcond
Ts,m
Ts,m-1
Lcond
Acond
Ts,m+1
kcond
Lcond
m-1 m m+1
[image:37.612.148.474.100.305.2]Solid Volume
Figure 2.2: 1-D Discretization of Solid Volume
Chapter 3
Auto-Thermal Reformer Modeling
3.1 Fundamentals of Auto-Thermal Reformer
Fuel processing is defined as the conversion of a commercially available gas, liquid, or solid fuel to a fuel gas reformate suitable for the fuel cell anode reaction. A fuel processor is an unit that carries out this function, as needed for the fuel cell requirements and the fuel, that function together to be cost effective for the application. Design considerations may include high thermal efficiency, high hydrogen yield (for some fuel cells hydrogen plus carbon monoxide yield), multi-cycling, compactness, low weight, and quick starting capability, depending on the application, [40].
temperature to over 1000∘C, which permits adiabatic operation and promotes SR of the
remaining fuel, [26]. However, high exothermic nature of this process results in undesir-able high temperature leading to construction and material constraints and low hydrogen selectivity (lower hydrogen yield per mole of fuel).
Auto-thermal reforming provides a fuel processor compromise that combines the en-dothermic SR and the exothermic POX reforming processes. The basic idea of ATR is that both endothermic SR reactions and exothermic POX reforming reactions occur simul-taneously, so that no heat needs be to supplied or removed from the system. This means no complex heat management engineering is required resulting in simpler system design, [33]. As a consequence of the operation mechanism of an ATR the system is moderately exothermic in nature. The operating temperature lies between 1100∘C to 1400∘C [12].
Fuel and Steam
Air
Catalyst Bed
Combustion Chamber
Predominantly POX reaction
POX and SR reactions occur in parallel
Hydrogen rich reformate
The ATR reactor consists of a burner, a combustion chamber, and a fixed bed catalyst section contained in a refractory lined pressure shell. Figure 3.1 depicts a typical ATR sys-tem. However, unlike the figure suggests, there is no actual physical boundary between the combustion chamber and the later part of the reformer where the steam reforming reactions take place. It is the reformer’s inherent property which leads to the first few sections of its length to be predominant POX reaction sites, while the rest to be the steam reforming zones. This argument has been much debated and can be substantiated through Springmann et al.’s [41] experimental results which are further discussed in the next paragraph.
Figure 3.2: Gas composition along reactor length as determined experimentally for ATRs(Figure courtesy:[41])
reaction zones in ATR. It should also be noted that oxidation reactions can be both partial or complete oxidation reactions, [12, 41].
From the above discussion it can be concluded that the key elements in the ATR reactor is the burner and the catalyst bed. The burner provides mixing of the feed streams and the fuel is converted into a turbulent diffusion flame [42]. Rapid combustion takes place leading to increased system temperatures. In order to control system temperatures the air addition should be performed in limited amounts. When the amount of oxygen is increased to a certain level where the energy generation by partial oxidation reaction balances the energy consumption of steam reforming, the overall reaction is theoretically self-sustaining or auto-thermal, [12]. The temperature at which the theoretical energy equilibrium can be achieved is know as ‘ Light-off temperature ’. Several ATR light-off temperatures have been reported in literature based on the working conditions considered. Typically, the ATR light-off lies between 300∘C [26, 43] to 450∘C [44].
3.1.1 Reactions Scheme
The chemical kinetics of the SR and the POX reactions play a major role in controlling the operating conditions exhibited by an ATR. In order to understand the chemical kinetics in greater detail let us consider the example of a simple hydrocarbon fuel, Methane. ATR of methane has been widely studied in [22, 26, 27, 44–46]. Hence, the involved chemical reactions can be explicitly found in literature. However, to reduce the complexity in the development of a mathematical model for a catalytic reformer with many reactions taking place, only those with significant reaction rate are considered. As a consequence, only the following 4 major reactions are considered:
(I) 𝐶𝐻4+ 2𝑂2 → 𝐶𝑂2 + 2𝐻2𝑂 (II) 𝐶𝐻4+𝐻2𝑂 ↔ 𝐶𝑂+ 3𝐻2 (III) 𝐶𝑂+𝐻2𝑂 ↔ 𝐶𝑂2 +𝐻2 (IV) 𝐶𝐻4+ 2𝐻2𝑂 ↔ 𝐶𝑂2 + 4𝐻2
The reaction I in the array of Eqs. (3.1) represents the oxidation reaction. Reaction II represents partial SR reaction while reaction IV is the complete SR reaction. Equation III is the water gas shift(WGS) reaction which converts Carbon Monoxide to Hydrogen and Carbon Dioxide. The thermal energy generated as a consequence of the oxidation reaction serves to initiate and sustain the endothermic SR reactions.
3.1.2 Reaction Rate Equations
Xu and Froment [19], were one of the forerunners in studying the chemical kinetics of steam reactors. Their experimental work lead to the derivation of intrinsic rate equations for the calculation of reaction rates for steam reforming reactions of Methane. Thorough thermodynamic analysis helped them in reducing the number of possible mechanisms avail-able for the reacting species. These generic expressions were in the terms of accessible gas phase partial pressures and contained a denominator resulting from the adsorption of react-ing species on the surface of the catalyst.
In 1996, Ma et al. [20] studied the catalytic oxidation of methane experimentally in order to derive expressions for calculating the rate of partial oxidation reactions which form an integral part of auto-thermal reformers reaction scheme (Eq.(3.1)). These expressions were comparatively similar to those derived by Xu and Froment during their experiments on steam reforming although the oxidation reactions being unidirectional in nature did not contain an equilibrium constant term.
The subsequent modeling work carried out by many researchers made use of these rate expression. The rate expressions for methane have been presented in numerous literary works [22, 26, 44, 45, 47–50]. The rate expressions corresponding to the reactions pre-sented in Eq. (3.1) are as follows:
(I) 𝑅1 = 𝑘1
𝑝𝐶𝐻4 𝑝 1/2 𝑂2
(
1+𝐾𝐶
𝐶𝐻4𝑝𝐶𝐻4+𝐾𝑂𝐶2𝑝 1/2 𝑂2
)2 (II) 𝑅2 = 𝑝𝑘22.5
𝐻2 (
𝑝𝐶𝐻4𝑝𝐻2𝑂−
𝑝3 𝐻2𝑝𝐶𝑂
𝐾𝑒2 )
1 𝑄2
𝑟
(III) 𝑅3 = 𝑝𝑘𝐻3
2 (
𝑝𝐶𝑂𝑝𝐻2𝑂−
𝑝𝐻2𝑝𝐶𝑂2
𝐾𝑒3 )
1 𝑄2
𝑟
(IV) 𝑅4 = 𝑝𝑘34.5 𝐻2
(
𝑝𝐶𝐻4𝑝
2 𝐻2𝑂−
𝑝4 𝐻2𝑝𝐶𝑂2
𝐾𝑒4 )
1 𝑄2
𝑟
(3.3)
Where𝑄𝑟= (
1 +𝐾𝐶𝐻4𝑝𝐶𝐻4 +𝐾𝐶𝑂𝑝𝐶𝑂+𝐾𝐻2𝑝𝐻2 +
𝐾𝐻2𝑂𝑝𝐻2𝑂
𝑝𝐻2 )
𝑅𝑗 (kmol/kgcat h) is the rate of reaction𝑗;
𝑘𝑗 =𝑘𝑜𝑗𝑒−𝐸𝑗/𝑅𝑇 is kinetic rate constant of reactions𝑗 (𝑘1 is from Ma et al. and𝑘2,𝑘3 and
𝑘4are from Xu and Froment );
𝑝𝑖 (bar) is the partial pressure of gas species𝑖.
𝑘𝑜𝑗 is a constant,𝐸𝑗 (kJ/kmol) is the activation energy,
𝑅(kJ/kmolK) is the universal gas constant;
𝑇 (K) is the gas temperature in the reaction zone;
𝐾𝑒𝑗 is the equilibrium constant of reaction𝑗 (𝑗 = 2 to 4)
𝐾𝐶
𝑖 =𝐾𝑜𝑖𝐶𝑒−Δ𝐻
𝐶
𝑖 /𝑅𝑇 is the adsorption constant of species𝑖(𝑖=𝐶𝐻4,𝑂2) in reaction (1);
𝐾𝑖 = 𝐾𝑜𝑖𝑒−Δ𝐻𝑖/𝑅𝑇 is the adsorption constant of species 𝑖 (𝑖 = 𝐶𝑂, 𝐻2, 𝐶𝐻4, 𝐻2𝑂) in reactions (2 to 4).
The above equations have been taken from Chan et al. [44].
3.1.3 Oxygen to Carbon (O/C) Ratio and Steam to Carbon (S/C) Ratio
The O/C and S/C ratios are very important quantities that influence the composition of the ATR exhaust gases and consequently the overall efficiency of the system. Varying either of these two quantities can greatly impact the composition of the exhaust gases as well as the working conditions of the ATR. In addition to this, these quantities can also promote detrimental coke/carbon depositions, if used in the wrong proportions.
regardless of the S/C ratio. But for practical purposes both O/C and S/C ratios must be maintained at a set level. Figures 3.3 and 3.4 show the effect of S/C and O/C ratios on the Hydrogen yield and carbon formation respectively. It is evident from the figures that a steam to carbon ratio of over 1.5 and an oxygen to carbon ratio of around 0.67 need to be maintained for efficient problem-free operation of an ATR.
Figure 3.3: Effect of S/C ratio and A/C ratio (A/C=(O/C)/4) on Hydrogen yield(Figure courtesy:[51])
3.2 Preliminary Model
3.2.1 Kinetic Model
A preliminary model of a methane based ATR was constructed in order to serve as a plat-form to build more complex models. As mentioned in earlier sections, methane is the most widely studied fuel for ATRs. The chemical reactions and reaction kinetics have also been presented in the previous sections. The following tables 3.1, 3.2, 3.3 provide values for the quantities discussed in Eqs. (3.2, 3.3).
Table 3.1: Kinetic Parameters[44] Reaction 𝑘𝑜𝑗(kmol/kgcat h) 𝐸𝑗 (kJ/kmol)
1 5.852𝑋1017𝑏𝑎𝑟−1.5 204000 2 4.224𝑋1015𝑏𝑎𝑟0.5 240100 3 1.955𝑋106𝑏𝑎𝑟−1 67130 4 1.020𝑋1015𝑏𝑎𝑟0.5 243900
Table 3.2: Equilibrium Constants[44] Reaction Equilibrium constant𝐾𝑒𝑗
2 5.75𝑋1012𝑒𝑥𝑝(−11476/𝑇) 3 1.26𝑋10−2𝑒𝑥𝑝(4639/𝑇) 4 7.24𝑋1010𝑒𝑥𝑝(−21646/𝑇)
Table 3.3: Adsorption Constants[44]
Species 𝐾𝑜𝑖(𝑏𝑎𝑟−1) Δ𝐻𝑖(kJ/kmol)
𝐶𝐻4(Oxidation) 4.02𝑋105 103500
𝑂2(Oxidation) 5.08𝑋104𝑏𝑎𝑟0.5 66200
𝐶𝐻4 6.65𝑋10−4 -38280
𝐶𝑂 8.23𝑋10−5 -70650
𝐻2 6.12𝑋10−9 -82900
𝐻2𝑂 1.77𝑋105𝑏𝑎𝑟 88680
𝑟𝐶𝐻4 = −𝜂1𝑅1−𝜂2𝑅2−𝜂4𝑅4
𝑟𝑂2 = −2𝜂1𝑅1
𝑟𝐶𝑂2 = 𝜂1𝑅1+𝜂3𝑅3+𝜂4𝑅4
𝑟𝐻2𝑂 = 2𝜂1𝑅1−𝜂2𝑅2−𝜂3𝑅3−2𝜂4𝑅4
𝑟𝐶𝑂 = 𝜂2𝑅2−𝜂3𝑅3
𝑟𝐻2 = 3𝜂2𝑅2+𝜂3𝑅3 + 4𝜂4𝑅4
(3.4)
where 𝜂1, 𝜂2, 𝜂3 and 𝜂4 are various effectiveness factors [53] used to account for intra-particle mass transport limitations [19]. 𝑟𝑖 in the Eq. (3.4) is the conversion rate for gas species𝑖.
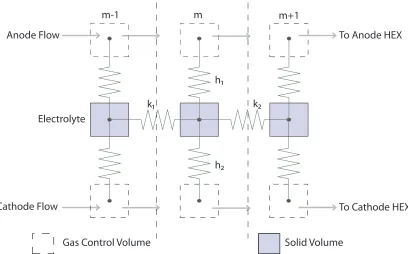
3.2.2 Reactor Model
To model the ATR one solid volume and one gas CV are necessary. The reformate flow volume is a generic Gas control volume with chemical reactions.
Reformate Flow
Gas Control Volume Solid Volume{Catalyst Bed} h
k1 k2
m-1 m m+1
The chemical reactions, both oxidation and steam reforming reaction which have been put forth in the previous chapters 3.1 and 3.2.1, take place in the gas control volume. The oxidation reactions are assumed to take place on the catalyst surface. Consequently, the heat released during this reactions is absorbed by the solid control which in turn transfers it gas control volume via. convective heat transfer. Fig. (3.5) describes the same graphically. It has to be noted that the figure depicts a 1-D discretised model.
The species mass balance equations for a lumped ATR model derived from Eq. (2.5), Eq. (3.1) and Eq. (3.4) is presented below in Eq. (3.5):
𝑑
𝑑𝑡(𝑁𝐶𝑉𝒳𝐶𝐻4,𝐶𝑉) = 𝑁˙𝑖𝑛𝒳𝐶𝐻4,𝑖𝑛−𝑁˙𝑜𝒳𝐶𝐻4,𝐶𝑉 +𝑟𝐶𝐻4
𝑑
𝑑𝑡(𝑁𝐶𝑉𝒳𝐶𝑂,𝐶𝑉) = 𝑁˙𝑖𝑛𝒳𝐶𝑂,𝑖𝑛−𝑁˙𝑜𝒳𝐶𝑂,𝐶𝑉 +𝑟𝐶𝑂 𝑑
𝑑𝑡(𝑁𝐶𝑉𝒳𝐶𝑂2,𝐶𝑉) = 𝑁˙𝑖𝑛𝒳𝐶𝑂2,𝑖𝑛−𝑁˙𝑜𝒳𝐶𝑂2,𝐶𝑉 +𝑟𝐶𝑂2
𝑑
𝑑𝑡(𝑁𝐶𝑉𝒳𝐻2,𝐶𝑉) = 𝑁˙𝑖𝑛𝒳𝐻2,𝑖𝑛−𝑁˙𝑜𝒳𝐻2,𝐶𝑉 +𝑟𝐻2
𝑑
𝑑𝑡(𝑁𝐶𝑉𝒳𝐻2𝑂,𝐶𝑉) = 𝑁˙𝑖𝑛𝒳𝐻2𝑂,𝑖𝑛−𝑁˙𝑜𝒳𝐻2𝑂,𝐶𝑉 +𝑟𝐻2𝑂
𝑑
𝑑𝑡(𝑁𝐶𝑉𝒳𝑁2,𝐶𝑉) = 𝑁˙𝑖𝑛𝒳𝑁2,𝑖𝑛−𝑁˙𝑜𝒳𝑁2,𝐶𝑉
𝑑
𝑑𝑡(𝑁𝐶𝑉𝒳𝑂2,𝐶𝑉) = 𝑁˙𝑖𝑛𝒳𝑂2,𝑖𝑛−𝑁˙𝑜𝒳𝑂2,𝐶𝑉 +𝑟𝑂2
(3.5)
Remembering that the mole fractions always add up to one, summing Eqs.(3.5) gives,
˙
𝑁𝐶𝑉 = ˙𝑁𝑖𝑛−𝑁˙𝑜+
𝑧 ∑
𝑖=1
𝑟𝑖 (3.6)
which is same as Eq. (2.8).
3.3 Preliminary Results and Model Validation
Chan et al. developed a two dimensional heterogeneous ATR model with methane as the feedstock. Their model did not include start up simulations. Thus, the results presented in their literature [44] are obtained as a consequence of the assumption that the system has already reached light-off. Hence, the validation was carried out only to compare the steady state quantities and the settling time needed for the system to reach that steady state. The model was setup to match the inlet flow conditions and the physical parameters presented in their literature [44] which are itemized in Table 3.4.
Table 3.4: Model Parameters
Quantity Reported Value Units
Reactor Length 350 mm
Reactor Diameter 60 mm
Catalyst Used Nickel n/a
Light-off Temperature 750 K
Feed Gas Temperature 400 K
Feed Gas Pressure 1 atm
A/F ratio 3 mol/mol
S/C ratio 1 - 4 mol/mol
Space Velocity 20000 /h
Figures 3.6, 3.7, 3.8, 3.9 show the simulation results. Table 3.5 presents a comparison between the simulation results and those found in literature. It is evident that the results are close to the expected values. The error in the temperature and product concentration can be a result of omitting spatial variation of process parameters and due to some unavailable thermodynamic parameters. In spite of these issues the predictive capability of the validated model is very good.
Figures 3.6 and 3.7 show the distributions of reformed gas (products) temperature and concentrations of𝐻2,𝐻2𝑂,𝐶𝑂and𝐶𝐻4versus time from the initial state with air-to-fuel ratio (A/F) of 3.5, water-to-fuel ratio (W/F) of 1.5 and space velocity (SV) of 20,000/h. The results show that during the first 5 min of the operation, the gas temperature gradually increases with changing of gas concentrations.
Time(sec)
ATR Outlet Gas Temperature
T
emper
a
tur
e(K
)
Light off(750K)
Steady state 1030K
200
100 0
300
200 400
300 500
400 600
500 700
600 800
700 900
800 1000
1100
Figure 3.6: ATR Exhaust Gas Temperature
However, after 5 min of operation, the product temperature and concentrations of the re-formed gases remain almost unchanged, i.e., the process has reached its steady state. With this feed gas condition, the 𝐻2 yield of about 30%, 𝐶𝑂 yield of about 6% and the𝐶𝐻4 residual of about 1% have been achieved. The gas temperature is around 1000 K.
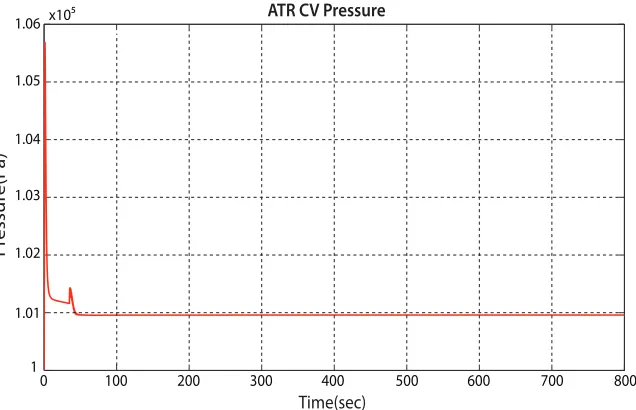
Figure 3.8 shows the variation of pressure during the operation time. Initially the pres-sure rises as a result of the highly exothermic oxidation reaction. Once the system attains light-off temperature approximately at 45s, the pressure also stabilizes in accordance with the temperature and the product concentrations. Under the same inlet gas conditions, the steady state pressure lies in the range of 1atm.
Time(sec)
ATR Product Concentrations
P
roduc
t C
onc
en
tr
a
tion(%)
Steam(17.5%) H
2(27.5%)
CO(7%) CH
4(1.8%)
0 10 20 30 40 50 60 70
100
0 200 300 400 500 600 700 800
Figure 3.7: ATR Product Concentrations
reached at approximately 400s.
Figure 3.9(b) depicts the molar flow rate exhaust gases of ATR. The Oxygen and Methane reduce to almost zero after the initial minute of operation due to the extremely high rate of the oxidation reaction. This in turn generates thermal energy which helps the system reach light-off conditions. After light-off the Hydrogen production increases due to activation of steam reforming reactions.
Table 3.5: Validation Results
Quantity Reported Value Simulation Results
Product Temperature 1010K 1030K
Product Concentration
𝐻2 Around 30% 27.5%
𝐻2𝑂 Around 21% 17.5%
𝐶𝑂 Around 6% 7%
𝐶𝐻4 Around 1% 1.8%
Control Volume Pressure Atmospheric(1.01𝑋105Pa) 1.01𝑋105Pa
Solid Temperature(Catalyst) 1000K 1030K
Time(sec)
ATR CV Pressure
P ressur e(P a) 1 1.01 1.02 1.03 1.04 1.05 1.06 x10⁵ 100
0 200 300 400 500 600 700 800
Figure 3.8: ATR Control Volume Pressure
Time(sec) Time(sec)
ATR Solid Volume Temperature ATR Outlet Flow Rate
Temp er atur e(K) 200 100 0 0 200 400 300 400 600 500 600 800
700 800 00 100
1 2 3 4 5 6x10⁻³
[image:51.612.153.471.112.317.2]200 300 400 500 600 700 800 1000 1200 Steam O2 H2 CO CO 2 CH 4 M o la r fl o w o u t( m o le s /s e c ) Steady State Temperature(1030K) a b
Chapter 4
Jet Propellant 8 (JP-8)
4.1 Introduction to JP-8
During the second world war, the US Military employed Kerosene based fuels due to com-paratively greater availability than Gasoline and Diesel. One such Kerosene based deriva-tive, Jet Propellant-8 also designated as JP-8, is currently widely utilized for military and air force vehicular applications.
extent, for modeling purposes.
4.1.1 JP-8 Surrogate
In light of the discussion put forth in section 4.1, in order for research to be carried out on auto-thermal reforming of JP-8, a surrogate was developed by the Office of Naval Re-search (ONR) [58] to emulate the physical and chemical properties of JP-8. Out of possibly hundreds of combinations, a surrogate composed of three heavy hydrocarbon was found to best represent JP-8. Table 4.1 itemizes these three components, their chemical formulae and molar percentages in the surrogate compound.
Table 4.1: JP-8 Surrogate Composition
Component Chemical Formula Mole Fraction
n-Hexadecane 𝐶16𝐻34 0.54
n-Tridecane 𝐶13𝐻28 0.16
Toluene 𝐶7𝐻8 0.3
As mentioned in section 4.1 all these hydrocarbon compounds are either aromatic or aliphatic hydrocarbons. n-Hexadecane or popularly known as Cetane and n-Tridecane are aliphatic hydrocarbons which exist as clear colorless liquid at room temperature [59, 60]. Toluene or Methylbenzene is an aromatic hydrocarbon [61].
4.2 Auto-Thermal Reforming of JP-8 - Reaction Scheme
taking place, only the reactions which significantly impact the overall reaction dynamics are considered [44]. In other words, only the reactions with faster reaction rates are considered for the purpose of modeling. No complete kinetic model exists for auto-thermal reforming of higher hydrocarbons [62]. Vasilis et al. [29] studied auto-thermal reforming of JP-5 which is very similar to JP-8. They put forth an array of chemical reactions involved with ATR of JP-5. These equations are generic, so, they can be extended to JP-8.
(I) 𝐶𝑛𝐻𝑚+𝑛𝐻2𝑂 ⇌ 𝐶𝑂+
(
𝑛+𝑚
2 )
𝐻2
(II) 𝐶𝑛𝐻𝑚+ 2𝑛𝐻2𝑂 ⇌ 𝑛𝐶𝑂2+ (
2𝑛+𝑚 2 )
𝐻2
(III) 𝐶𝑛𝐻𝑚+𝑝𝐻2𝑂 ⇌ (𝑛−𝑝)𝐶𝐻4+𝑝𝐶𝑂
(IV) 𝐶𝑂+𝐻2𝑂 ⇌ 𝐶𝑂2+𝐻2
(V) 𝐶𝑂+ 3𝐻2 ⇌ 𝐶𝐻4+𝐻2𝑂
(VI) 𝐶𝐻4+ 2𝐻2𝑂 ⇌ 𝐶𝑂2+ 4𝐻2 (VII) 𝐶𝑛𝐻𝑚+𝑛2𝑂2 → 𝑛𝐶𝑂+ 𝑚2𝐻2 (VIII) 𝐶𝑛𝐻𝑚+
(
𝑛+𝑚
4 )
𝑂2 → 𝑛𝐶𝑂2+𝑚2𝐻2𝑂
(4.1)
Equation 4.1 introduces the generic chemical equations involved in auto-thermal re-forming of JP-8. Reactions (I) and (II) are partial SR and complete SR reactions respec-tively. Reactions (III) and (V) represent methanation reactions. Reaction (IV) is the water gas shift reaction which converts carbon monoxide in the presence of steam to hydrogen. Reaction(VII) is the partial oxidation of JP-8. Reaction (VIII) represents total oxidation reaction. Henceforth total oxidation will be referred to as TOX. Reaction (VI) is steam reforming of methane. This reaction has been included to account for methane, that might be generated as an intermediate species. In reaction (III)𝑝= (4𝑛−𝑚)/6.
Table 4.2: List of JP-8 Reactions
Reaction # Reaction Generic Eq.
1 𝐶16𝐻34+ 16𝐻2𝑂 ⇌16𝐶𝑂+ 33𝐻2 (I)
2 𝐶16𝐻34+ 32𝐻2𝑂 ⇌16𝐶𝑂2+ 49𝐻2 (II)
3 𝐶16𝐻34+ 5𝐻2𝑂 ⇌11𝐶𝐻4+ 5𝐶𝑂 (III)
4 𝐶13𝐻28+ 13𝐻2𝑂 ⇌13𝐶𝑂+ 27𝐻2 (I)
5 𝐶13𝐻28+ 26𝐻2𝑂 ⇌13𝐶𝑂2+ 4𝐻2 (II)
6 𝐶13𝐻28+ 4𝐻2𝑂 ⇌9𝐶𝐻4+ 4𝐶𝑂 (III)
7 𝐶7𝐻8+ 7𝐻2𝑂 ⇌7𝐶𝑂+ 11𝐻2 (I)
8 𝐶7𝐻8+ 14𝐻2𝑂 ⇌7𝐶𝑂2+ 18𝐻2 (II)
9 𝐶7𝐻8+ 3.3333𝐻2𝑂 ⇌3.6667𝐶𝐻4 + 3.3333𝐶𝑂 (III)
10 𝐶𝑂+𝐻2𝑂 ⇌𝐶𝑂2+𝐻2 (IV)
11 𝐶𝑂+ 3𝐻2 ⇌𝐶𝐻4+𝐻2𝑂 (V)
12 𝐶𝐻4 + 2𝐻2𝑂⇌𝐶𝑂2+ 4𝐻2 (VI)
13 𝐶16𝐻34+ 8𝑂2 →16𝐶𝑂+ 17𝐻2 (VII)
14 𝐶16𝐻34+ 24.5𝑂2 →


![Figure 5.8: Pump Map (adapted from [2])](https://thumb-us.123doks.com/thumbv2/123dok_us/54603.5018/77.612.94.532.228.504/figure-pump-map-adapted-from.webp)
![Figure 5.10: PV diagram of an ideal Stirling cycle (adapted from [69])](https://thumb-us.123doks.com/thumbv2/123dok_us/54603.5018/79.612.176.442.85.343/figure-pv-diagram-ideal-stirling-cycle-adapted.webp)