Multi-Modal, Multi-Source Reading: A Multi-Representational Reader’s Perspective Shaaron Ainsworth
Learning Sciences Research Institute, School of Education, University of Nottingham, Nottingham, NG8 1BB, U.K.
Abstract
In this commentary, I review the five articles that comprise the Special Issue titled ‘Towards a model of multi-source, multi-modal processing”. The papers are discussed in terms of how they help us understand the “second generational” issues of reader characteristics, representational choices, task demands and assessment approaches. The commentary concludes by anticipating themes for future work that are common to all the papers’ concerns.
Keywords: multi-modal, multiple representations, text comprehension, document integration
1. Introduction
So, here’s an irony: I am currently reading five articles, the majority of which include figures and tables in addition to text, in order to understand the authors’ arguments, theories, methods and findings. I am looking for patterns across the papers, probing for inconsistencies, exploring the extent to which my prior knowledge would have led me to predict the results and generally asking in what ways, individually and together, the papers are advancing the field. I am therefore, I realise quite late in this process, involved in multi-source, multi-modal processing. And do you know what, it’s hard work! With that thought in mind, I have extra sympathy for the participants in these studies. What learners do as they engage in 21st century reading is a complex activity, for which the cognitive,
metacognitive and affective demands are also too easy to overlook when we ask our students to “use the internet to research”. Consequently, I share with the editors and contributing authors of this special edition the sense that this is an important area to research. We need to understand more about how people learn in this way, the challenges that they face and explore what we can do help make such processes more effective, as well as perhaps more enjoyable. However, before turning to these papers, I will stay focused on the processes I went through as a reader for a little while longer, describing how I approached the task given to me, what the strategies were that I thought helped me read and integrate the documents and what challenges I faced along the way.
Step 1. I accepted an invitation to act as commentator in February 2017 having agreed to the role based on a short email and one page abstract. At this point, a less busy point in the academic year for me, I had felt like it sounded fun, that it is always nice to be asked, and that I liked the topic and had relevant expertise. I also had confidence that the authors suggested would produce interesting papers and in any case, the chances were the proposal would be rejected and that I would not have to do anything! But, when the papers were submitted to me, I was now at a very busy time of the academic year. I realised I had significantly under-estimated the amount of work involved and it no longer seemed as fun as it had nine months earlier. Moreover, whilst I had a timeline, I realised I did not have specific instructions and I was free to interpret the required outcomes of this multi-source, multi document integration activity as I wanted; although that I knew a written outcome would be required of me.
role. I was curled up in a chair in the corner of my sitting room, and so was subject to frequent interruptions and needed to ignore my son watching television in the same space. I did not read the papers in any particular order (in retrospect I should have read the introduction first) and my goal at this point was to just understand the papers. I struggled to comprehend some of the points articulated and found understanding the visual representation in the papers a particular challenge. Often, I did not know the specific features of the visual material that learners were using and as usual (and when will this not be required/encouraged at review stage?) I needed to stop reading the text, find a relevant figure at the end of the document and then re-read having lost my place and train of thought.
Step 3. Now things were getting serious. I locked myself away in an office, banished distraction and set about re-reading the printed papers. To support my task of integration and synthesis, I created a (digital) table. It had a column for each paper, and rows for goals, method, contexts, theories, strengths, concerns, and such. As I read through the papers, I would add comments to the table, occasionally editing the table to add new rows (and hence revisit “finished” papers to find their respective entries). As I did so, I also kept brief cryptic notes about themes and emergent issues, seemingly supported the patterns I saw emerging from the table (e.g., they all contrast deep versus surface approaches, all the participants, with one exception, are undergraduate students.)
Step 4. I decided to read some other commentary papers from previous special issues. I did not print them but read online and pretty quickly. Although I had read and enjoyed many commentaries over the years, I had not until given this task, thought about what the parameters are on such a
commentary. So, I decided that looking at other papers, seeing their approaches may give me a sense of what the “rules” are or even good models to “steal”. In addition, I refreshed my prior knowledge by re-reading other papers that I had previously found helpful and was in particular very pleased to find a paper from Rouet, Britt and Diruk (2017), which updated their previous model MD-TRACE model (Rouet & Britt, 2011); one which I find very helpful. I also noticed that my fellow commentator was already at work as I saw messages from the shared cloud storage for the special edition.
Step 5. I developed a second table, Table 1 below, as the structure for the commentary and I started to write this paper. I had both the tables and thematic notes to hand (on a computer) surrounded by the printed, now annotated papers, so I could flick back to them and check the accuracy of points I wanted to make. There was also a plan to which I referred occasionally and revised until, with relief, this commentary was finalised. The ultimate step of deciding if this comprehension and integration were sufficient, and whether I have fulfilled the remit, I have to leave to others.
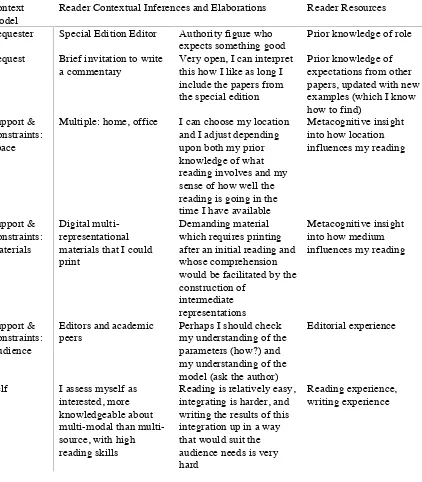
Table 1. A RESOLV based description of the role of the writer of a commentary Context
Model
Reader Contextual Inferences and Elaborations Reader Resources Requester Special Edition Editor Authority figure who
expects something good
Prior knowledge of role Request Brief invitation to write
a commentary
Very open, I can interpret this how I like as long I include the papers from the special edition
Prior knowledge of expectations from other papers, updated with new examples (which I know how to find)
Support & Constraints: Space
Multiple: home, office I can choose my location and I adjust depending upon both my prior knowledge of what reading involves and my sense of how well the reading is going in the time I have available
Metacognitive insight into how location influences my reading
Support & Constraints: Materials
Digital multi-representational materials that I could print
Demanding material which requires printing after an initial reading and whose comprehension would be facilitated by the construction of
intermediate representations
Metacognitive insight into how medium influences my reading
Support & Constraints: Audience
Editors and academic peers
Perhaps I should check my understanding of the parameters (how?) and my understanding of the model (ask the author)
Editorial experience
Self I assess myself as interested, more knowledgeable about modal than multi-source, with high reading skills
Reading is relatively easy, integrating is harder, and writing the results of this integration up in a way that would suit the audience needs is very hard
Reading experience, writing experience
2. Reflecting on Themes from the Individual Papers
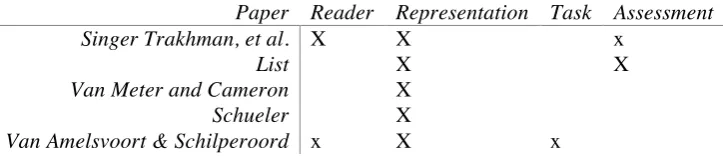
Table 2. The five articles in the special edition categorised according to my interpretation of their focus.
Paper Reader Representation Task Assessment
Singer Trakhman, et al. X X x
List X X
Van Meter and Cameron X
Schueler X
Van Amelsvoort & Schilperoord x X x
Note: X indicates that I consider this a major theme and x a minor theme.
The article by Singer Trakhman, Alexander and Silverman (this issue) explores reader characteristics in terms of patterns of reading that people adopt in relation to representational characteristics; in this case, the medium that instantiates the text. They uncovered four different profiles of readers, named in a way I feel is affectionate not pejorative, Plodders, Samplers, Gliders, and Regulators. These profiles were found for both online and print reading. Regulators (who engaged in deeper processing
behaviour) and Gliders (fluent linear text readers) showed better understanding of the text, and better insight into this understanding whether this was printed or digital. Overall, reading paper and not online material resulted in better scores on assessments that required detailed understanding. One of the most intriguing findings was the extent to which people read the texts similarly or
differently across the two mediums. According to Figure 5, approximately 40% of the people read in the same way across the medium whereas 60% swapped to a different profile. Moreover, based upon their finding that Gliders and Regulators had better comprehension and calibration than Samplers and Plodders, it seemed that 57% adopted an equally successful approach across both medium whereas 25% adopted a worse strategy online and 18% a better one. Of course, there are more ways to be different than the same, none the less the numbers switching are strikingly high given the similarity of the texts, the same task instructions and same wider physical context. One thing we do not know from these data is why people adopted a new strategy.
Using the RESOLV model, one could ask did the medium cue a different pre-existing schema that somewhat automatically led students to adopt a different strategy, or was it simply doing the task for a second time? If so, what was it about their prior experience that led them to this new approach? Did they have the same goals in mind both times or did they interpret the task differently in the different medium? It would have been very interesting to have asked the participants to describe what they thought they were doing in each condition and why, in order to gain direct insight into the task models they created. It might also have been useful to explore prior knowledge; for example, are readers more likely to plod when faced with new unfamiliar material? It could also be worthwhile to link this research to work that has taken a person-centred approach to the analysis of personal epistemologies (e.g., Ferguson & Bråten, 2013) to explore if readers’ beliefs about knowledge and knowing are reflected in their reading profiles.
As a representation-focussed researcher, it would certainly be interesting to see how these profiles apply if the task had been a multi-representational one with participants engaging with materials that included a variety of visual representations in addition to text. Previous research on such (digital) material does support a distinction between successful learners who frequently integrate text and picture (high integrators) and less successful who do not (Mason, Tornatora & Pluchino, 2013). One might predict that Regulators would be most likely to be high integrators. Unfortunately, what the existing research suggests is that all too frequently people do not make effective use of visual
In reference to my task of reading for the commentary, happily I chose to print papers to read when the task demands required deeper detailed reading, a choice that is supported by the findings of this study. But I also note that my extended reading activity required me to engage with the texts in multiple ways, I began as a Glider (Step 2), became a Regulator (Step 3) and then at Step 4 and Step 5 spent time as both a Sampler and a Glider. These choices seem to me to be strategic, based upon my understanding of the tasks demands at different stages of the reading as well as my metacognitive and self-regulatory skills. The readers in Singer Trakhmen et al. only read for an average of 10 minutes with a single source at a time. It seems plausible to speculate that in more authentic reading situations such profiles may not be stable across a medium and an individual, but more fluid as the reader interprets and reinterprets the task to form a new model of what is required.
List (this issue) similarly addresses the strategies undergraduates use when asked to comprehend and integrate information presented via “video” or text (I assume digital). Each participant reported upon the strategies they used and these were associated with outcome scores on measures of comprehension and integration. Overall, the “video” condition supported comprehension (as measured by open ended questions) but there were no representational effects on integration, perhaps as the author speculates because on the whole participants did not engage in much integration. For me, the most useful aspects of the paper were the findings concerning the negative relation between notetaking and integration and the positive benefits of elaboration. I was also intrigued by the way that certain representations may cue specific strategies more than others.
Nonetheless, as a multi-representational researcher I did struggle with some aspects of this study. One common problem for those of us who research non-textual representations, such as diagrams, images, pictures, graphs, photographs, illustrations, animations, or video is that there no standard taxonomy upon which we draw. So, what to one researcher is a picture, another would call it an image, another an illustration, yet another a diagram and so it goes on. Some researchers adopt an approach based on modality (e.g., visual or textual; e.g., Mayer, 2005) whereas others their dynamism (static v dynamic, e.g., Hoffler & Leutner, 2009); however, for me, these binaries obscure important differences between representations. Consequently, I am drawn towards more fine-grained structural taxonomies of representations such as that of Bertin (1983) or Lohse, Biolsi, Walker, and Rueler (1994) who propose 11 different types of graphic (static) representation.
The representations used in this research I would prefer to call an animation or a narrated animation using Betrancourt and Tversky’s (2000) broad definition: “computer animation refers to any application which generates a series of frames, so that each frame appears as an alteration of the previous one, and where the sequence of frames is determined either by the designer or the user” (p. 313). As with Mayer and Moreno (2002), I use video to refer to dynamic visual representations that have been filmed not drawn. This keeps the distinction for moving images that we recognise between photograph and a picture. Is this definitional worry worth the effort? I think so, as there are a number of existing studies on the strategies that people use to learn from animation (e.g. Lewalter, 2003; Kombartzky, Ploetzner, Schlag & Metz, 2010) within which this new paper can now be helpfully integrated. Moreover, in the absence of a universally agreed upon taxonomy (and I will not be holding my breath) this indicates the importance of providing fine grained descriptions of our representations, examples in the printed papers and ideally links to supplementary online material (if copyright allows) where the representations used can be made available to all. As Van Amelsvoort and Schilperoord (this issue) and many others show, relatively subtle differences between representational design choices can have significant impact upon what people attend to and how they learn.
the visual aspects of the source would have resulted in 1000s more words and many choices would have had have to been made. This is a frequently unacknowledged issue in learning with multiple representations; that informational equivalence is determined by the authors who have decided what they think are the important aspects of the visual representation to be included in the analysis. Thus, we can say “the penguin is on the iceberg” but the visual depiction has to commit to, at least, the size of the penguin and iceberg, their colour, the position of the penguin and the iceberg, the penguins’ eyes, beak, and the amount of pectoral shading (e.g., Schnotz & Bannert, 2003; Stenning &
Oberlander, 1995). Consequently, it’s important to recognise there were unavoidable content as well as form differences between the two conditions that may have influenced readers’ strategies and their learning outcomes. For example, Ainsworth and Loizou (2003) argued that differences they found in students’ use of the self-explanation strategies when learning about the cardio-vascular system through text or diagrams were in part due to the specific/depictive nature of the visual representations used.
What does this study have to say to my task? Well, I am glad I limited my notetaking to very brief sketchy forms and did search for main ideas and connect with prior knowledge. However, I can see that my strategies are very dependent upon whether I was at an earlier stage of comprehension or a later stage of integration. And I did know from the start that I would be required to integrate the documents – something the participants in List (this issue) did not find out until after they had finished studying. It might have been interesting to explore with these participants directly how they interpreted the request and consequently what context and task models they created. Without prior warning that they would be expected to integrate the two sources, I suspect most participants would not have been explicitly attending to integration.
Van Meter and Cameron (this issue) provided undergraduates with four digital historical documents to read and integrate: two solely textual, one solely visual (a photograph) and one, a combination of text and visual in the form of a political cartoon. They were also provided with a paper blank matrix (a table) to complete, with one row for each document and columns that corresponded to “historical thinking heuristic”. Participants were more likely to make notes on texts than on the other
representations. Thus, note taking, in addition to prior work with eye tracking, verbal protocols and outcome studies support the inference that readers do not attend as equally and actively to visual representations as they do textual ones. An even more intriguing finding was that the content of these notes were more affective when generated from visual representations.
Here again this multi-representational researcher ran up against terminology. It is certainly helpful to know the form the visual representations took as this gets closer to the fine-grained description I look for, but I did struggle with the use of the term “verbal” as for me this typically is associated with spoken not written text. In the draft I worked from, there was also an inconsistency between the paper’s use of the term, within the main body of the document using verbal whereas the tables used the term text. I did not experience that as a “desirable difficulty” (see Schüler, this issue). However, as above, I also wanted to know more about the representations (“show me what you showed them”) especially in terms of content of the representations rather than just their form. Would a written description of (some of) the content of the photograph/political cartoons have prompted the same reduction in note taking and the same increase in affective response? What if they were in colour or black or white? A focus on faces or seen from a distance? The authors of this material originally developed the representations presumably making strategic decisions about their form and content. How much did the learners respond to these decisions in their construction of their context and task models and how much did they impose their own pre-existing context schemas?
notes from the figures there was no affective component, indeed my only affective response (which I won’t share) was prompted by text.
Schüler (this issue) uses measures of gaze behaviour to explore whether and how presenting
information that was inconsistent across multiple pages of a multi-modal source influenced learner’s activities. Although representational form (with or without explanatory pictures) was included as a factor, the main focus of the manipulation was on representational content (i.e., whether a key aspect of information was consistent or inconsistent). The results confirmed that the visual behaviour of readers changed when they received inconsistent information; they clearly noticed the contradiction and attempt to resolve it over multiple phases of reading. This paper shows an interesting application of a paradigm frequently used in text comprehension research and the results could form the basis of new research studies specifically focussed on issues concerning multi-source integration. In this study, the inconsistency in content was between pages but consistent over representations. What if the pictures and the text contradicted one another? Rinck (2008) found that readers took longer to read multimedia (and specific figures) if the text and graphs were inconsistent and they had less confidence in their memory for the material. But I further wonder if there was an inconsistency, which would they believe? My prediction based upon the multi-representational literature suggests that it may be the text that is seen as the “truth”.
When I was reading, any inconsistencies within articles was, I am sure, accidental not deliberate. However, across the set there were many inconsistencies with authors using their own descriptions and terminology based upon different theoretical frameworks. For example, I do not think notetaking in Van Meter and Cameron’s (this issue) is the same as notetaking in List (this issue). Consequently, notetaking using the structured matrix may well be helpful not harmful for the participants in Van Meter and Cameron (this issue) as I suspect it’s actually closer to “identifying important information” in List. As a commentator, being required to deeply process (be a Regulator), all these minor changes did not cause me confusion. I remembered how the terms were used in specific articles and hence my model included not just the context but also its source in ways that are consistent with the readers in Braasch, Rouet, Vibert, and Britt (2011). But I do wonder about others who will read this Special Edition when published, presumably in a less effortful manner appropriate to their specific goals. The final paper by Van Amelsvoort & Schilperoord takes a rather a different approach as they explore whether perceptual characteristics influenced the processing of argumentative diagrams. For me, this is long overdue research as I find that all too often research that has focussed on representations that I call “spatially-organised text” (i.e. node and link diagrams such as argument diagrams, mind maps, concepts map) has often focuses solely on the content but not the form of the representation. Their research shows that in the absence of content, form plays a big part in how people make judgements. However, even when argumentative diagrams were instantiated with textual content, perceptual features still played some role in their thoughts, especially when processing them quickly. As the authors themselves point out though, it may be the perceptual feature number is actually content in disguise. Future work could explore this and other perceptual features (e.g., area, colour, or shape of box?) to see how such aspects of representations interact with their content. And in terms of my task, well there was not too much relevance. Much to my continued amusement, even those who argue for the value of argumentative diagrams tend not to use the graphical abstract option in the journal articles they write.
3. Integrating and Looking Forward
All the research was conducted in a controlled, simplified or artificial context. Of course, such control was needed to capture the fine-grained process data that were so informative. But, the readers were reading neither out of intrinsic interest nor even for class requirements but because they were taking part in a study. They may not have known what the purpose of their reading was and may have engaged in atypical reading processes because of task demands (e.g., following their reading with a cursor or pencil). Therefore, how their reading and integration strategies would generalise to
situations that have such different request, requester, supports and constraints is an open question. My task could not have been more different in that sense and in its own way probably just as atypical (it is rare I suspect to dedicate over a week of one’s life to reading and writing about five papers).
Nonetheless, there were many things I did that would not have been uncovered in studies such as these, such as additional reading of multiple sources, developing my own model of the assessment demands, or moving between location and mediums as my metacognitive insight suggested, that may be important aspects of real world multi-document multi-modal reading.
A second factor that was vivid to me but absent from the articles was affective and social aspects of such reading. I experienced joy, anxiety, irritation, pride, fear and satisfaction as I read and wrote. Whilst I am aware that some of the authors in this special edition have previously written about the affective aspects of such reading (List & Alexander, 2017), this was not a theme within any of the articles. It is possible again that the artificial context of studies did not bring this to the fore. However, this could be an area for joint productive research in the future as models of multimedia learning are also expanding to include affective and motivational aspects (Moreno & Mayer, 2007) in ways that have direct relevance to many of the papers in this special edition. For example, Plass et al. (2014) manipulate similar factors to Van Amelsvoort and Schilperoord (this issue) but to see the effect upon emotion not judgement. Social aspects of multi-modal reading were also present in my task (dealing with interruptions, noticing the other commentator was working, discussing with one of RESOLV’s authors the model as well as my understanding of it and talking with colleagues about this
commentary and the papers). The sequestered nature of the reading in studies in this special edition do not easily permit such activities and here again the multi-representational literature is replete with examples from multiple theoretical perspectives about the roles, processes and value of representation in social interaction (e.g. Kozma, Chin, Russell, & Marx, 2000; White & Pea, 2011).
A final theme that I see emerging is what a complicated task it is to understand the factors that influence multi-document, multi-modal reading. I classified the articles in terms of how they addressed reader, representation, task or assessment factors but within anyone of those factors there are multiple aspects to consider. To highlight a single example, within representation, the modality, form, dynamism, content, and two perceptual features were all addressed. Moreover, both Van Meter and Cameron’s (this issue) readers and I also created new representations (such as tables) to
understand the papers drawing attention to the construction as well as interpretation of such forms. A real challenge for researchers going forward is how we can build integrative theoretical accounts that are sensitive to such micro-level features of multiple documents (such as the size of textbox within a document) with more macro-features such as readers’ epistemologies and their motivations for reading.
4. Acknowledgements
My thanks to Jean-Francois Rouet, Jonathan Halls and Robert Whyte for their helpful comments on the first draft of this paper.
5. References
Ainsworth, S.E and Loizou, A. (2003). The effects of self-explaining when learning with text or diagrams. Cognitive Science, 27(4), 669-681. doi: 10.1207/s15516709cog2704_5
Bertin, J. (1983). Semiology of graphics: Diagrams, networks, maps (w.J. Berg trans). Madison, WI: University of Madison Press.
Bétrancourt, M., & Tversky, B. (2000). Effect of computer animation on users’ performance: A review. Le Travail Humain, 63(4), 311-330.
Braasch, J.L.G., Rouet, J.-F., Vibert, N., & Britt, M.A. (2011). Readers’ use of source information in text comprehension. Memory and Cognition, 40, 450-465. doi: 10.3758/s13421-011-0160-6. Ferguson, L. E., & Bråten, I. (2013). Student profiles of knowledge and epistemic beliefs: Changes
and relations to multiple-text comprehension. Learning and Instruction, 25, 49-61. doi:10.1016/j.learninstruc.2012.11.003
Goldman, S. R. (2003). Learning in complex domains: When and why do multiple representations help? Learning and Instruction, 13(2), 239-244. doi:10.1016/s0959-4752(02)00023-3 Hannus, M., & Hyona, J. (1999). Utilization of illustrations during learning of science textbook
passages among low- and high-ability children. Contemporary educational psychology, 24(2), 95-123. doi:DOI 10.1006/ceps.1998.0987
Hoffler, T. N., & Leutner, D. (2007). Instructional animation versus static pictures: A meta-analysis. Learning and Instruction, 17(6), 722-738. doi:10.1016/j.learninstruc.2007.09.013
Kombartzky, U., Ploetzner, R., Schlag, S., & Metz, B. (2010). Developing and evaluating a strategy for learning from animations. Learning and Instruction, 20(5), 424-433.
doi:10.1016/j.learninstruc.2009.05.002
Kozma, R., Chin, E., Russell, J., & Marx, N. (2000). The roles of representations and tools in the chemistry laboratory and their implications for chemistry learning. Journal of the Learning Sciences, 9(2), 105-143. doi:DOI 10.1207/s15327809jls0902_1
Lewalter, D. (2003). Cognitive strategies for learning from static and dynamic visuals. Learning and Instruction, 13(2), 177-189. doi:10.1016/S0959-4752(02)00019-1
List, A. (this issue) Strategies for Comprehending and Integrating Texts and Videos. Learning and Instruction
List, A., & Alexander, P. A. (2017). Cognitive affective engagement model of multiple source use. Educational Psychologist, 52(3), 182-199. doi:10.1080/00461520.2017.1329014
Lohse, G. L., Biolsi, K., Walker, N., & Rueter, H. H. (1994). A classification of visual
representations. Communications of the Acm, 37(12), 36-49. doi:Doi 10.1145/198366.198376 Mason, L., Tornatora, M. C., & Pluchino, P. (2013). Do fourth graders integrate text and picture in
processing and learning from an illustrated science text? Evidence from eye-movement patterns. Computers & Education, 60(1), 95-109. doi:10.1016/j.compedu.2012.07.011 Mayer, R. (2005). The cambridge handbook of multimedia learning. New York: Cambridge
University Press.
Moreno, R., & Mayer, R. (2007). Interactive multimodal learning environments. Educational psychology review, 19(3), 309-326. doi:10.1007/s10648-007-9047-2
Plass, J. L., Heidig, S., Hayward, E. O., Homer, B. D., & Um, E. (2014). Emotional design in multimedia learning: Effects of shape and color on affect and learning. Learning and Instruction, 29, 128-140. doi:10.1016/j.learninstruc.2013.02.006
Rinck, M. (2008). The interaction of verbal and pictorial information in comprehension and memory. In J-F. Rouet, W. Schnotz, & R. Lowe (Eds.). Understanding Multimedia Documents (pp. 185-200). New York: Springer.
Rouet, J. F., & Britt, M. A. (2011). Relevance processes in multiple document comprehension. In M. T. McCrudden, J. P. Magliano, & G. Schraw (Eds.), Text relevance and learning from text (pp. 19-52). Charlotte, NC:Information Age Publishing.
Rouet, J. F., Britt, M. A., & Durik, A. M. (2017). Resolv: Readers' representation of reading contexts and tasks. Educational Psychologist, 52(3), 200-215. doi:10.1080/00461520.2017.1329015 Schnotz, W., & Bannert, M. (2003). Construction and interference in learning from multiple
Schüler, A. (this issue) The Integration of Information in a Digital, Multi-Modal Learning Environment. Learning and Instruction.
Schwonke, R., Berthold, K., & Renkl, A. (2009). How multiple external representations are used and how they can be made more useful. Applied Cognitive Psychology, 23(9), 1227-1243. doi:10.1002/acp.1526
Singer Trakhman, L.M., Alexander, P.A. & Silverman, A.B. (this issue)Profiling Reading in Print And Digital Mediums. Learning and Instruction.
Stenning, K., & Oberlander, J. (1995). A cognitive theory of graphical and linguistic reasoning - logic and implementation. Cognitive Science, 19(1), 97-140. doi:DOI
10.1207/s15516709cog1901_3
Amelsvoort. M., & Schilperoord, J. (this issue) How number and size of text boxes in argument diagrams affect opinions
Van Meter, P.M., & Cameron, C. (this issue) The Effects of Presentation Format on Multiple Document Notetaking. Learning and Instruction