Supplementary Information
A Solid-state NMR Method for Structure Solution of Zeolite
Crystal Structures
Darren H. Brouwer,† Richard J. Darton,‡ Russell E. Morris,‡ and Malcolm H. Levitt†,*
†School of Chemistry, University of Southampton, Southampton, SO17 1BJ, UK and ‡School of
Chemistry, University of St. Andrews, St. Andrews, KY16 9ST, UK
OUTLINE
1. Solid-state NMR pulse sequence 2. Calculation of double-quantum curves
2.1 Double-quantum curves for two-spin systems 2.2 Full double-quantum curves
3. Structure solution algorithm
3.1 Definition of least-squares minimum 3.2 Grid Search
3.3 Least squares minimization
3.4 Structure completion and distance least-squares 4. Structure determination of zeolite test sample 1
4.1 Synthesis 4.2 Powder XRD 4.3 Solid-state NMR
4.4 Structure solution by solid-state NMR
4.5 Structure completion and refinement against powder XRD data 4.6 Structure solution from powder XRD
5. Structure determination of zeolite test sample 1 5.1 Synthesis
5.2 Powder XRD 5.3 Solid-state NMR
5.4 Structure solution by solid-state NMR
1. Solid-state NMR pulse sequence
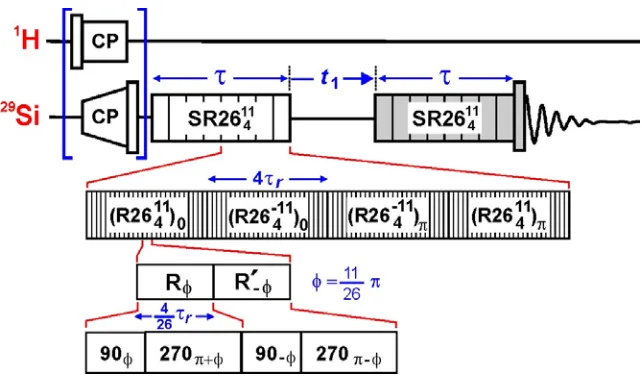
The pulse sequence diagram of the solid-state NMR experiment used to probe the internuclear
distances between 29Si – 29Si spin pairs in pure silica zeolite frameworks is displayed in Figure S1. The
experiment employs the symmetry-based homonuclear dipolar recoupling sequence SR26411 to excite
[image:2.612.146.467.241.429.2]and reconvert double-quantum (DQ) coherences between dipolar coupled 29Si nuclei.1
Figure S1. Pulse sequence diagram for two-dimensional 29Si double-quantum correlation
spectroscopy using the SR26411 dipolar recoupling sequence.
The SR26411 dipolar recoupling sequence2 is a supercycled version of a RNnν sequence3 and is of
the form
SRNnν = (RNnν)0 (RNn−ν)0 (RNn−ν)π (RNnν)π
with N = 26, n = 4, and ν = 11. RNnν denotes the symmetry-based pulse sequence given by
where R is a composite π pulse that rotates the spins by ±π about the x-axis and R´ is derived from R
by changing the signs of all phases. The subscript φ denotes the overall r.f. phase shifts of the R
elements and is given by
φ = πν/N
while the superscript N/2 denotes the number of repetitions of the bracketed elements. In the present
case, the R element is the composite π pulse
R = R´ = (π/2)0(3π/2)π.
The r.f. field strength is set so that one RNnν sequence occupies exactly n rotor periods. With this
particular R element, the r.f. field strength must be set to exactly N/n times the spinning frequency.
The SR26411 sequence can be written explicitly as
[9076.15 270256.15 90283.85 270103.85]13 [90283.85 270103.85 9076.15 270256.15]13
[90103.85 270283.85 90256.15 27076.15]13 [90256.15 27076.15 90103.85 270283.85]13
where the subscripts are the phases of the pulses (in degrees) while the superscripts denote 13
repetitions of the bracketed elements. One complete supercycle spans 16 rotor periods and requires an
r.f. field strength that provides a nutation frequency which is exactly 6.5 times the spinning frequency.
The SR26411 recoupling sequence is incorporated into a 2D DQ correlation experiment as
follows. If 1H→29Si cross polarization is employed, a 90° pulse is applied after ramped cross
polarization to generate longitudinal magnetization. A SR26411 recoupling sequence of duration τ
excites DQ coherences which are then allowed to evolve during t1 and are consequently reconverted
into longitudinal magnetization by a second SR26411 recoupling sequence of the same duration τ. The
shaded elements are given a four-step phase cycle to select signals passing through DQ coherences.
the t1 evolution period are given phase shifts in increments of 45° as t1 is incremented and a cosine
Fourier transform is applied in the indirect dimension.
2. Calculation of double-quantum curves
2.1 Double-quantum curves for two-spin systems
The DQ signal intensity as a function of the recoupling time τ (the DQ curve) with the SR26411
dipolar recoupling sequence for a pair of coupled spins-1/2 may be estimated using the first-order
average Hamiltonian symmetry theory.4 The result is
(
)
κ τ β γ
= τ γ
β
αPR PR PR bij bij PR PR
S sin2 cos
2 3 sin , ; ,
, 2 (S1)
where the Euler angles describing the orientation of the internuclear vector with respect to the rotor
axis are
{
αPR,βPR,γPR}
and bij is the homonuclear dipolar coupling constant (in rad s-1) between spinsi and j and is proportional to the inverse cube of the internuclear distance rij:
2 3 0 1 4π γ µ − = ij ij r
b h (S2)
κ is the complex scaling factor of the dipolar interaction and has a magnitude given by |κ| = 0.1708 for
R26411 symmetry, according to the equations in ref. 5. To calculate the DQ curve for a powder,
equation S1 must be integrated over all crystallite orientations:
( )
κ τ β γ
β β γ
π =
τ
∫
π PR∫
π PR PR ij PR PRij b
b
S sin2 cos
2 3 sin d sin d 4 1 , 2 0 2
0 (S3)
Since the structure solution algorithm must calculate large number of DQ curves, it is of paramount
integral can be expressed in the same form as the equation for the REDOR curve6 which Mueller et al.
have shown may be simplified in terms of quarter-order Bessel functions of the first kind:7,8
κ τ
κ τ π
− =
τ ij − ij
ij J b J b
b S
2 3
2 3 8
2 2 1 ) ,
( 1/4 1/4 (S4)
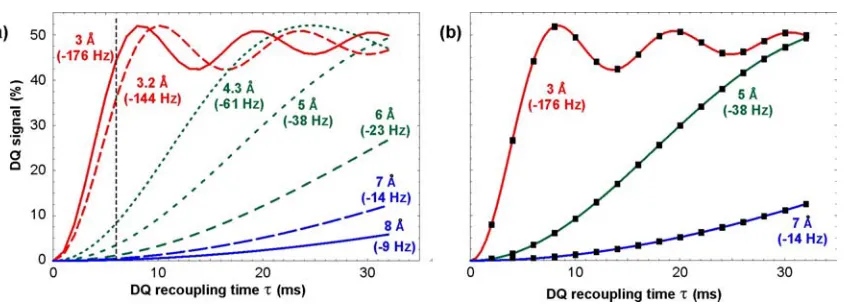
A set of DQ curves, calculated with this expression, for a range of Si – Si distances expected in zeolite
frameworks is displayed in Figure S2a. The above equations are only valid in the first order of average
Hamiltonian theory. We have checked the validity of this approximation by performing accurate spin
dynamical simulations for 2-spin-1/2 systems, using dipole-dipole coupling and chemical shift
anisotropy parameters appropriate for 29Si sites in zeolites. The deviations from the analytical formula
Figure S2. Double quantum curves for isolated 29Si-29Si spin pairs for the SR26411 dipolar
recoupling experiment. (a) Calculated DQ curves for using the analytical function in equation
S4 for various distances and corresponding dipolar couplings expected for 29Si-29Si spin pairs
in zeolites. The vertical dashed line indicates a recoupling time of 6 ms at which the spin pairs
across Si-O-Si bonds can be clearly distinguished from the longer range interactions. (b)
Comparison of the DQ curves calculated using the analytical function in equation S4 (solid
lines) to SIMPSON9 simulations (black squares) using typical 29Si chemical shift parameters for purely siliceous zeolites: iso
2 , 1
δ
∆ = 7.3 ppm, aniso
1
δ = 10.4 ppm, η1 = 0.6, δaniso2 = 10.4 ppm, η2 =
0.4, ωr/2π = 4 kHz. The simulated DQ curves were averaged over18450 crystallite orientation.
2.2 Full double-quantum curves
The full DQ curves for each pair of Si sites i and j, denoted as Sij(τ), were calculated as follows.
The fractional coordinates of Si sites i and j in the asymmetric unit of the crystal structure are denoted as rriand rrj respectively. A set of distinct symmetry-related positions of Si site j were generated from
j
rr using s s j j r
rr( ) =O()r where O(s) denotes one of s = 1 .. Nsym space group symmetry operators which
map positions in the asymmetric unit to symmetry-related positions in neighbouring units. The distance )
(s ij
r between atoms at positions rri and (s)
j
rr was calculated by ( )
(
(s))
j i s
ij r r
r = M r −r where M is the
spin pair with atoms at positions rri and (s)
j
rr , separated by the distance (s)
ij
r , was calculated according
to
(
)
(
)
(
)
≤ > τ κ τ κ π − = τ − max ) ( max ) ( ) ( 2 3 4 / 1 ) ( 2 3 4 / 1 ) ( if if 8 / 2 2 / 1 0 ) ( r r r r b J b J S s ij s ij s ij s ij sij (S5)
where rmax is the cut-off distance (rmax = 8 Å in these calculations) and bij(s) is the dipolar coupling
constant corresponding to the distance (s)
ij
r (calculated with equation S2). The full DQ curve for the
pair of Si sites i and j was constructed by summing the curves for each of the spin pairs:
Sij(τ) = A exp{-kτ} (pi pj)
∑
= τ sym N s s ij S 1 )
( ( ) (S6)
where pi and pj are the relative site occupancies of Si sites i and j respectively and the function A
exp{-kτ} is applied in order to scale the data and account for relaxation. Note that the parameters A and k are
not specific for a particular pair of Si sites; the same values of A and k were used for every DQ curve.
It is important to note that, due to the natural abundance of 29Si (4.7%), it is valid to sum the DQ
curves of 29Si-29Si spin pairs and ignore the more complex curves that would arise from clusters of
3. Structure solution algorithm
3.1 Definition of least-squares minimum
The goal is to determine the fractional coordinates of the Si sites in the asymmetric unit which
minimize the sum of the squares of the residuals between the experimental and calculated DQ curves:
{
}
∑∑∑
= = = τ τ − τ = χ Si1 1 1
2 calc obs 2 1 2
DQ( , ; , ,..., ) ( ) ( )
N i i j N l l ij l ij ijl
N w S S
r r r k
A r r r Si (S7)
Sobs is the set of experimental DQ curves. Scalc is the set of calculated DQ curves which are functions of the fractional coordinates rriof Si atoms i = 1, 2, …, NSi, the scaling factor A and the damping factor k.
The elements of these sets, denoted by obs( )
l ij
S τ and calc( )
l ij
S τ represent the respective values for the lth
recoupling time point (l = 1, 2, ..., Nτ) of the DQ curve for the correlation involving Si site i and Si site j. calc( )
l ij
S τ is calculated from rri, rrj, A, and k according to equation S6 as described in the previous section. wijl is the weight for the lth data point in the DQ curve for Si sites i and j and is set to
2 / 1 ijl
ijl
w = σ where σijl is the estimated error of the ijlth experimental data point.
In order to facilitate comparisons between different sets of experimental data, the quality of fit of
the structure to the experimental solid-state NMR data is defined as:
{
}
{
}
∑∑∑
∑∑∑
= = = = = = τ τ τ τ − τ = Si Si1 1 1
2 obs 1 1 1
2 calc obs DQ ) ( ) ( ) ( N i i j N l l ij ijl N i i j N l l ij l ij ijl S w S S w
3.2 Grid Search
In order to ensure that the global minimum of 2 DQ
χ is found, the fractional coordinate space must
be sampled thoroughly. In this section, an efficient grid search is described which yields a set of “grid structures” of the Si sites that are close to the minimum 2
DQ
χ . These grid structures can be used as
initial values of the fractional coordinates in a non-linear least squares minimization of 2 DQ
χ . This
combination of grid search and subsequent minimization should ensure that the global minimum of 2
DQ
χ is found.
The grid search consists of building up candidate structures one Si site at a time with the atomic
coordinates restricted to points on a three-dimensional grid of the asymmetric unit. The first step is to
define a three-dimensional grid of the asymmetric unit. We have found that a resolution of about 0.5 to
0.75 Å between grid points in all three crystallographic directions is a good balance between the time
required to perform the calculations and fully sampling the coordinate space. The maximum distance
between two grid points is defined as
∆grid = (∆a2 + ∆b2 + ∆c2)1/2
where ∆a, ∆b, and ∆c are the distances between adjacent grid points along the a, b, and c
crystallographic axes respectively.
Gn denotes the set of candidate grid structures in which each structure consists of n Si sites. To
construct Gn, the possible grid positions for the nth Si site to be incorporated into the structures are
added to each of the Gn-1 candidate grid structures and the relative occupancies, inter-site
connectivities, and quality of fit to the experimental DQ curves are evaluated, as described in the
following.
The possible grid positions for the added Si site are limited to those for which the connectivity
“auto-correlation” in the 2D 29Si DQ correlation spectrum of test sample 1 (Figure 3b) indicates that
site D is connected to two symmetry-related positions of site D. In this case, the possible grid points for
site D are limited to those grid points for which the two closest positions of site D in adjacent
asymmetric units generated by symmetry both have distances from the grid point in the interval
[3.0 Å - ∆grid, 3.2 Å + ∆grid]. The distance between Si atoms across Si-O-Si linkages are known to be
between 3.0 and 3.2 Å. The ∆grid term accounts for the fact that the atomic positions are strictly limited
to the grid points while the actual atomic positions may fall somewhere between the grid points.
Additionally, there should be no distances between the grid point and its symmetry equivalents that are
less than 3.0 Å - ∆grid as these short distances are physically unreasonable for pure silica zeolites.
Furthermore, all of the other symmetry equivalent positions must be at least two Si-O-Si linkages apart
which corresponds to these distances being greater than 4.3 Å - ∆grid as 4.3 Å is the minimum distance
for Si atoms across two Si-O-Si bonds.
The grid positions which satisfy the “self-connectivity” for the added Si site are incorporated into
each of the candidate structures in the set Gn-1 to give the set of new candidate grid structures Gn´.
Each of the new candidate grid structures in the set Gn´ is then evaluated to ensure that the
relative occupancies of the sites are consistent with the relative intensities in the 1D 29Si MAS NMR
spectrum.
For those grid structures with the correct site occupancies, the connectivities between the Si sites
are evaluated to ensure that they are in agreement with the connectivity matrix derived from the 2D 29Si
DQ correlation spectrum acquired with a short DQ recoupling time. As with the evaluation of the
“self-connectivities”, the inter-site connectivities in the candidate grid structures are deemed to be correct if
the set of distances between the grid position for Si site i in the asymmetric unit and the
symmetry-related grid positions for Si site j (including the grid position of site j in the asymmetric unit) meet the
following criteria: (1) there are no distances less than 3.0 - ∆grid, (2) there are at least cij distances in the
derived from the 2D NMR spectrum, and (3) With the exception of the first cij distances, all other
distances are greater than 4.3 - ∆grid.
For those grid structures with meet the connectivity criteria, the quality of fits to the relevant
experimental DQ curves are then evaluated. The DQ curves for those Si sites that have been
incorporated into the grid structures are calculated from the distances between the grid positions
according to equation S6 as described earlier. For each grid structure, A and k are adjusted in order to minimize 2
DQ
χ . The grid structures are then sorted according to their RDQ values and a set of the best
grid structures with RDQ < cselect (RDQ)min are selected where (RDQ)min denotes the RDQ value of the grid
structure which best agrees with the experimental DQ curves and cselect is a user-defined constant
(usually between 1.1 and 2.0).
This set of grid structures is denoted Gn. The next Si site is added to each of these grid structures
and the whole process described above is repeated until all of the Si sites have been incorporated. The final set of grid structures should be close to the global minimum in 2
DQ
χ . The global minimum should
be found by using the fractional coordinates in each of the grid structures as the initial values in a local non-linear least-squares minimization of 2
DQ
χ .
3.3 Least-squares minimization
For the least-square minimization of the final grid structures, the cost function was modified to
include restraints on the Si – Si distances between Si atoms known to share a Si-O-Si linakge:
{
}
∑∑∑
= = = − + χ =χ NSi ij
i i j c m ijm r
r w r r
1 1 1
2 0 2 DQ 2 ,
DQ (S8)
rijm represents the mth closest distance between the position of Si site i (rri) in the asymmetric unit and
the set of symmetry-related positions of Si site j ( (s)
j
connectivity matrix, representing the number of Si-O-Si linkages between Si site i and the symmetry
related positions of Si site j. The target distance is represented by r0 and is set to 3.1 Å in these
calculations as the Si – Si distances across Si-O-Si linkages are known to fall within the narrow range
of about 3.0 to 3.2 Å. The weight factor wr was adjusted so that the average deviation of the restrained
distances from the target distance in the minimized structure was approximately 0.05 Å. The
least-squares minimization was carried out using the Gauss-Newton method as described by Nocedal and
Wright10.
3.4 Structure completion and distance least-squares
The structure solution algorithm provides the atomic coordinates for the Si sites, which is
sufficient to define the zeolite framework structure. In order to provide a complete structure for
refinement against the powder XRD pattern, oxygen atoms can be added midway between Si sites
which share Si-O-Si linkages.
Once the oxygen atoms are added, it is possible to optimize the geometry of the zeolite
framework using the Distance Least-Squares (DLS) procedure11 in which the Si-O, O-O, and Si-Si
distances are optimized by minimizing the sum of the squares of the residuals between calculated and
prescribed interatomic distances:
{
}
∑
−= χ
n m
j j n m j j r r
w , ,
2 0 , 2
DLS
in which 0
j
r is the prescribed interatomic distance of type j, mn j
r , is the calculated interatomic distance
of type j between atoms m and n, and wj is the weight ascribed to interatomic distances of type j. In
order to compare the results of DLS optimization on different structures, the following parameter was
{
}
{ }
∑
∑
− = n m j j j n m j j n m j j r w r r w R , , 2 0 , , 2 0 , DQFor the DLS optimizations performed here, the prescribed distances were 0 O Si−
r = 1.61,
0 O O−
r = 2.629,and 0 Si Si−
r = 3.07 and the weight values were wSi−O = 2.0, wO−O = 0.61, and wSi−Si = 0.23. These distances and weight values were used to generate the idealized frameworks reported in the Atlas
of Zeolite Structure Types.12 The unit cell parameters remained fixed.
4. Structure determination of zeolite test sample 1
4.1 Synthesis
Test sample 1 (pure silica zeolite ITQ-4) was synthesized and then calcined to remove the
organic template molecules as described in the literature.13 The synthesis and calcination was carried
out by the group at the University of St. Andrews.
4.2 Powder XRD
Powder XRD data (7 – 75 o 2θ) were collected in transmission mode on a Stoe STADIP
diffractometer equipped with a monochromator (Cu Kα, λ = 1.54056 Å) and a position sensitive
detector. The powder diffraction pattern was indexed with the TREOR program14 to give the unit cell
parameters a=18.669 b=13.503, c=7.662 Å, β=102.1° and the monoclinic space group I 2/m. The
sample was then sent for solid-state NMR analysis at the University of Southampton.
4.3 Solid-state NMR
The quantitative 1D 29Si MAS NMR spectrum of zeolite test sample 1 is presented in Figure 3a.
pulse and 60 s recycle delay. The spectrum was fit with four Lorentzian peaks of equal area as shown
in Figure 3a and summarized in Table S1. The 29Si T1 relaxation times were measured with a saturation
recovery sequence and these values are listed in Table S1.
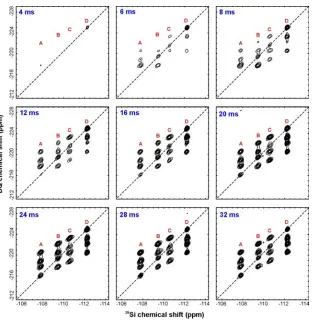
The complete series of 2D 29Si DQ correlation spectra acquired at various recoupling times
(obtained with the SR26411 pulse sequence described in Figure S1) is presented in Figure S5. The
spinning frequency was 4000 Hz and the 29Si nutation frequency during recoupling was 26.5 kHz. Each
2D experiment consisted of 40 t1 increments each with 100 acquisitions with the exception of the
experiments with recoupling times of 4 and 6 ms in which the number of acquisitions were 180 and 128
respectively. t1 was incremented in steps of 250 µs (i.e. exactly one rotor period). The recycle delay
was 10 s after presaturation pulses were applied. Exponential line broadening of 10 and 20 Hz was
applied in the single-quantum and double-quantum dimensions respectively.
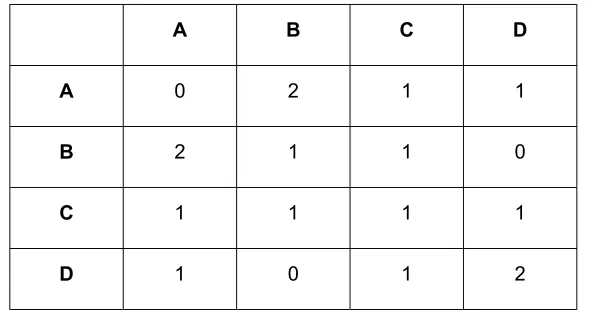
The inter-site connectivities (see Table S2) were established by evaluating the relative intensities
of the correlations in the 2D DQ correlation spectrum with a recoupling time of 6 ms. The amplitudes
of the correlation peaks were extracted from the 2D spectra to give the DQ curves presented in Figure
4. The DQ intensities were scaled with respect to the peak intensities in a 1D 29Si MAS spectrum
Table S1. NMR parameters for zeolite test sample 1.
Peak Chemical
Shifta (ppm)
Relative
Peak Areaa
Peak Width at
Half Heighta (Hz)
%
Lorentziana
T1b (s) Correlated
Peaksc
A -107.7 1 21 100 5.3 B,B,C,D
B -109.4 1 21 100 4.9 A,A,B,C
C -110.6 1 25 100 6.2 A,B,C,D
D -112.3 1 12 100 9.6 A,C,D,D
a Obtained from deconvolution of 1D 29Si MAS NMR spectrum (Figure 3a). b Measured with a saturation recovery
experiment. cDetermined from the 2D 29Si DQ correlation spectrum obtained with a recoupling time of 6 ms
(Figure 4)
Table S2. Inter-site connectivity matrix* for zeolite test sample 1.
A B C D
A 0 2 1 1
B 2 1 1 0
C 1 1 1 1
D 1 0 1 2
[image:15.612.66.367.384.540.2]Figure S5. Two-dimensional 29Si SR26411 double-quantum correlation spectra of zeolite test
sample 1 obtained at the indicated recoupling times.
4.4 Structure solution by solid-state NMR
The asymmetric unit for the I 2/m space group was chosen to be 0 ≤ x ≤ 1/2, 0 ≤ y ≤ 1/4,
0 ≤ z < 1. A three dimensional grid of the asymmetric unit was defined with a resolution of
approximately 0.5 Å such that there were 20, 8, and 15 grid points in the a, b, and c directions
respectively. After evaluating the “self-connectivity” information which limited the possible grid
positions for sites A, B, C, and D to 847, 1010, 1010, and 226 positions respectively, the order in which
the sites were added was set to {D, A, B, C}. Furthermore, the grid positions for the first site were
limited to those positions for which 0 ≤ z ≤ 1/4 in order to cut down on the number of identical
at each stage of the grid search are presented in Table S3. The grid search required 30 minutes of
[image:17.612.86.529.193.406.2]computation time.
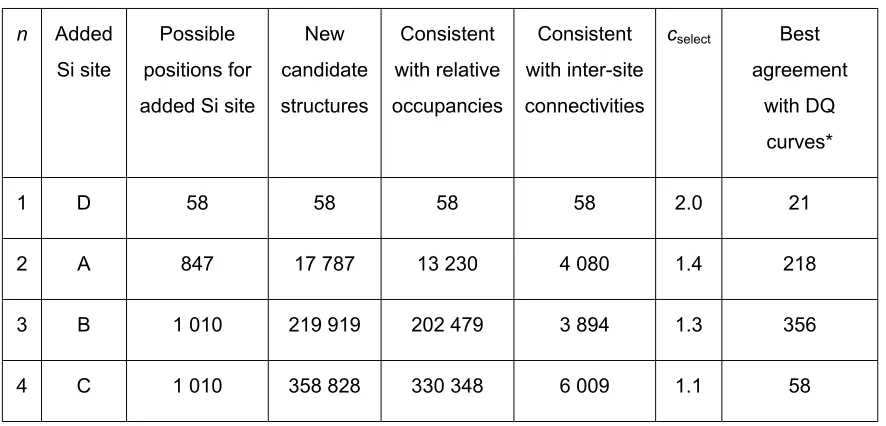
Table S3. Summary of grid search for zeolite test sample 1.
n Added
Si site
Possible positions for added Si site
New candidate structures
Consistent with relative occupancies
Consistent with inter-site connectivities
cselect Best
agreement with DQ
curves*
1 D 58 58 58 58 2.0 21
2 A 847 17 787 13 230 4 080 1.4 218
3 B 1 010 219 919 202 479 3 894 1.3 356
4 C 1 010 358 828 330 348 6 009 1.1 58
* Candidate structures with RDQ < cselect(RDQ)min were selected
The 58 best grid structures were then subjected to non-linear least-squares minimization with the
Si – Si distances across Si-O-Si linkages restrained to 3.10 ± 0.05 Å by setting wr = 0.15. These
minimized structures were compared to each other and 10 unique structures were identified. Oxygen
atoms were added to each structure and the structures were subjected to DLS optimization in order to
test the geometric feasibility of the structures. Additionally, the structures were evaluated for the
presence of “three-rings” which are highly unlikely to be found in the structure, given the 29Si chemical
shifts observed. Table S4 lists the unique minimized structures, sorted according to the RDQ values,
Table S4. Unique minimized structures determined by solid-state NMR
Structure RDQ RDLS Three-rings?
1 0.1043 0.0400 yes
2 0.1043 0.0035 no
3 0.1062 0.0522 yes
4 0.1062 0.0520 yes
5 0.1080 0.0609 yes
6 0.1081 0.0320 yes
7 0.1086 0.0755 yes
8 0.1087 0.0755 yes
9 0.1173 0.0296 yes
10 0.1189 0.0656 yes
It is very clear that structure 2 in this table is the most likely structure for zeolite test sample 1 as
it gives one of lowest RDQ values and all of the other structures give RDLS values that are an order of
magnitude greater due to the presence of unfavourable three-rings. This “solid-state NMR structure” is
presented in Figure 3 and the set of Si – Si distances calculated from this structure was used to
calculate the DQ curves presented in Figure 2c (with A = 1.86 and k = 28.4 s-1). This structure solved
by solid-state NMR is compared to the XRD-refined structure in Figure 3b. The atomic coordinates for
the Si sites determined by solid state are listed and compared to the refined coordinates in Table S6.
The absolute differences in the atomic coordinates between the solid-state NMR and XRD-refined
4.5 Structure completion and refinement against powder XRD data
Structure refinement of test sample 1 was carried out using the whole pattern fitting (Rietveld)
method incorporated into the GSAS suite of programs.15 The four silicon atoms from the NMR
structure solution were used as the starting model, and the remaining oxygen atoms were found from
subsequent difference Fourier syntheses. The initial stages of the refinement included restraints (soft
constraints) to ensure chemically sensible geometries in the model, but these were removed towards the
end of the refinement. The final cycle of least squares refinement included terms for the atomic
positions of all the atoms, together with two variables for the silicon and oxygen isotropic displacement
parameters respectively. The final refinement cycle also included terms for the lattice parameters,
diffractometers zero point and profile (peak shape and background). The refinement converged to
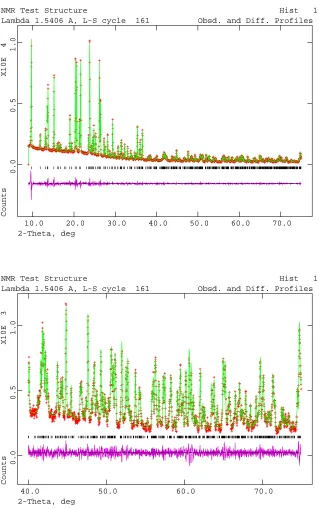
values of Rp = 0.0558, wRp = 0.0745 and χ2 = 4.48. The observed, calculated and difference profiles
for the refinement are shown in Figure S6. The final refined unit cell parameters and atomic
NMR Test Structure Hist 1 Lambda 1.5406 A, L-S cycle 161 Obsd. and Diff. Profiles
2-Theta, deg
Counts
10.0 20.0 30.0 40.0 50.0 60.0 70.0
X10E 4
0.0
0.5
1.0
NMR Test Structure Hist 1 Lambda 1.5406 A, L-S cycle 161 Obsd. and Diff. Profiles
2-Theta, deg
Counts
40.0 50.0 60.0 70.0
X10E 3
0.0
0.5
[image:20.612.92.411.54.563.2]1.0
Figure S6. Rietveld refinement plots for zeolite test sample 1. The observed (red crosses),
calculated (green line) and difference (purple) plots for the Rietveld refinement of the structure
against powder X-ray diffraction data. The high angle portion of the plot is enlarged to show
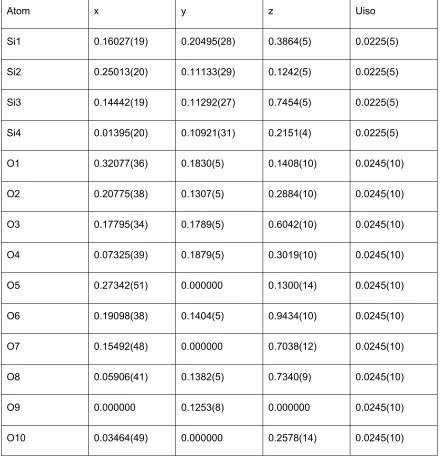
Table S5. Final unit cell, refined coordinates and isotropic displacement parameters for zeolite test sample 1.
Unit cell: a = 18.66363(24) Å b = 13.49929(16) c = 7.63419(10) Beta = 101.9910(10) Cell volume =
1881.43(4) Å3
Atom x y z Uiso
Si1 0.16027(19) 0.20495(28) 0.3864(5) 0.0225(5)
Si2 0.25013(20) 0.11133(29) 0.1242(5) 0.0225(5)
Si3 0.14442(19) 0.11292(27) 0.7454(5) 0.0225(5)
Si4 0.01395(20) 0.10921(31) 0.2151(4) 0.0225(5)
O1 0.32077(36) 0.1830(5) 0.1408(10) 0.0245(10)
O2 0.20775(38) 0.1307(5) 0.2884(10) 0.0245(10)
O3 0.17795(34) 0.1789(5) 0.6042(10) 0.0245(10)
O4 0.07325(39) 0.1879(5) 0.3019(10) 0.0245(10)
O5 0.27342(51) 0.000000 0.1300(14) 0.0245(10)
O6 0.19098(38) 0.1404(5) 0.9434(10) 0.0245(10)
O7 0.15492(48) 0.000000 0.7038(12) 0.0245(10)
O8 0.05906(41) 0.1382(5) 0.7340(9) 0.0245(10)
O9 0.000000 0.1253(8) 0.000000 0.0245(10)
Table S6. Comparison of Si fractional atomic coordinates for zeolite test sample 1 determined by solid-state NMR and subsequent refinement against powder XRD data.
Si site Solid-state NMR Powder XRD Difference (Å)
A x
y z 0.1735 0.1861 0.4354 0.1603 0.2049 0.3864 0.48
B x
y z 0.2562 0.1149 0.1562 0.2501 0.1113 0.1242 0.25
C x
y z 0.1455 0.1152 0.7949 0.1444 0.1129 0.7454 0.38
D x
y z 0.0249 0.1183 0.2039 0.0140 0.1092 0.2151 0.27
4.6 Structure solution from powder XRD
Initial attempts to solve the structure of zeolite test sample 1 using individual reflection intensities
extracted using the Le Bail method (GSAS) followed by use of a single crystal direct methods structure
solution program (SIR 97) were unsuccessful. Subsequently, the program EXPO16 was used to extract
reflection intensities and solve the structure using the direct methods algorithm specially designed to
take into account the reflection overlap difficulties encountered in powder X-ray diffraction. All four of
the crystallographically independent silicon atoms, plus several potential oxygen positions were thus
5. Structure determination of zeolite test sample 2
5.1 Synthesis
Test sample 2 (pure silica zeolite ferrierite) was synthesized as described in the literature.17,18 The
synthesis was carried out by the group at the University of St. Andrews. The sample was used in its
as-synthesized form, with the template molecules remaining within the zeolite channel system.
5.2 Powder XRD
Powder XRD data (7 – 75 o 2θ) were collected in transmission mode on a Stoe STADIP
diffractometer equipped with a monochromator (Cu Kα, λ = 1.54056 Å) and a position sensitive
detector. The powder diffraction pattern was indexed with the Treor programto give the unit cell
parameters a=7.4068, b=14.0713, c=18.6699 Å and the orthorhombic space group Pnnm. The sample
was then sent for solid-state NMR analysis at the University of Southampton.
5.3 Solid-state NMR
Since the organic template molecules still reside within the zeolite framework, 1H→29Si cross
polarization (CP) was found give a substantial gain in signal over direct 29Si polarization for this
sample. The 1D 29Si CP MAS NMR spectrum of zeolite test sample 2 is presented in Figure S7. This
spectrum was obtained at a spinning frequency of 4000 Hz with 64 acquisitions, each with a 40 ms
contact time and 2.5 s recycle delay after presaturation pulses were applied on the 1H channel. The 1H
T1 relaxation time was measured to be approximately 2 s. The spectrum was fit with five peaks with
relative intensities 2:2:2:2:1 as shown in Figure S7 and summarized in Table S7.
The complete series of 2D 29Si DQ correlation spectra acquired at various recoupling times
(obtained with the SR26411 pulse sequence described in Figure S1) is presented in Figure S8. The
spinning frequency was 4000 Hz and the 29Si nutation frequency during recoupling was 26.5 kHz. Each
2D experiment consisted of 40 t1 increments each with 240 or 320 acquisitions with the exception of
incremented in steps of 250 µs (i.e. exactly one rotor period). The contact time was 40 ms and the
recycle delay was 2.5 s. Exponential line broadening was not applied in either dimension.
The inter-site connectivities (see Table S8) were established by evaluating the relative intensities
of the correlations in the 2D DQ correlation spectrum with a recoupling time of 6 ms. The amplitudes
of the correlation peaks were extracted from the 2D spectra to give the DQ curves presented in Figure
S9. The DQ intensities were scaled with respect to the peak intensities in a 1D 29Si CP MAS spectrum
Table S7. NMR parameters for zeolite test sample 2.
Peak Chemical
Shifta (ppm)
Relative
Peak Areaa
Peak Width at
Half Heighta (Hz)
%
Lorentziana
Correlated
Peaksb
A -113.1 2 26 83 A,B,C,E
B -113.8 2 50 95 A,C,C,D
C -116.8 2 40 73 A,B,B,D
D -117.9 2 37 62 B,C,D,E
E -118.5 1 35 82 A,A,D,D
a Obtained from deconvolution of 1D 29Si CP MAS NMR spectrum (Figure S7). bDetermined from the 2D 29Si DQ
correlation spectrum obtained with a recoupling time of 6 ms.
Table S8. Inter-site connectivity matrix* for zeolite test sample 2.
A B C D E
A 1 1 1 0 1
B 1 0 2 1 0
C 1 2 0 1 0
D 0 1 1 1 1
E 2 0 0 2 0
[image:25.612.135.479.397.581.2]Figure S8. Two-dimensional 29Si SR26411 double-quantum correlation spectra of zeolite test
sample 2 obtained at the indicated recoupling times.
5.4 Structure solution by solid-state NMR
The asymmetric unit for the Pnnm space group was chosen to be 0 ≤ x < 1, 0 ≤ y ≤ 1/4,
0 ≤ z < 1/2. A three dimensional grid of the asymmetric unit was defined with a resolution of
approximately 0.75 Å such that there were 10, 6, and 13 grid points in the a, b, and c directions
respectively. By evaluating the “self-connectivity” information, the possible grid positions for sites A,
B, C, D, and E were limited to 420, 484, 484, 420, and 484 positions respectively. The order in which
limited to those positions for which 0 ≤ x ≤ 1/4 in order to cut down on the number of identical
solutions which arise due to a number of equivalent choices of the origin. The number of grid structures
at each stage of the grid search are presented in Table S9. The grid search required 1.5 hours of
[image:27.612.53.491.202.445.2]computation time.
Table S9. Summary of grid search for zeolite test sample 2.
n Added
Si site
Possible positions for added Si site
New candidate structures
Consistent with relative occupancies
Consistent with inter-site connectivities
cselect Best
agreement with DQ
curves*
1 C 143 143 143 143 1.5 93
2 B 484 44 919 27 965 4 138 1.4 112
3 E 484 53 984 11 424 6 062 1.3 586
4 A 420 245 898 210 884 19 184 1.2 2686
5 D 420 1 125 270 964 234 19 446 1.1 344
* Candidate structures with RDQ < cselect(RDQ)min were selected
The 344 best grid structures were then subjected to non-linear least-squares minimization with
the Si – Si distances across Si-O-Si linkages restrained to 3.10 ± 0.05 Å by setting wr = 0.18. These
minimized structures were compared to each other and 25 unique structures were identified. Oxygen
atoms were added to each structure and the structures were subjected to DLS optimization in order to
test the geometric feasibility of the structures. Additionally, the structures were evaluated for the
presence of “three-rings” which are highly unlikely to be found in the structure, given the 29Si chemical
shifts observed. Only one of these structures gives a low RDLS value (0.0063) and does not have any
three-rings in the structure.
This “solid-state NMR structure” is presented in Figure 4 and the set of Si – Si distances
0.159, A = 1.86 and k = 32.0 s-1). The structure obtained after adding the oxygen atoms and DLS
optimization of the geometry was used for Rietveld refinement against the powder XRD data (see
later). The solid-state NMR structure is compared to the refined structure in Figure 4e. The atomic
coordinates for the Si sites determined by solid state are listed and compared to the to the refined
coordinates in Table S11. The absolute differences in the atomic coordinates between the solid-state
NMR and XRD-refined structure are all less than 0.7 Å. However, it should be noted that the structure
obtained after adding the oxygen atoms and performing DLS brings the silicon positions to within 0.2
Å of the structure obtained after Rietveld refinement.
5.5 Structure refinement against powder XRD data
Structure refinement of zeolite test sample 2 was carried out using the whole pattern fitting
(Rietveld) method incorporated into the GSAS suite of programs. The five silicon atoms from the NMR
structure solution plus geometrically placed oxygen atoms (after subsequent DLS refinement) were
used as the starting model, and the remaining carbon atoms of the organic templates were found from
subsequent difference Fourier syntheses. This sample suffers from severe preferred orientation effects
resulting from the plate-like habit of the crystals. The refinement after use of a March-Dollase preferred
orientation correction required fairly strong soft constraints to maintain a chemically sensible
geometry. The final cycle of least squares refinement included terms for the atomic positions of all the
atoms, together with two variables for the silicon and oxygen isotropic displacement parameters
respectively. The atoms of the templates were left unrefined. The final refinement cycle also included
terms for the lattice parameters, diffractometers zero point and profile (peak shape and background).
The refinement converged to values of Rp = 0.0639, wRp = 0.0897. The observed, calculated and
difference profiles for the refinement are shown in Figure S10. The final refined unit cell parameters
and atomic coordinates are listed in Table S10.
Because of the difficulties with the preferred orientation in the powder data, the NMR-derived
structure was also tested against single crystal X-ray diffraction data. While this data was collected on a
NMR were all that was necessary to successfully phase the data, and the oxygen atoms and the
template atoms could be found from subsequent Fourier synthesis.
NMR Test Structure Hist 1 Lambda 1.5406 A, L-S cycle 217 Obsd. and Diff. Profiles
2-Theta, deg
Counts
10.0 20.0 30.0 40.0 50.0 60.0 70.0
X10E 4
-0.5
0.0
0.5
1.0
1.5
[image:29.612.148.466.120.360.2]2.0
Figure S10. Rietveld refinement plot for zeolite test sample 2. The observed (red crosses),
calculated (green line) and difference (purple) plots for the Rietveld refinement of the structure
Table S10. Final unit cell, refined coordinates and isotropic displacement parameters for
zeolite test sample 2.
Unit cell: a = 7.42899(20) Å, b = 14.0890(6) Å, c = 18.7440(8) Å Cell volume = 1961.87(12) Å3
Atom x y z Uiso
Si1 0.2068(9) -0.0060(8) 0.2251(4) 0.0131 (13)
Si2 0.7171(13) 0.2053(8) 0.1572(5) 0.0131 (13)
Si3 0.3104(13) 0.2092(9) 0.1824(5) 0.0131 (13)
Si4 0.5065(16) 0.2076(6) 0.4166(4) 0.0131 (13)
Si5 0.500000 0.000000 0.3557(7) 0.0131 (13)
O6 0.000000 0.000000 0.2518(11) 0.0325 (25)
O7 0.7268(30) 0.0914(10) 0.1717(12) 0.0325 (25)
O8 0.2470(28) 0.0994(10) 0.1914(12) 0.0325 (25)
O9 0.6669(18) -0.0011(15) 0.2986(6) 0.0325 (25)
O10 0.5064(13) 0.2254(13) 0.1506(8) 0.0325 (25)
O11 0.7843(30) 0.2327(15) 0.2403(7) 0.0325 (25)
O12 0.8179(22) 0.2363(17) 0.0848(8) 0.0325 (25)
O13 0.6997(24) 0.2380(18) 0.3819(8) 0.0325 (25)
O14 0.5416(35) 0.2013(23) 0.500000 0.0325 (25)
Table S11. Comparison of Si fractional atomic coordinates for zeolite test sample 2 determined by solid-state NMR and subsequent refinement against powder XRD data.
Si site Solid-state NMR Powder XRD Difference (Å)
A x
y z 0.2095 -0.0024 0.2041 0.2068 -0.0060 0.2251 0.40
B x
y z 0.6802 0.2124 0.1616 0.7171 0.2053 0.1572 0.30
C x
y z 0.2599 0.2187 0.1777 0.3104 0.2092 0.1824 0.41
D x
y z 0.4762 0.1751 0.4178 0.5065 0.2076 0.4166 0.51
E x
5.6 Structure solution from powder XRD
All attempts to solve the structure of test sample 2 using Expo were unsuccessful. This is a much
more challenging problem than the structure solution of test sample 1 because of the extra scattering of
the occluded organic structure directing agents and the severe preferred orientation effects, which lead
to unreliable intensity extraction from the XRD pattern. There are structure solution algorithms
designed for use with samples of this kind19 but this is a non-trivial problem and would still be
extremely difficult.
1. Brouwer, D.H., Kristiansen P.E., Fyfe, C.A. & Levitt, M.H. Symmetry-based 29Si dipolar recoupling
magic angle spinning NMR spectroscopy: a new method for investigating three-dimensional structures
of zeolite frameworks J. Am. Chem. Soc. 127, 542-543 (2005).
2. Kristiansen, P. E., Carravetta, M., Lai, W. C. & Levitt, M. H. A robust pulse sequence for the
determination of small homonuclear dipolar couplings in magic-angle spinning NMR. Chem. Phys.
Lett. 390, 1-7 (2004).
3. Carravetta, M., Eden, M., Zhao, X., Brinkmann, A. & Levitt, M. H. Symmetry principles for the
design of radiofrequency pulse sequences in the nuclear magnetic resonance of rotating solids. Chem.
Phys. Lett. 321, 205-215 (2000).
4. Haeberlen, U. & Waugh, J.S. Coherent averaging effects in magnetic resonance. Phys Rev. 175,
453-467 (1968).
5. Brinkmann, A. & Levitt, M. H. Symmetry principles in the nuclear magnetic resonance of spinning
solids: Heteronuclear recoupling by generalized Hartmann-Hahn sequences. J. Chem. Phys. 115,
357-384 (2001).
6. Gullion, T. & Schaefer, J. Rotational-echo double resonance NMR. J. Magn. Reson. 81, 196-200
7. Mueller, K. T. Analytic solutions for the time evolution of dipolar-dephasing NMR signals. J. Magn.
Reson. A 113, 81-93 (1995).
8. Mueller, K. T., Jarvie, T. P., Aurentz, D. J. & Roberts, B. W. The REDOR transform: direct
calculation of internuclear couplings from dipolar-dephasing NMR data. Chem. Phys. Lett. 242,
535-542 (1996).
9. Bak, M., Rasmussen, J. T. & Nielsen, N. C. SIMPSON: A General Simulation Program for Solid
State NMR. J. Magn. Reson. 147, 296-330 (2000).
10. Nocedal, J. & Wright, S.J. Numerical Optimization, Springer, New York (1999).
11. Baerlocher, Ch., Hepp, A. & Meier, W.M. DLS-76: a program for the simulation of crystal
structures by geometric refinement. Lab. f. Kristallographie, ETH, Zurich (1978).
12. Baerlocher, Ch. & McCusker, L.B. Database of Zeolite Structures:
http://www.iza-structure.org/databases/
13. Barrett, P.A, Camblor, M.A., Corma, A., Jones, R.H. & Villaescusa, L.A. Structure of ITQ-4, a new
pure silica polymorph containing large pores and a large void volume Chem. Mater. 9, 1713- 1715
(1997).
14. Werner, P.E., Eriksson, L. & Westdahl, M. TREOR, a semi-exhaustive trial-and-error powder
indexing program for all symmetries J. Appl. Crystallogr. 18, 367-370 (1985).
15. Larson, A.C., & Von Dreele, R.B. General Structure Analysis System (GSAS) Los Alamos
National Laboratory Report LAUR 86-748 (2000).
16. Altomare, A. et al. EXPO: a program for full powder pattern decomposition and crystal structure
solution, J. Appl. Crystallogr. 32, 339-340 (1999).
17. Kuperman, A. et al. Nonaqueous synthesis of giant crystals of zeolites and molecular-sieves
18. Bull, I. et al. An X-ray diffraction and MAS NMR study of the thermal expansion properties of
calcined siliceous ferrierite, J. Am. Chem. Soc. 125, 4342-4349 (2003)
19. McCusker, L.B. et al Solving complex zeolite structures from powder diffraction data Chimia, 55,