Article
Neural Network Based Modeling and Control for a
Batch Heating/Cooling Evaporative Crystallization
Process
Wachira Daosud
1, Jedsada Thampasato
2, and Paisan Kittisupakorn
2,*
1 Department of Chemical Engineering, Faculty of Engineering, Burapha University, Chonburi, Thailand 2 Department of Chemical Engineering, Faculty of Engineering, Chulalongkorn University, Bangkok,
Thailand
*Email: [email protected]
Abstract. Crystallization processes have been widely used for separation in many fields to provide a high purity product. In this work, dynamic optimization and neural network (NN) have been applied to improve the quality of the product: citric acid. In the dynamic optimization, optimization problems maximizing both crystal yield and crystal size have been formulated. The neural networks have been developed to provide NN models to be used in the formulation of not only neural network inverse control (NNDIC) but also neural network model predictive control (NNMPC) strategies. The Levenberg Marquadt algorithm has been used to train the network and optimal neural network architectures have been determined by a mean squared error (MSE) minimization technique. In addition, a neural network model has been designed to provide estimates of the temperature and the concentration of the crystallizer. These estimates have been incorporated into the NNMPC controller. In the NNDIC controller, another neural network model has been applied to predict the set point of jacket temperature. The simulation results have shown that the obtained crystal size is increased by 19% and 30% compared to that by cooling and evaporation methods respectively and the obtained yield is increased more than 50%. The robustness of the proposed controller is investigated with respect to parameters mismatches. The results have shown that the NNMPC controller provides superior control performances in all case studies.
Keywords: Neural network, batch crystallization, optimization, heating/cooling evaporation.
ENGINEERING JOURNAL Volume 21 Issue 1 Received 5 February 2016
1.
Introduction
Batch crystallization, separation and purification behavior, is widely used in many fields such as food, chemical and pharmaceutical to produce high value-added specialty chemicals with high purity, desired Crystal Size Distribution (CSD) and shape. In general, batch cooling crystallization is one of the most method to apply in industrial processes owing to it operates easily. On the contrary, batch evaporative crystallization is economically more favorable than batch cooling crystallization if the solubility of solute depends on slightly temperature. With the object of enhancing the productivity of batch crystallization process, there are a number of researches focused on optimization and controlling both of batch crystallization by cooling and evaporation processes [1-6]. Paengjuntuek et al. [7] studied the optimization of batch crystallization processes. Mesbah et al. [8] presented a model-based control approach for optimal operation of a seeded fed-batch evaporative crystallization that was operated at isothermal and vacuum pressure.
Moreover, combining heating/cooling and evaporation in batch crystallization is the main topic of interest due to it can produce higher supersaturation, higher crystal yield and larger crystal size than all conventional crystallization. This method is only suitable for the system where the solubility varies significantly with temperature [9]. The combined evaporative crystallization with other process presents several advantages such as reduce equipment requirements, time cycle and saving cost of separation and recovery in some case. Choong and Smith [9] optimized and compared batch heating/cooling evaporative crystallization with the other crystallizations such as batch evaporative, semi-batch evaporative and batch cooling crystallizations. The results showed that the heating/cooling evaporative crystallization provided larger average crystal size 35%, 12% and 8% than crystallization by batch cooling and unseeded constant evaporation, batch seeded evaporative and semi-batch evaporative, respectively. In addition, the heating/cooling evaporative crystallization provided higher crystal yield than other modes of crystallization about 47%.
The batch crystallization process is a highly complex and nonlinear system. Therefore, an accurate mathematical model of the process is rarely available. Therefore, an artificial neural network approach, one of several techniques widely successfully applied to provide the modeling of nonlinear systems, is needed. An advantage of the implementation of the neural network is that it is easy to design and use and can provide the estimates of the relationship of input and output to explain the process. Kittisupakorn et al. [10] has applied the neural network to predict the concentration of a hydrochloric acid in hydrochloric acid recovery process. Arpornwichanop and Shomchoam [11] has applied neural network to estimate the substrate concentration in a fed-batch bioreactor. Moreover, there have been many researches applied the neural network to modeling nonlinear processes [12-19].
Normally, a production’s goal is to achieve product properties such as crystal size, purity and crystal size distributions that influence downstream processing operations such as filtering, drying and storage. However, since the batch crystallization process is a high complexity and nonlinear system, the control of this process based on the application of neural network is a significant challenge. For instance, Damour et al [20] presented the implementation of Neural Network Model Predictive Control (NNMPC) for an industrial crystallization process using model-based observers. A neural network model based on the estimates of crystal mass was used as internal model to predict the process output. Besides, their work compared the performances between NNMPC and industrial data from a PID-controlled process. Kittisupakorn et al. [21, 34-36] used neural network as a model in the model predictive control (MPC) algorithm for a steel pickling process. Furthermore, the neural network is incorporated into a model based predictive control technique in many researches [22-24].
2.
Mathematical Model of Batch Heating/Cooling and Evaporative Crystallization
A mathematical model of batch heating/cooling and evaporative crystallization consists of two mass balances of solute and solvent, energy balance and crystallization model [9]. The assumptions made in the development of the process are: (1) agglomeration and breakage of crystals are negligible, (2) total nucleation rate is the sum of primary and secondary nucleation rates, (3) crystal size is independent growth, (4) the solution is well mixed and (5) crystal nuclei produced from primary and secondary nucleation have negligible size [25] By performing mass balances, the following equations are obtained:
The mass balance of solute:
3
ln
s v c
s
d m M d M
dC k
C
dt M dt dt
(1)
The mass balance of solvent:
evap dM
- Q
dt (2)
where Cs is the concentration of solute, kv is the volumetric shape factor, ρc is the density of crystals, m3 is
the third moment of crystal size, M is the mass of solvent and Qevap is the evaporation rate.
The evaporation rate is a function of temperature and can be calculated by the following equation: [26-27]
2
v a s evap
α(P - P )A
Q
e πmRT (3)
1571.31
lnPv 58.9840 11.4377 ln( )T
T
(4)
where Pv is the saturation vapor pressure, Pa is the partial pressure in the crystallizer, As is the evaporation
surface area, α is the evaporation coefficient, m is the molecular weight and R is the gas constant. The energy balance around the crystallizer is shown as follows:
3 j j evap evap crys v c
p tot
dm
UA (T - T) - H Q H k ρ M
dT dt
dt C M
(5)
j j j pj jsp j j j
j pj j
dT F ρ C (T - T ) UA (T - T)
dt ρ C V
(6)
and
1 Nr
evap c
H Ar abs( T / T ) (7)
where T is the temperature in the crystallizer, U is the overall heat transfer coefficient, Aj is the total heat
transfer surface area, Tj is the jacket temperature, Hevap is the heat of vaporization, Hcrys is the heat of
crystallization, Cp is the heat capacity of the solution, Mtot is the total mass of solution, Fj is the water flow
rate in jacket, ρj is the density of water in jacket, Cpj is the heat capacity of the water in jacket, Tjsp is the set
point of jacket temperature and Vj is the jacket volume.
For the crystallization model can be described by following equations: The crystal growth rate:
* g
g s
where G is the crystal growth rate, kg is the crystal growth rate constant, C* is the solubility of the solute
and g is the crystal growth rate exponent
The Population Balance Equation with the assumption of crystal growth rate, variable volume and well mixed batch crystallizer can be given as:
ln
0
(Gn)
d(
M)
n
n
t
L
dt
(9)where n is the number density of the crystals, L is the characteristic crystal length and M is the total mass of solvent at any instant of time.
Mostly, the moment transformation method is applied to convert Eq. (9). The moment of the crystal size distribution are given in the following expression:
0
0
ln
p s
dm d( M)
(B B ) - m
dt dt (10a)
and
1 0
ln
i i
i i
dm d( M)
iGm BL m
dt dt (10b)
where Bp and Bs are the primary and secondary nucleation rate, respectively, L0 is the characteristic crystal
length of a newly formed crystal, and m0 and mi are the zero and i moment of crystal size ( i = 0, 1, 2, 3,
4,…), respectively.
For nucleation, both primary and secondary nucleation is used to describe in the empirical power law form:
Primary nucleation:
* p
p p s
B k (T)(C - C ) (11)
Secondary nucleation:
* s b
s s s crys
B k (T)(C - C ) M (12)
where kp and ks are the primary and secondary nucleation rate constant, respectively, p and s are primary
and secondary nucleation rate exponent, respectively, Mcrys is the magma density of crystal and b is the
magma density exponent.
The solubility of the solute can be expressed by a polynomial equation.
* 1 2 3
0 1 2 3
C C C T C T C T (13)
In this work, the objective functions of optimization are to maximize the average crystal size (weight mean crystal size), Law and the crystal yield. The expression for average crystal size and crystal yield are
shown as follows:
4 3 aw
m L
m
(14)
0 0
crystal yield C (t )M(t ) - C (t )M(t )s s f f (15)
3.
Dynamic Optimization
The dynamic optimization computes the optimal operating temperature policy to control the crystallizer. In batch crystallization process, the quality of crystal effect to downstream process such as filtration, drying and storage [29]. In this study, the crystal quality which is crystal yield and crystal size is focused [9]. The aims of a dynamic optimization are to maximize the crystal yield and the crystal size. In this work, two optimization problems are considered.
Problem 1 (OPT1):
) (t )/m (t
m4 f 3 f
max (16)
T(t) subject to the crystallizer model equations:
min max
T T T (17)
,min ,max
aw aw aw
L L L (18)
min
M M (19)
Problem 2 (OPT2):
*
minC ts( )f M t( )f (20)
T(t) subject to the crystallizer model equations:
min max
T T T (21)
, ,max
aw mm aw aw
L L L (22)
min
M M (23)
where Tmin and Tmax are chosen as 40 and 70 ๐C, respectively, Law,min and Law,max are chosen as 315 and 550
µm, respectively and the minimum total mass of solvent, Mmin, is 0.5 kg. The final batch time, tf, is 6500 s.
4.
Neural Network
4.1. Neural Network Forward Model
The neural networks consist of an input layer for receiving data from external source, one or some hidden layer(s) for processing input data and an output layer for displaying the output values. There are some neurons in each layer that are connected with some connections to previous and next layers. A neuron includes input and output values, weight factors as well as bias and transfer function. The neural networks are trained using a training algorithm and a training data set in order to adjust the connection weights and biases.
For this neural network, the weight factors and biases are the coefficients that determine the relationship of the network inputs by randomly. The neural network uses tan-sigmoid as activation function of the nodes in hidden layer and linear function is used as the activation function in its output layer. The Levenberg-Marquardt algorithm is applied for training the network. The objective of neural network training is to minimize the error function which is mean square error (MSE) between the predicted neural network values and actual targeted value. Eq. (24) is shown the MSE calculation.
2
1
1
aci pi n
MSE (T T )
n i
where n is the number of data, Tac is the actual targeted temperature value and Tp is the predicted neural
network values.
The steps of neural network structure designing are summarized in Fig. 1. First step is preparing input and output data for training, validation and testing which are obtained by solving Eq. (1) – (13) and varies the value of manipulated variable (the set point of jacket temperature, Tjsp) in step changes. Second step is
to design the network structure and choose the error function. Next are to initialize the weight factors, train the network, test and validate the network and then examine the error. If the error is unacceptable, the weight factors or structure will be reset to new values but if the error is acceptable, the neural network model will be obtained.
Figure 2 shows the input and output chosen to represent the forward model which is 6 input nodes that consists of CS(k-1), CS(k), T(k-1), T(k), Tjsp(k-1) and Tjsp(k) as well as 2 output nodes that compose of
Cs(k+1) and T(k+1).
The input and output data sets which consist of training, testing and validating data sets are obtained from mathematical model to train the neural network by varied the set point of jacket temperature. In the generated data for network training consist of plant certainty case called nominal case and plant uncertainty cases that compose of -30% of U, +30% of Hcrys, -30% of Hevap, +30% of kg and +30% of kp. The input
and output data sets which are trained in neural network forward model are 18 sets. The data sets which are generated from mathematical model need to be nominalized in order to overcome the significant minimum and maximum values used in the training process. The raw process data generated are scaled down to between 0.05-0.95 using the following equations:
max min min
0 95 0 05
0 05
ac sd
value value . .
value .
value value
(25)
and the actual value (scaled up) is given by
max
min min0 05
0 95 0 05
sd ac
value . value value
value value
. .
(26)
where valuesd, valueac, valuemin, valuemax are the scaled down,actual, minimum and maximum values of the
data, respectively.
The input and output data sets which are nominalized are integrated and randomized to train test and validate the neural network. The training, testing and validating data set are 60%, 30% and 10% of the all data, respectively.
4.2. Neural Network Inverse Model
In this part, the neural network direct inverse control is used for control the crystallization process by training neural network inverse model. These steps of neural network structure designing are same as the neural network model (Fig. 1). The neural network inverse model is applied to predict the future value of the manipulated variable (the set point of jacket temperature, Tjsp). The input and output data pattern of
neural network inverse model is given in Fig. 3
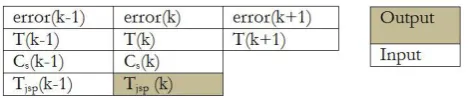
The input and output of inverse model is shown in Fig. 3 which is 9 input nodes that consists of error(k-1), error(k), error(k+1), CS(k-1), CS(k), T(k-1), T(k), T(k+1), Tjsp(k-1) and Tjsp(k) as well as 1 output
nodes that is Tjsp(k+1).
The input and output data sets are generated from closed-loop control that is feedback controller (PID) to train the neural network [30-33]. In this section, the generated data for network training, which are the same as the forward model, consist of nominal and plant uncertainty cases ( -30% of U, +30% of Hcrys, -30% of Hevap, +30% of kg and +30% of kp). In addition, the data sets of 18 sets, used to train the
neural network inverse model generated from mathematical models, are normalized based on the equation 25. Then the data sets are combined and randomized. The data sets are divided into 3 groups which consist of 60% training data set, 30% testing data set and 10% validating data set.
Model predictive control using a neural network has been focused by some researchers [21-24]. The neural network model based predictive control strategy in this work is shown in Fig. 4. The neural network forward model is used to predict the future process outputs over the prediction horizon (p). The predictions are passed to the optimization which minimizes a specified objective function. Sequential quadratic programming (SQP) algorithm is used to solve the optimization problem of minimizing as given in Eq. (27). The objective function of the model predictive control strategy is described as follows:
2
21 2
1
min
jsp
p
sp jsp
T i
W T k i T k i W T
(27)Subject to
25 CTjsp k 1 100 C, i = 1,2,3,…,p (28)
sp
T k p T k p (29)
where p is a parameter specifying the prediction horizon, W1is weighting parameter used to give different
weights to different squared tracking error, W2 is weighting parameter of different squared of manipulated
variable and Tsp is the set point of crystallizer temperature as obtained from optimization.
The simulations have been carried out using the neural network model to find a set of suitable control parameter W1, W2, p and m. The prediction horizon p corresponds to the future time interval used to
compute prediction with the neural network model. The control horizon is equal or less than the prediction horizon (m ≤ p). In the same IAE performance case, the choice of W1 and W2 are chosen 1 and 2,
respectively. The prediction horizon and control horizon are set at 6 and 6, respectively. In the best performance case, W1 and W2 are varied and then fixed at 1 and the prediction horizon and control horizon
are set at 10 and 1, respectively.
6.
Results and Discussion
6.1. Dynamic Optimization
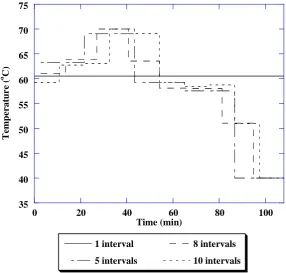
The dynamic optimization calculates the optimal temperature profile by optimizing the objective function. Figure 5 shows crystallizer temperature profiles that provide maximum average crystal size and Fig. 6 shows crystallizer temperature profiles that provide maximum crystal yield. In the optimization order, it classified into 4 sets which consist of1 , 5, 8 and 10 intervals. In the optimization problems 1 and 2 get the maximum average crystal size and crystal yield at 10 intervals. The dynamic optimization is applied to be a set point of crystallizer temperature in PID control, neural network direct inverse control (NNDIC) and neural network model based predictive control. Moreover, it is applied in nominal case and mismatch case for controlling.
The final product qualities in terms of average crystal size (Law) and crystal yield are shown in Table 3.
It can be seen that OPT1 provides larger average crystal size than OPT2 about 6.46% but OPT2 gives more crystal yield than OPT1 about 3.39%. Moreover, the average crystal size and crystal yield which are obtained from the heating/cooling evaporative crystallization method are more than cooling and evaporation method. From Table 4, it can be seen that the heating/cooling evaporative crystallization method produce the average crystal size of 19% and 30% larger than cooling and evaporation method, respectively as well as the obtained crystal yield from heating/cooling evaporative crystallization method is higher than cooling and evaporation method about 50%.
6.2. Neural Network Forward Model
6.3. Neural Network Inverse Model
In this part, the optimal structure of the neural network inverse model consists of 9 nodes in the input layer, 2 nodes in the first hidden layer, 12 nodes in the second hidden layer, and 1 node in the output layer and can be written in the form of [9-2-12-1]. The neural network inverse model can provide sufficiently good jacket temperature set point, Tjsp. The mean squared error index of both testing and validation are given in
Table 6.
6.4. Comparisons among PID, NNDIC and NNMPC Controllers
Here, the optimal temperature profiles obtained from the optimization with the objective function 1 and 2 (OPT1 and OPT 2) are computed and the PID, NNDIC and NNMPC controllers have been formulated to provide tracking of the profile by manipulating of the jacket temperature set point. The optimal crystallizer temperature profiles are shown in Figs. 5-6. In this case, the optimization 1 (OPT1) is chosen to study. The simulations are divided into 2 cases: a nominal case and parameter mismatches case.
6.4.1. Nominal case
In this case, the PID and NNMPC controllers are tuned to achieve their best control performances. Table 7 shows the best performances of the PID and NNMPC controllers. Figures 7-8 show the response profiles of crystallizer temperatures and the set point of jacket temperature. It can be seen that both controllers can bring the temperature closely to set point with small overshoot and oscillation. However, the PID controller provides more overshoot and oscillation than the NNMPC controller does.
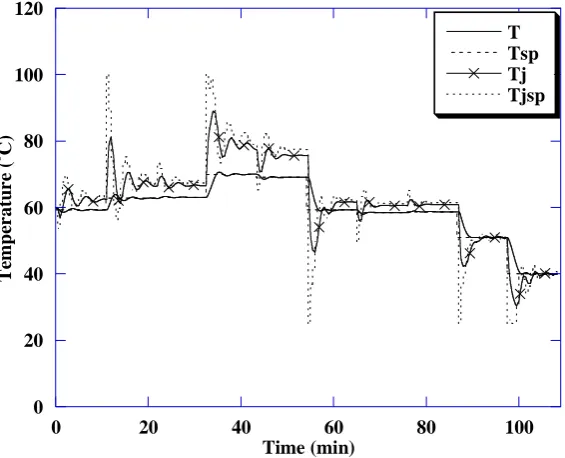
6.4.2. Parameter mismatches case
The robustness of the controller is studied according to parameter mismatches. The parameter mismatches consist of 5 cases: decreasing 30% of U, increasing 30% of Hcrys, decreasing 30% of Hevap, increasing 30%
of kp and increasing 30% of kg from its nominal value. The control performances of both controllers
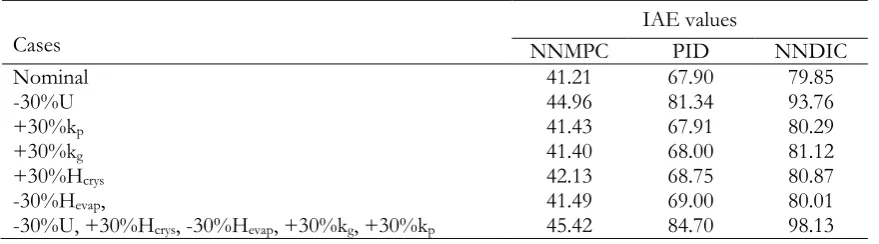
regarding to parameter mismatches are divided into 6 scenarioes shown in Table 7. Figures 9-11 show the response profiles of crystallizer temperature and the set point of jacket temperature in parameter mismatch case (-30%U). Table 7 summarizes the control performance of the PID, NNDIC and NNMPC controllers in terms of the absolute error (IAE). It can be seen that the NNMPC controller provides superior control performance in all cases.
7.
Conclusions
In this study, the implementation of a dynamic optimization and neural network of a batch heating/cooling evaporative crystallizer for production of citric acid is presented. This neural networks use tan-sigmoid and linear as activation functions. The Levenberg-Marquardt algorithm is applied for training the network. The optimal structure of neural network forward model consists of 6 nodes in input layer, 14 nodes in first hidden layer, 12 nodes in second hidden layer, and 2 nodes in output layer. The optimal structure of neural network inverse model consists of 9 nodes in the input layer, 2 nodes in first the hidden layer, 12 nodes in the second hidden layer, and 1 node in the output layer. In addition, the optimization problems 1 and 2 get the maximum average crystal size and crystal yield, respectively. The optimal product qualities based on two objective functions are carried out to obtain average crystal sizes and crystal yields. Furthermore, the neural network model predictive control (NNMPC) has been formulated and tested under plant/model mismatches. It was found that the NNMPC can provide superior control performance than the PID in all cases.
The authors would like to acknowledge the support from the Faculty of Engineering, Burapha University under the contract # 36/2553 and The Institutional Research Grant (The Thailand Research Fund)(IRG 5780014) and Chulalongkorn University (Contract No. RES_57_411_21_076).
References
[1] S. C. Mukhopadhyay and M. A. F. Epsteln, “Computer model for crystal size distribution control in a semi-batch evaporative crystallizer,” Industrial and Engineering Chemistry Process Design and Development, vol. 19, pp. 358-364, 1980.
[2] P. S. Neelakantan and D. Mukesh, “Computer modeling of a continuous evaporative crystallizer,”
Industrial and Engineering Chemistry Process Design and Development, vol. 18, pp. 56-59, 1979.
[3] K. Fagervik, O. Konstari, and R. V. Schalien, “Control of batch evaporative crystallization of sugar by means of adaptive simulation,” in Proc. American Control Conferences, June 15-17, 1988,pp. 677-683. [4] L. Sowul and M. A. F. Epsteln, “Crystallization kinetics of sucrose in a CMSMPR evaporative
crystallizer,” Industrial and Engineering Chemistry Process Design and Development, vol. 20, pp 197-203, 1981. [5] G. Fevotte, D. Canpont, and M. Lakrori, “Non linear control of a batch evaporative crystallization
using an algorithm of “L/A” type,” in Proc. of the 9thInternational Conference on Analysis and Optimization of Systems, Antibes, France, vol. 144, Jun. 12, 1990, pp. 37-46.
[6] A. Mesbah, A. N. Kalbasenka, A. E. M. Huesman, H. J. M. Kramer, and P. M. J. Van den Hof, “Real-time dynamic optimization of batch crystallization processes,” in Proceedings of the 17th World Congress the International Federation of Automatic Control, Seoul, Korea, July 6-11, 2008.
[7] W. Paengjuntuek, P. Kittisupakorn, and A. Arpornwichanop,“Batch-to-batch optimization of batch crystallization processes,” Chinese Journal of Chemical Engineering , vol. 16, no. 1, pp. 26-29 , 2008. [8] A. Mesbah, A. E. M. Huesman, H. J. M. Kramer, Z. K. Nagy, and P. M. J. Van den Hof, “Real-time
control of a semi-industrial fed-batch evaporative crystallizer using different direct optimization strategies,” AIChE Journal, vol. 57, no. 6, pp 1557–1569, Jun. 2011.
[9] K. L. Choong and R. Smith, “Novel strategies for optimization of batch, semi-batch and heating/cooling evaporative crystallization,” Chemical Engineering Science, vol.59, pp. 329–343, 2014. [10] P. Kittisupakorn, P. Tangteerasunun, and P. Thitiyasook, “Dynamic neural network modeling for
hydrochloric acid recovery process,” Korean Journal of Chemical Engineering, vol. 22, no. 6, pp. 813-821, 2005.
[11] A. Arpornwichanop and N. Shomchoam, “Control of fed-batch bioreactors by a hybrid on-line optimal control strategy and neural network estimator,” Neurocomputing, vol. 72, pp. 2297–2302, 2009. [12] E. Nueaklong, P. Kittisupakorn, and W. Daosud, “Dynamic and control of heat exchanger system in
hard chrome electroplating using neural network,” in Proc. The 7th International Conference on Computing and Information Technology, Bangkok, Thailand, May 11-12 , 2011.
[13] I. M. Mujtaba, N. Aziz, and M. A. Hussain, “Neural network based modeling and control in batch reactor,” Chemical Engineering Research and Design, vol. 84, no. 8, pp. 635–644, 2006.
[14] K. G. Keong, W. Sha, and S. Malinov, “Artificial neural network modelling of crystallization temperatures of the Ni–P based amorphous alloys,” Materials Science and Engineering, vol. A365, pp. 212–218, 2004.
[15] K. V. Kumar, P. Martins, and F. Rocha, “Modelling of the batch sucrose crystallization kinetics using artificial neural networks: Comparison with conventional regression analysis,” Industrial and Engineering Chemistry Research, vol. 47, pp. 4917-4923, 2008.
[16] M. Yang and H. Wei, “Application of a neural network for the prediction of crystallization kinetics,”
Industrial and Engineering Chemistry Research, vol. 45, pp. 70-75, 2006.
[17] P. Georgieva and S. F. de Azevedo, “Application of feed forward neural networks in modeling and control of a fed-batch crystallization process NN modeling and estimator,” in Proceedings of World Academy of Science, Engineering and Technology, vol. 12, Mar. 2006.
[18] S.Y. Wong, R. K. Bund, R. K. Connelly, and R. W. Hartel, “Modeling the crystallization kinetic rates of lactose via artificial neural network,” Crystal Growth and Design, vol. 10, no. 6, pp. 2620-2628, 2010. [19] T. Charoenniyom, P. Kittisupakorn, and W. Daosud, “Neural network modeling and optimization of
[20] C. Damour, M. Benne, L. Boillereaux, B. Grondin-Perez, and J. P. Chabriat, “NMPC of an industrial crystallization process using model-based observers,” Journal of Industrial and Engineering Chemistry, vol. 16, pp. 708–716, 2010.
[21] P. Kittisupakorn, P. Thitiyasook, M. A. Hussain, and W. Daosud, “Neural network based model predictive control for a steel pickling process,” Journal of Process Control, vol. 19, pp. 579–590, 2009. [22] D. L. Yu and J. B. Gomm, “Implementation of neural network predictive control to a multivariable
chemical reactor,” Control Engineering Practice, vol. 11, pp. 1315–1323, 2003.
[23] M. Ławryńczuk, “Modelling and nonlinear predictive control of a yeast fermentation biochemical reactor using neural networks,” Chemical Engineering Journal, vol. 145, pp. 290–307, 2008.
[24] P. Georgieva and S. F. de Azevedo, “Neural network-based control strategies applied to a fed-batch crystallization process,” International Journal of Engineering and Mathematical Sciences, vol. 3, no. 3, pp. 224-233, 2007.
[25] K. L. Choong and R. Smith, “Optimization of batch cooling crystallization,” Chemical Engineering Science, vol. 59, pp. 313–327, 2004.
[26] A. Apelblat, M. Dov, J. Wisniak, and J. Zabicky, “The vapour pressure of water over saturated aqueous solutions of malic, tartaric, and citric acids, at temperatures from 288 K to 323 K,” The Journal of Chemical Thermodynamics, vol. 27, pp. 35-41, 1995.
[27] L. L. Wang, T. C. Wallace, S. R. Fredrick, G. Hampel, and J. H. Steele, “Vacuum evaporation of KCI-NaCI salts: part II. Vaporization-rate model and experimental results,” Metallurgical and Materials Transactions B, vol. 27B, pp. 433-443, Jun. 1996.
[28] M. Bohlin and A. C. Rasmuson, “Application of controlled cooling and seeding in batch crystallization,” The Canadian Journal of Chemical Engineering, vol. 70, pp. 120-126, Feb. 1992.
[29] W. Paengjuntuek, P. Kittisupakorn, and A. Arpornwichanop, “Optimization and nonlinear control of a batch crystallization process,” Journal of the Chinese Institute of Chemical Engineers, vol. 39, pp. 249-256, 2008.
[30] A. Karniel, R. Meir, and G. F. Inbar, “Best estimated inverse versus inverse of the best estimator,”
Neural Networks, vol. 14, pp. 1153-1159, 2001.
[31] J. Nakanishi and S. Schaal, “Feedback error learning and nonlinear adaptive control,” Neural Networks, vol. 17, pp. 1453–1465, 2004.
[32] H. Gomi and M. Kawato, “Learning control for a closed loop system using feedback-error-learning,” in Proceedings of the 29th Conference on Decision and Control, Honolulu, Hawaii, Dec. 1990.
[33] Z. Yan, L. Xiuxia, Y. Peng, C. Zengqiang, and Y. Zhuzhi, “Modeling and control of nonlinear discrete-time systems based on compound neural networks,” Chinese Journal of Chemical Engineering, vol. 17, no. 3, pp. 454-459, 2009.
[34] K. Konakom, P. Kittisupakorn, and I. M. Mujtaba, “Batch control improvement by model predictive control based on multiple reduced-models,” Chemical Engineering Journal, vol. 145, pp. 129–134, 2008. [35] W. Daosud, P. Thitiyasook, A. Arpornwichanop, P. Kittisupakorn, and M. A. Hussain, “Neural
network inverse model-based controller for the control of a steel pickling process,” Computers and Chemical Engineering, vol. 29, pp. 2110–2119, 2005.
Appendix I: List of Tables:
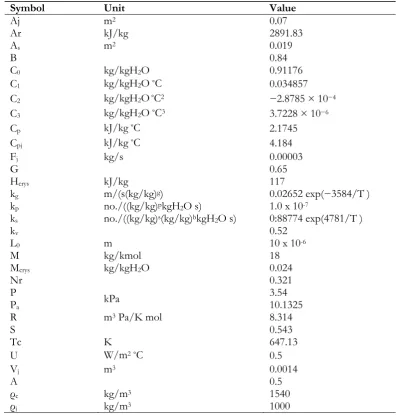
Table 1. Crystallization and physical properties of citric acid–water system.
Symbol Unit Value
Aj m2 0.07
Ar kJ/kg 2891.83
As m2 0.019
B 0.84
C0 kg/kgH2O 0.91176
C1 kg/kgH2O ๐C 0.034857
C2 kg/kgH2O๐C2 −2.8785 × 10⁻⁴
C3 kg/kgH2O ๐C3 3.7228 × 10⁻⁶
Cp kJ/kg ๐C 2.1745
Cpj kJ/kg ๐C 4.184
Fj kg/s 0.00003
G 0.65
Hcrys kJ/kg 117
kg m/(s(kg/kg)g) 0.02652 exp(−3584/T )
kp no./((kg/kg)pkgH2O s) 1.0 x 10⁻⁷
ks no./((kg/kg)s(kg/kg)bkgH2O s) 0:88774 exp(4781/T )
kv 0.52
L0 m 10 x 10-6
M kg/kmol 18
Mcrys kg/kgH2O 0.024
Nr 0.321
P
Pa kPa
3.54 10.1325
R m3 Pa/K mol 8.314
S 0.543
Tc K 647.13
U W/m2๐C 0.5
Vj m3 0.0014
Α 0.5
ρc kg/m3 1540
ρj kg/m3 1000
Table 2. Initial value in this crystallization process.
Symbol Value
T
mi, i = 0, 1, 2, 3, 4
M Cs
60 ๐C
0 1.0 kg
2.871 kg/kgH2O
Table 3. The simulation results obtained from two dynamic optimization problems.
Problem Law(µm) Crystal yield (kg)
OPT1 451 1.585
[image:11.595.97.497.129.545.2] [image:11.595.186.407.578.647.2] [image:11.595.165.429.683.722.2]Table 4. Comparison of the product quality among different crystallization method.
Method Law(µm) Crystal yield(kg)
Unseeded coolinga 296 0.787
Evaporationa 315 0.787
Heating/cooling evaporative 451 1.585
aObtained from Choong and Smith [18].
Table 5. Mean squared error value of testing and validation in the neural network forward model.
Data sets No. of samples Mean squared error Testing data 1 583 5.3528x10⁻⁵
Testing data 2 583 8.0095x10⁻⁵
Validation data 389 4.2852x10⁻⁵
Table 6. Mean squared error value of testing and validation in the neural network inverse model.
Data sets No. of samples Mean squared error Testing data 1 583 9.4699x10⁻⁶
Testing data 2 583 8.3586x10⁻⁶
Validation data 388 1.1091x10⁻⁵
Table 7. Performance of controller for nominal and parameters mismatch cases.
Cases NNMPC IAE values PID NNDIC
Nominal 41.21 67.90 79.85
-30%U 44.96 81.34 93.76
+30%kp 41.43 67.91 80.29
+30%kg 41.40 68.00 81.12
+30%Hcrys 42.13 68.75 80.87
-30%Hevap, 41.49 69.00 80.01
[image:12.595.67.529.104.167.2] [image:12.595.146.443.204.256.2] [image:12.595.150.441.293.344.2] [image:12.595.80.520.381.503.2]Appendix II: List of Figures
Prepare input and output data for training, validation and testing
from mathematical model
Design the structure of network (the number of hidden layers and nodes in hidden Layer, Activation function) and
choose the error function
Initialize the weight factors
Train the network with training data sets
Test and validate the network
Change the weight factors Set the new network structure
Obtain the neural network model
yes
yes
no
no
Examine the error
Fig. 1. Steps of neural network structure designing.
Fig. 2. Input and output data pattern for forward model.
[image:13.595.110.483.107.514.2] [image:13.595.191.426.653.702.2]Fig. 4. The neural network based model predictive control strategy.
35 40 45 50 55 60 65 70 75
0 20 40 60 80 100
Data 1 20:24:54 19/8/2011
1 interval
5 intervals
8 intervals
10 intervals
T
emp
er
atu
r
e (
o C)
Time (min)
[image:14.595.132.462.80.233.2] [image:14.595.141.428.278.551.2]35 40 45 50 55 60 65 70 75
0 20 40 60 80 100
1 interval
5 intervals
8 intervals
10 intervals
T
emp
er
atu
r
e (
o C)
Time (min)
Fig. 6. Temperature profile for the optimization problem 2.
0 20 40 60 80 100 120
0 20 40 60 80 100
T Tsp Tj Tjsp
Te
mp
er
atu
r
e (
o C)
Time (min)
Fig. 7. The crystallizer temperature control and the manipulated variable (Tjsp) in nominal case of PID
[image:15.595.140.430.80.351.2] [image:15.595.156.439.394.623.2]0 20 40 60 80 100 120
0 20 40 60 80 100
T Tsp Tj Tjsp
Te
mp
er
atu
r
e (
o C)
Time (min)
Fig. 8. The crystallizer temperature control and the manipulated variable (Tjsp) in nominal case of
NNMPC controller.
0 20 40 60 80 100 120
0 20 40 60 80 100
T Tsp Tj Tjsp
Te
mp
er
atu
r
e (
o C)
Time (min)
Fig. 9. The crystallizer temperature control and the manipulated variable (Tjsp) in parameter mismatch case
[image:16.595.154.439.80.310.2] [image:16.595.155.441.364.593.2]0 20 40 60 80 100 120
0 20 40 60 80 100
T Tsp Tj Tjsp
Te
mp
er
atu
r
e (
o C)
[image:17.595.154.439.80.312.2]Time (min)
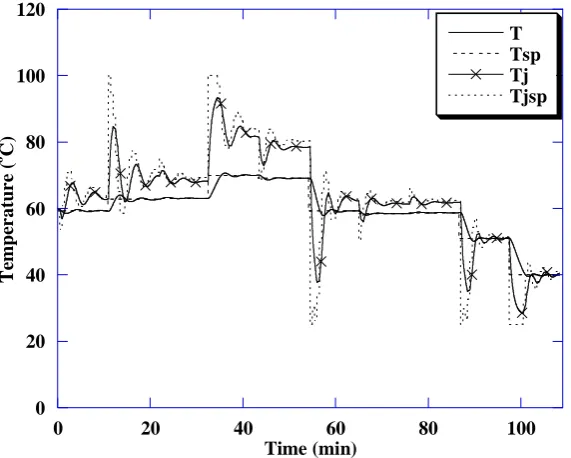
Fig. 10. The crystallizer temperature control and the manipulated variable (Tjsp) in parameter mismatch case
(-30%U) of NNDIC controller.
0 20 40 60 80 100 120
0 20 40 60 80 100
T Tsp Tj Tjsp
Te
mp
er
atu
r
e (
o C)
Time (min)
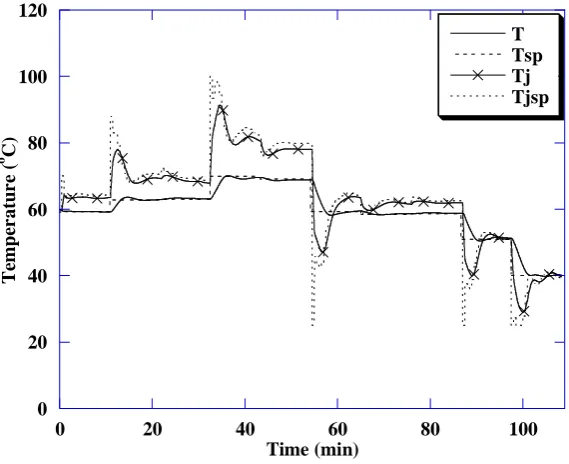
Fig. 11. The crystallizer temperature control and the manipulated variable (Tjsp) in parameter mismatch case
[image:17.595.154.440.365.592.2]