COMPUTATIONAL FLUID DYNAMICS (CFD) PREDICTION OF FLOW AND TEMPERATURE DISTRIBUTION IN DRYING COMPARTMENT
YAP KENT PENG
This report is submitted as partial requirement for the fulfillment of the Bachelor of Mechanical Engineering (Thermal Fluids) Degree Programme
Faculty of Mechanical Engineering Universiti Teknikal Malaysia Melaka
ii
DECLARATION
“I hereby, declare this report is the result of my own research except as cited in the references”
Signature : ……….
Author’s Name : YAP KENT PENG
iii
iv
ACKNOWLEDGEMENT
This work would not be done without the help and support from others. I would like to thank to my Projek Sarjana Muda (PSM) supervisor, Pn. Fatimah Al-Zahrah binti Mohd Sa’at for the suggestion of this research. Her supervision, support and guidance throughout this Projek Sarjana Muda (PSM) is invaluable to this project.
v
ABSTRAK
vi
ABSTRACT
vii
TABLE OF CONTENTS
CHAPTER TOPIC PAGE
DECLARATION ii
DEDICATION iii
ACKNOWLEDGEMENT iv
ABSTRAK v
ABSTRACT vi
TABLE OF CONTENTS vii
LIST OF FIGURES x
LIST OF TABLES xii
LIST OF SYMBOLS xiii
LIST OF APPENDICES xv
I INTRODUCTION 1
1.1 Background 1
1.2 Objectives 3
1.3 Scopes 3
1.4 Problem Statement 3
II LITERATURE REVIEW 4
2.1 Background 4
2.2 Development of Numerical Fabric Model 5
2.3 Drying Model Development and Simulation 9
2.4 CFD Simulation 11
2.5 Governing Equations of the Fluid Flow 19
viii
2.7 Fabric drying model 21
III METHODOLOGY 23
3.1 Introduction 23
3.2 Preprocessing 25
3.2.1 Problem Analysis 25
3.2.2 Geometry Creating 26
3.2.3 Grid Generating 27
3.2.4 Defining of Boundary Conditions Specifications 28 and Fluid Properties 3.2.5 Mesh Export 29
3.3 Solving 30
3.3.1 Choosing the suitable solver 30
3.3.2 Compiling and hooking user defined functions 31
3.3.3 Setting Material Properties 32
3.3.4 Setting Operating Condition and Boundary 32
Conditions 3.3.5 Configuring Solution Controls 34
3.3.6 Initializing the solution variables and activating 34
solution monitor 3.3.7 Solving 35
3.3.8 Solving the unsteady simulation of the 36
thermal and moisture transport equation 3.4 Post-processing 37
3.5 Result Validation 37
3.6 Simulation with Different Parameter 39
IV RESULT ANALYSIS AND DISCUSSION 40
4.1 Model Prediction 40
4.2 Result Validation with experiment data 42
4.3 Air Flow Velocity Contour 45
4.4 Moisture Content Changes in the Wet Fabric 47
ix
Process
4.6 Simulation of the clothes dryer designed by the 55 researcher in UTeM
4.6.1 Drying curve of the wet cotton in the clothes 55 Dryer
4.6.2 Air flow velocity contour inside the clothes dryer 56 4.6.3 Moisture Content Changes in the Wet Fabric 58 4.7 Result analysis and study on the clothes dryer design 60
V CONCLUSION 61
5.1 Overall conclusion 61
5.2 Recommendation for future work 62
REFERENCES 63
BIBLIOGRAPHY 66
APPENDICES 67
x
LIST OF FIGURES
NO TITLE PAGE
1.1 Schematics of the CDURH drying compartment 2 1.2 Drying rack inside the drying compartment 2 2.1 Temperature contours for flow over clothed 2D arm for 12
5, 25 and 75 second
2.2 Water vapor mass fraction contours for flow over clothed 13 2D arm for 5, 25 and 75 second
2.3 Streamlines around the object 14
2.4 Static temperature contour around the object 15 2.5 Isometric view of the fabric structure 16 2.6 Computational domain with hybrid mesh 16 2.7 Velocity magnitude contour in machine direction and cross 16
machine direction
2.8 Different designs of the humid-air dryer 17
2.9 Drying curves of both dryers 18
xi
4.2 Simulation result of moisture content against time for Case B 41
4.3 Experimental and simulation results of fabric drying (Case A) 42
4.4 Experimental and simulation results of fabric drying (Case B) 43
4.5 Air flow velocity contour inside clothes dryer (Case A) 45
4.6 Air flow velocity contour inside clothes dryer (Case B) 46
4.7 Moisture content in the fabric after 500s (Case A) 48
4.8 Moisture content in the fabric after 500s (Case B) 48
4.9 Moisture content in the fabric after 1000s (Case A) 49
4.10 Moisture content in the fabric after 1000s (Case B) 49
4.11 Moisture content in the fabric after 1500s (Case A) 50
4.12 Moisture content in the fabric after 1500s (Case B) 50
4.13 Comparison of temperature changes on the fabric surface 51
4.14 Temperature contour on the fabric surface after 200s (Case A) 52
4.15 Temperature contour on the fabric surface after 400s (Case A) 53
4.16 Temperature contour on the fabric surface after 200s (Case B) 53
4.17 Temperature contour on the fabric surface after 400s (Case B) 54
4.18 Drying curve for the clothes dryer 55
4.19 Air flow contour in the clothes dryer 56
4.20 Air flow vector in the clothes dryer 57
4.21 Moisture content in the fabric after 2500 s of drying 58
4.22 Moisture content in the fabric after 5000 s of drying 59
xii
LIST OF TABLES
NO TITLE PAGE
xiii
vLIST OF SYMBOLS
RAC = Residential air conditioner
CHURH = Clothes drying using rejected heat CFD = Computational Fluid Dynamic
ρ = Density, kg/m3
t = Time, s
= Overall velocity vector, m/s
Sm = Mass flux, kg/m2.s
p = Pressure, Pa = Stress tensor, Pa
g = Gravitational acceleration, m/s2 = Force vector, N
E = Total energy, J
v = Velocity magnitude, m/s
h = Species enthalpy, J/kg
keff = Effective thermal conductivity, W/mK
cp = Heat capacity at constant pressure, J/kg-K
= Mass flux; diffusion flux, kg/m2.s
Sh = heat source, W/m2
Y = Mass fraction
Si = Source term for porous medium, N α = Permeability, m2
µ = Viscocity, kg/ms C2 = Resistance factor
Dp = Mean particle diameter, m ϵ = Void fraction of porous media Nu = Nusselt number
F
xiv
hsf = Convection heat transfer coefficient, W/m2.K d = Diameter of spherical particles, m
kf = Effective thermal conductivity, W/m.K Re = Reynolds number
Pr = Prandtl number conv
Q = Total heat transfer in convection, W A = Specific surface area of fabric, m2
s
T = Surface temperature, K
T = Air stream temperature, K Sh =Sherwood number
hm = Mass transfer coefficient, m/s
D = Mass diffusivity of water vapor, m2/s Sc = Schmidt number
Le = Lewis number
αv = Thermal diffusivity, m2 /s conv
m = Total mass transfer in convection, kg/s s
v,
= Mass concentration of water vapor in fabric surface, kg/m3
,
v
= Mass concentration of water vapor in air stream, kg/m3
Pv, = Vapor pressure of water, Pa
xv
LIST OF APPENDICES
NO TITLE PAGE
A 3-D simulation of Clothing 67
B Gantt Chart for PSM 1 69
C Gantt Chart for PSM 2 70
D Source codes of fabric model (user defined function) 71
E Comparison of Fiber properties 79
1
CHAPTER I
INTRODUCTION
1.1 Background
Conventional clothes dryer or a tumble dryer is used to remove the moisture of the clothes or fabrics that have been washed. The domestic dryer consists of a drum which the heated air is circulated through to evaporate the moisture of the loaded clothes. Generally, most the household tumble dryers are powered electrically or gas.
2
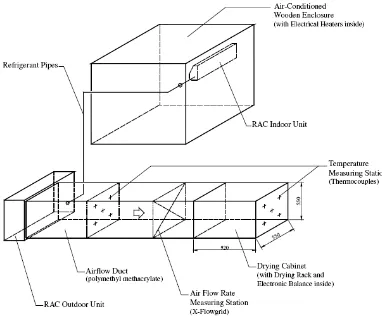
[image:17.595.137.519.197.513.2]This project continues the CDURH research by analyzes and investigates the air flow pattern and the temperature distribution of the drying compartment with the aid of a computational fluid dynamic (CFD) program. Simulations with various configurations of inlet air velocity, compartment size, textile material are observed.
Figure 1.1: Schematics of the CDURH drying compartment (Source: Deng and Han, (2003))
[image:17.595.244.455.598.713.2]3
1.2 Objectives
To develop the wet fabric drying model for the CFD solver To validate the simulation result of clothes drying process
To study and analyze the hot air flow and temperature distribution of drying compartment
Predict the air flow and temperature distribution of the clothes dryer by running simulation with different parameters
1.3 Scopes
The project will focus on the analysis of the drying cabinet. The scope covered:
a) Literature study on clothes drying b) Drawing of the drying compartment
c) Simulation of clothes dryer using Fluent to obtain the air flow pattern and temperature distribution
1.4 Problem Statement
4
CHAPTER II
LITERATURE REVIEW
2.1 Background
The clothes drying using rejected heat (CDURH) drying compartment consists of an air flow duct, a drying cabinet and a drying rack. By connecting the residential air-conditioner outdoor unit (condenser) with the air flow duct, the heated air flow through the wet clothes in the drying compartment to evaporate the moisture content in the clothes. There are several studies on the tumbler clothes dryer had been done by researcher, which focus on determining the parameter of energy consumption and improving the performance of the clothes dryer.
5
Ng and Deng (2008) did a research on developing a new termination control method for a clothes dryer by using both mathematical modeling and experimental approaches. They have developed the drying models in a constant-rate drying period (CRDP) and a falling-rate drying period (FRDP) based on existing knowledge and theories of drying. An experiment on cotton fabrics drying in different drying environments was carried out to determine the unknowns, critical point and the drying index in the drying models. Meanwhile, the experimental results also showed that the models were adequate and can be used in new termination control design.
2.2 Development of Numerical Fabric Model
In the development of the fabric model, most of the studies developed the textile model by modifying and applying the theory of heat and mass transport through the porous material. There are several studies focused on determining the thermal comfort of clothing by inspecting on the interaction between the moisture transport and heat transfer in the fabric.
Hussain and Dincer (2003) has presented an article deal with the numerical modeling of heat and moisture transfer during the drying process of a two-dimensional rectangular object subjected to convective boundary conditions. Assumptions were made where the drying takes place as a simultaneous heat and moisture transfer whereby moisture is vaporized by air, which passes over a moist object. By discretizing the governing equations representing the drying process in a 2-D rectangular object using and explicit finite-difference approach, then he developed the computer code to predict the temperature and moisture distributions inside the object. The results of numerical simulation were then validated by experimental data. From the research, the transient temperature and moisture distribution inside the rectangular object at different time periods were obtained.
non-6
hygroscopic clothing materials by including many important factors which are usually ignored in the analysis of heat and mass transfer through textile materials. The equations also allows for the unsteady capillary wicking of sweat through fabric structure, condensation and evaporation of sweat within various layers of the clothing system, forced gas phase convection through the porous structure of a textile layer and the swelling and shrinkage of fibers.
The partial differential equations developed by Gibson were then used in the modeling of convection/ diffusion process in porous textiles with inclusion of humidity-dependent air permeability, which was done by Gibson and Charmchi (1997). By neglecting the gas phase convection and liquid capillary transport, the accurate models for heat and mass transfer through porous textile based materials were developed. They developed the numerical code to solve the set of nonlinear coupled equation and applied to an experimental apparatus designed to simulate transient and steady state convection/ diffusion conditions of textile materials. From their research, it was found that the temperature changes of hygroscopic textiles subjected to step changes in environmental relative humidity are due to sorption of water vapor from the flows on the two sides of the material, and it relates to textile fiber equilibrium sorption isotherms (contour line of equal temperature) and sorption kinetics, as well as the physical structure and thermal properties of the textile. In the conditions when both combined diffusion and convection occur, the effect of fiber swelling results in significant changes in the resistance to convective flow and the total mass flux across the textile layer.
7
of liquid in the plane of the fabric and evaporation of moisture to the atmosphere surrounding the fabric.
Heat exchange between human body and the environment is significantly affected by the dynamic response of the clothing system. Ghali et al. (2002) conducted a study on the modeling of heat and moisture transport by periodic ventilation of thin cotton fibrous media to investigate the coupled convection heat and moisture transfer within the clothing system subjected to sinusoidal air layer thickness variation. They also developed a mathematical model to predict the periodic fabric regain, the fabric temperature and the transient conditions of the air layer located between the fabric and the skin. Several experiments were conducted in environment chambers under controlled conditions using a sweating hot plate at 35oC which represents the human skin and a gear motor to generate the oscillating fabric motion. The experiment was first done using a dry isothermal hot plate to measure the sensible heat transfer. Then, the second set of experiments was conducted with an isothermal sweating hot plate to obtain the total heat (sensible and latent) transport from the plate. They found out that the regain increases sharply in the initial period of exposure and then increases at a slower mean rate in an oscillating pattern. As the thickness of the air layer increases, the air flows from the outside and the fabric regain decreases due to the lower humidity of the outside air. When the thickness of the air layer decreases, fabric regain tends to increase since the higher humidity air flows out from the inside air layer. The predicted heat and mass transport through the air spacing layer and fiber clothing system from the mathematical model shows good agreement with the experiment measured time-averaged values with the discrepancy between measured and calculated heat losses below 32%.
8
is large. On the other way, the heat flow are driven by the temperature gradients, thus the adsorption and desorption of moisture by the fibrous media has large influence on the heat flux through the media as well. For porous media drying, they also concluded that the small decrease in regain results in large cooling effect, which could eliminate the partial pressure gradient that is driving the moisture removal. Thus, the drying process proceeds at very low rate in the absence of a heat source.
Li and Zhu (2003) studied on the simultaneous heat and moisture transfer with moisture sorption, condensation and capillary liquid diffusion in porous textiles. They have developed a dynamic model of liquid water transfer coupled with moisture sorption, condensation, and heat transfer in porous textile by incorporating the physical mechanism of liquid diffusion in porous textiles into a coupled heat and moisture transfer model developed previously. An equation describing the liquid diffusion behavior is also developed in the form of diffusion coefficient. Then, they developed the numerical computational scheme to solve the coupled equations involves a fractional volume of fluid method. In order to validate the model, the experiments measuring fabric surface temperature are conducted. From the computational result, they found that the dry fabric exhibits three stages of transport behavior responding to change in humidity. At the first stage, the water vapor diffusion and liquid water diffusion are the dominating process and reach to steady states within a second. Mean while, the liquid flow out of the regions of higher liquid content to drier regions, driven by surface tension force. Followed by second stage, a very slow process; the moisture sorption of fibers which take a minute to few hours to complete. And finally the third state is the steady state where all four forms of moisture transport and the heat transfer process become steady and the coupling effects among them become less significant.
9
condensation or evaporation; liquid, vapor and absorbed water diffusion and heat conduction and contact resistances between layers. Then the results were validated by comparing with the existing in literatures. They concluded that the hygroscopic character of a fabric can be expressed by a diffusion coefficient, which is a function of water content.
A research was conducted (Crow and Osczevski 1994) to examine how fiber and fabric properties affect the drying time of a wide range of textile materials. They conducted an experiment by measuring the time taken for the freely absorbed water in each specimen to be completely dried in the atmosphere of 20 oC and 65% relative humidity. The time to dry was taken when the mass of the specimen reached 105% of its dry mass with the extra 5% reflects the accuracy of the balance used. They found that the drying time of a fabric is independent of its fibre type or regain, but dependent on the amount of the water initially contained in the fabric which depends to a great extent on the thickness of fabric. The water evaporation rate in fabric was also found to be greater than equivalent volume of free standing water.
2.3 Drying Model Development and Simulation
The drying process of the object is depending on the environmental factors such as the air velocity, ambient temperature and pressure. The drying study is applicable to variety of materials such as textile, wood, and food. There are plenty of studies have been done on the food drying process. Many drying models were developed and simulated so that the dried food quality could be predicted and controlled well.