Multi-sensor, multi-temporal, and
ultra-high resolution
environmental remote sensing
from UAVs
by
Darren James Turner
BSc. Grad Dip (ASOS) (Hons)
(University of Tasmania)
A thesis submitted in fulfilment of the requirements for a Degree of Doctorate of Philosophy at the School of Land and Food,
Declaration of Originality
This thesis contains no material which has been accepted for a degree or diploma by the University or any other institution, except by way of background information and duly acknowledged in the thesis, and to the best of my knowledge and belief no material previously published or written by another person except where due acknowledgement is made in the text of the thesis, nor does the thesis contain any material that infringes copyright.
Signed
Darren Turner
Date 27th February 2015
Authority of Access
iv
Publications included in this thesis
This thesis contains four manuscripts that have been published in peer reviewed literature and have been incorporated as Chapters 2-5.
Publication citation – incorporated as Chapter 2.
Turner, D., A. Lucieer, C. Watson (2012). "An Automated Technique for Generating Georectified Mosaics from Ultra-High Resolution Unmanned Aerial Vehicle (UAV) Imagery, Based on Structure from Motion (SfM) Point Clouds." Remote Sensing 4(5): 1392-1410
Declaration of co-authorship
Dr Arko Lucieer Dr Christopher Watson Declaration regarding specific elements Extent (1,2,3) Extent (1,2,3)
1. Formulation/identification of the scientific problem that need to be clarified. This includes a condensation of the problem to specific scientific questions that is judged to be answerable via experiments
2 1
2. Planning of the experiments and methodology design, including selection of methods and method development
2 1
3. Involvement in the experimental work 2 0
4. Presentation, interpretation and discussion in
a journal format of the obtained data 2 1
Overall Contribution 2 1
Evaluation scale:
1 – has contributed to this work (10-33%)
2 – has made substantial contribution to this work (34-66%) 3 – has made a major contribution to this work (67-100%)
Signed by Co-authors
Publication citation – incorporated as Chapter 3.
Turner, D., A. Lucieer and L. Wallace (2014). "Direct Georeferencing of Ultrahigh-Resolution UAV Imagery." IEEE Transactions on Geoscience and Remote Sensing 52(5): 2738-2745.
Declaration of co-authorship
Dr Arko Lucieer Dr Luke Wallace Declaration regarding specific elements Extent (1,2,3) Extent (1,2,3)
1. Formulation/identification of the scientific problem that need to be clarified. This includes a condensation of the problem to specific scientific questions that is judged to be answerable via experiments
1 1
2. Planning of the experiments and methodology design, including selection of methods and method development
1 1
3. Involvement in the experimental work 1 1
4. Presentation, interpretation and discussion in
a journal format of the obtained data 1 1
Overall Contribution 1 1
Evaluation scale:
1 – has contributed to this work (10-33%)
2 – has made substantial contribution to this work (34-66%) 3 – has made a major contribution to this work (67-100%)
Signed by Co-authors
vi
Publication citation – incorporated as Chapter 4.
Turner, D., A. Lucieer, Z. Malenovský, D. King and S. Robinson (2014). "Spatial Co-Registration of Ultra-High Resolution Visible, Multispectral and Thermal Images Acquired with a Micro-UAV over Antarctic Moss Beds." Remote Sensing 6(5): 4003-4024.
Declaration of co-authorship
Dr Arko Lucieer Dr Zbyněk Malenovský Declaration regarding specific elements Extent (1,2,3) Extent (1,2,3)
1. Formulation/identification of the scientific problem that need to be clarified. This includes a condensation of the problem to specific scientific questions that is judged to be answerable via experiments
2 1
2. Planning of the experiments and methodology design, including selection of methods and method development
1 1
3. Involvement in the experimental work 1 1
4. Presentation, interpretation and discussion in
a journal format of the obtained data 1 1
Overall Contribution 1 1
Diana H. King Dr Sharon A. Robinson Declaration regarding specific elements Extent (1,2,3) Extent (1,2,3)
1. Formulation/identification of the scientific problem that need to be clarified. This includes a condensation of the problem to specific scientific questions that is judged to be answerable via experiments
0 0
2. Planning of the experiments and methodology design, including selection of methods and method development
0 0
3. Involvement in the experimental work 1 0
4. Presentation, interpretation and discussion in
a journal format of the obtained data 1 1
Overall Contribution 1 1
Evaluation scale:
1 – has contributed to this work (10-33%)
Signed by Co-authors
Dr Arko Lucieer Dr Zbyněk Malenovský
viii
Publication citation – incorporated as Chapter 5.
Turner, D., A. Lucieer and S. M. de Jong (2015). "Time Series Analysis of Landslide Dynamics Using an Unmanned Aerial Vehicle (UAV)." Remote Sensing 7(2): 1736-1757.
Declaration of co-authorship
Dr Arko Lucieer Dr Steven de Jong Declaration regarding specific elements Extent (1,2,3) Extent (1,2,3)
1. Formulation/identification of the scientific problem that need to be clarified. This includes a condensation of the problem to specific scientific questions that is judged to be answerable via experiments
1 0
2. Planning of the experiments and methodology design, including selection of methods and method development
1 1
3. Involvement in the experimental work 1 1
4. Presentation, interpretation and discussion in
a journal format of the obtained data 1 0
Overall Contribution 1 1
Evaluation scale:
1 – has contributed to this work (10-33%)
2 – has made substantial contribution to this work (34-66%) 3 – has made a major contribution to this work (67-100%)
Signed by Co-authors
Other published material:
A number of other works were published during the preparation of this thesis, but with the exception of relevant citation, they have not been incorporated into the thesis:
Conference papers
Lucieer, A., Robinson, S., Turner, D., Harwin, S., and Kelcey, J. (2012). Using a micro-UAV for ultra-high resolution multi-sensor observations of Antarctic moss beds. ISPRS - International Archives of the Photogrammetry, Remote Sensing and Spatial Information Sciences (Vol. XXXIX-B1, pp. 429–433). doi:10.5194/isprsarchives-XXXIX-B1-429-2012
Turner, D., A. Lucieer and C. Watson (2011). Development of an Unmanned Aerial Vehicle (UAV) for hyper resolution vineyard mapping based on visible, multispectral, and thermal imagery. 34th International Symposium for Remote Sensing of the Environment (ISRSE), Sydney Australia.
Lucieer, A., S. Robinson and D. Turner (2011). Unmanned Aerial Vehicle (UAV) Remote Sensing for Hyperspatial Terrain Mapping of Antarctic Moss Beds based on Structure from Motion (SfM) point clouds. 34th International Symposium for Remote Sensing of the Environment (ISRSE), Sydney Australia.
Turner, D. and A. Lucieer (2013). Using a Micro Unmanned Aerial Vehicle (UAV) for Ultra High Resolution Mapping and Monitoring of Landslide Dynamics. IEEE International Geoscience and Remote Sensing Symposium. Melbourne, Australia.
x
Journal Articles
Lucieer, A., S. deJong and D. Turner (2013). "Mapping landslide displacements using Structure from Motion (SfM) and image correlation of multi-temporal UAV photography." Progress in Physical Geography: 1-20.
Lucieer, A., D. Turner, D. H. King and S. A. Robinson (2014). "Using an Unmanned Aerial Vehicle (UAV) to capture micro-topography of Antarctic moss beds." International Journal of Applied Earth Observation and Geoinformation 27(April): 53-62.
Wallace, L., A. Lucieer, C. Watson, and D. Turner (2012). " Development of a UAV LiDAR System with Application to Forest Inventory. " Remote Sensing 4 (6), pp. 1519–1543.
Abstract
Civilian use of Unmanned Aerial Vehicles (UAVs) has become increasingly common in recent times. Improvements in airframe design and electronics, particularly the mass production of comparatively inexpensive miniaturised inertial and positioning sensors, has enabled the application of UAVs to many and varied tasks. One area of growth in the scientific community has been the use of UAVs for Environmental Remote Sensing (ERS) where high spatial and temporal resolution, the ability to fly on-demand, and data collection from multiple sensors offers substantial advantages over traditional techniques.
For small regions, Micro-UAVs (MUAVs), typically weighing less than 5 kg with flying duration of up to 30 minutes, present an excellent option for collecting the required remotely sensed data for understanding environmental processes that require high resolution (centimetre scale), multi-sensor data. There are, however, several important issues to be considered and further developed. The high resolution images have a small footprint and in most cases, hundreds of overlapping images are required to span the region of interest. These images often contain high perspective distortions (compared to traditional nadir aerial photography) and thus can be difficult to process with conventional techniques and software. For most applications, it is important that the imagery is accurately georeferenced, which is typically undertaken using Ground Control Points (GCPs). Collection of GCPs can be a time-consuming process and detracts from one of the advantages of an MUAV, which is operational flexibility and efficiency. In addition, to acquire multi-sensor datasets, an MUAV will need to carry each of the multiple sensors on separate flights, which means the image datasets from each of these flights need to be accurately co-registered. Finally, if repeat coverage is required over time, data collection and processing methods must be robust and repeatable.
xii
used to demonstrate how specific challenges are addressed and to quantify the accuracy achieved in the context of various environmental monitoring applications.
A methodology to geometrically correct and mosaic UAV imagery using feature matching and Structure from Motion (SfM) photogrammetric techniques was developed. This technique is fully automated and can georectify and mosaic imagery based either on GCPs (achieving an accuracy of 10 – 15 cm) or via a Direct Georeferencing (DG) technique (with an accuracy of 65–120 cm when using the navigation-grade on-board GPS). The DG system, which used the location of the camera at time of exposure as the basis for georeferencing, was limited by the accuracy of the GPS used to measure airframe position (generally a navigation-grade receiver) and the accuracy of the synchronisation between time of exposure and the GPS position record. A camera-GPS module was developed that incorporated a higher accuracy GPS (single frequency carrier phase based unit with an accuracy of 10 – 20 cm) and a camera synchronisation system. Commercial software was used to process and directly georeference the imagery and achieve an absolute spatial accuracy of 11 cm, which is commensurate with the accuracy of the GPS unit used.
A case study that investigated the physiological state of Antarctic moss ecosystems was used to demonstrate that data from multiple sensors can be accurately co-registered. Imagery from each sensor was georeferenced and mosaicked with a combination of commercially available software and custom routines that were based on the Scale Invariant Feature Transform (SIFT) and SfM workflow. The spatial co-registration of the mosaics was measured and found to have a mean root mean squared error (RMSE) of 1.78 pixels. This study also demonstrated that quantitative data can be collected with specialised sensors and then related to plant traits. In particular, the Modified Triangular Vegetation Index (MTVI) was derived from the multispectral data and related to the health of moss quadrats (as measured in-situ) and a statistically significant (R2 = 0.64) relationship was found.
vertical. The accuracy of the co-registration of subsequent DSMs was checked and corrected based on comparing non-active areas of the landslide, which minimised alignment errors to a mean of 7 cm. It was discovered that the methodology could also be applied to historical aerial photography to create a baseline DSM allowing the total displacement of the landslide to be calculated (approximately 6630 m3). This study demonstrated that MUAVs can be used repeatedly to map the dynamics of a landslide over a period of 4 years.
xiv
Acknowledgments
Thanks go to my supervisors Arko Lucieer and Christopher Watson. I warned Arko at the start that my writing would need some work to bring it up to scratch, I hope that at least the latter stages were not too painful. Thanks to Chris for providing an “outside” perspective and particularly for the help to bash the Introduction and Conclusion chapters into shape. Also thanks to both supervisors for their academic guidance throughout the whole process.
Appreciation must also be given to the co-authors of the four papers presented in this thesis : Arko Lucieer, Christopher Watson, Luke Wallace, Dianne King, Sharon Robinson, Zbyněk Malenovský, and Steven de Jong. It was great to work with you and to get each of the papers published with relative ease and I believe this reflects the quality of all your valuable contributions, many thanks.
The Terraluma research team has provided an exciting and interesting group in which to work. Stephen Harwin is thanked particularly for his help with fieldwork, Luke Wallace and Josh Kelcey for their assistance with various image processing algorithms. The team is current undergoing a “changing of the guard”, but I look forward to working with Terraluma into the exciting future that UAV remote sensing holds.
The team of scientists and support staff that helped out during the Antarctic research season at Casey in 2011 are also to be thanked. The data collected on this trip provided the basis for two of the papers and would not have been possible without their assistance. It was fantastic to be able to work in such an amazing place.
The staff at the former School of Geography and Environmental Studies, now the School of Land and Food, are thanked for their support. Elaine Stratford is one to be thanked in particular. At the commencement of my PhD she was Head of School and allowed me time from my job in the School to undertake a part time PhD. Without her early support I never would have been able to start this degree. Thanks also go to the professional staff in the School, not just for their normal roles in supporting a PhD student but for being understanding and “covering for me” when I had to spend time on fieldwork etc. In particular, I am indebted to Paulene Harrowby, Rob Anders, Trish McKay, Dave Green, and Phoebe Banks.
My parents are to be thanked for all their love and support over the years.
xvi
Table of Contents
Declaration of Originality ... iii
Authority of Access ... iii
Publications included in this thesis ... iv
Abstract ... xi
Acknowledgments ... xiv
List of Tables and Figures ... xx
Chapter 1 Introduction ... 1
1.1 Unmanned Aerial Vehicles ... 1
1.1.1 Background ... 1
1.1.2 Definition ... 1
1.1.3 Types, Classifications and Platforms ... 2
1.1.4 Recent trends in UAV utilisation ... 5
1.2 Advantages of MUAVs ... 7
1.2.1 Spatial resolution ... 7
1.2.2 Temporal resolution ... 8
1.2.3 Costs ... 9
1.2.4 Other advantages ... 10
1.3 Limitations of MUAVs ... 10
1.3.1 Coverage ... 10
1.3.2 Sensor quality ... 11
1.3.3 Regulations ... 12
1.4 Problem statement ... 13
1.5 Research Objectives ... 15
1.6 Thesis Structure ... 16
Chapter 2 An Automated Technique for Generating Georectified Mosaics from Ultra-High Resolution Unmanned Aerial Vehicle (UAV) Imagery, Based on Structure from Motion (SfM) Point Clouds ... 19
Abstract ... 19
2.1 Introduction ... 20
2.2 Methodology ... 26
2.2.1 UAV Platform and Photo Acquisition ... 26
2.2.2 Block adjustment and Point Cloud Generation ... 27
2.2.3 3D Point Cloud Transformation Using Direct Technique ... 29
2.2.5 Rectification of the Images ... 32
2.2.6 Mosaicking ... 33
2.3 Results and Discussion ... 33
2.3.1 Study Area and Dataset ... 33
2.3.2 Helmert Transformation Parameters ... 36
2.3.3 Mosaics ... 38
2.3.4 Spatial Accuracy ... 39
2.4 Conclusions ... 42
2.5 Thesis Context ... 43
Chapter 3 Direct Georeferencing of Ultra-high Resolution UAV Imagery ... 45
Abstract ... 45
3.1 Introduction ... 46
3.2 Methodology ... 48
3.2.1 Platform ... 48
3.2.2 GPS logging system with camera sync ... 49
3.2.3 Automated image selection ... 51
3.2.4 Image processing ... 53
3.3 Results ... 55
3.3.1 Study Area used for testing ... 55
3.3.2 Processing time ... 56
3.3.3 Spatial Accuracy ... 58
3.3.4 Helmert transformations ... 60
3.4 Discussion ... 61
3.5 Conclusions ... 64
3.6 Thesis Context ... 64
Chapter 4 Spatial Co-Registration of Ultra-High Resolution Visible, Multispectral and Thermal Images Acquired with a Micro-UAV over Antarctic Moss Beds Co-registration ... 65
Abstract ... 65
4.1 Introduction ... 66
4.2 Material and Methods ... 69
4.2.1 Test Sites ... 69
4.2.2 Platform ... 70
4.2.3 Visible Digital Camera ... 71
4.2.4 Thermal Infrared Sensor ... 71
xviii
4.2.6 Mosaicking of Visible Imagery ... 74
4.2.7 Mosaicking of Thermal Infrared Images ... 75
4.2.8 Mosaicking of Multispectral Images ... 77
4.2.9 Calculating MTVI2 from Multispectral Data ... 79
4.2.10 Accuracy Assessment ... 81
4.3 Results ... 81
4.3.1 Image Mosaics ... 81
4.3.2 Co-Registration Accuracy ... 84
4.3.3 Assessing Health of Antarctic Moss from Multisprectral Imagery ... 85
4.3.4 Assessing Temperature of Healthy Moss from Thermal Infrared Image Mosaic ... 87
4.4 Discussion ... 88
4.5 Conclusions ... 90
4.6 Thesis Context ... 91
Chapter 5 Time series analysis of landslide dynamics using an Unmanned Aerial Vehicle (UAV) ... 93
Abstract ... 93
5.1 Introduction ... 94
5.2 Methods ... 97
5.2.1 Platform ... 97
5.2.2 Sensor ... 98
5.2.3 Field Site ... 98
5.2.4 Three dimensional model generation ... 100
5.2.5 Alignment of Digital Surface Models ... 101
5.2.6 Measurement of landslide area and volume change ... 103
5.2.7 Tracking of landslide surface movement ... 103
5.3 Results ... 104
5.3.1 Accuracy of DSMs and orthophotos ... 104
5.3.2 Area and slope analysis ... 105
5.3.3 DSM volumetric changes ... 107
5.3.4 Historical DSM ... 109
5.3.5 Surface movement ... 111
5.3.6 Comparison of landslide movement with rainfall ... 114
5.4 Discussion ... 115
5.6 Thesis Context ... 118
Chapter 6 Conclusions ... 119
6.1 Ortho-mosaic creation ... 119
6.2 Direct georeferencing of UAV imagery ... 120
6.3 Co-registration of multi sensor data ... 121
6.4 Multi-temporal studies ... 123
6.5 Contributions to knowledge ... 125
6.6 Limitations and future research directions ... 125
6.7 Final remarks ... 127
xx
List of Tables and Figures
Table 1.1 - UAV categories as defined by UVS-international (Unmanned
Vehicle Systems) (Eisenbeiss, 2004) ... 2
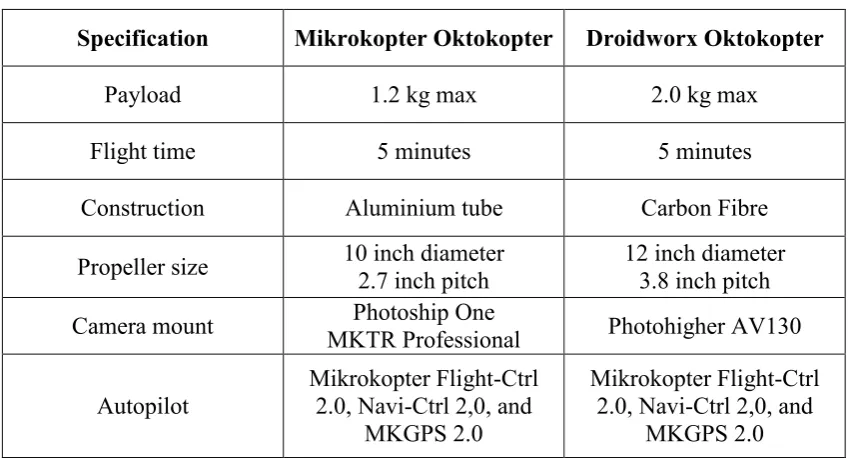
Table 1.2 - Specification of the two Oktokopters used in this study ... 5
Table 2.1 - Comparison of Bundle Block Adjustment variables. ... 24
Table 2.2 - Sample point pairs list ... 30
Table 2.3 - Example list of GCPs for an image ... 32
Table 2.4 - Helmert transformation parameters with formal errors (1 sigma) from least squares solution. ... 37
Table 2.5 - Summary of mosaics and their spatial accuracy ... 40
Table 3.1 - Summary of total processing time for 143 images with each method ... 57
Table 3.2 - Summary of spatial errors for each method ... 59
Table 3.3 - Helmert transformation parameters with formal errors (1 sigma) from least squares solution ... 61
Table 4.1 - Details of acquired image datasets collected at each test site. ... 82
Table 4.2 - Spatial accuracy of orthomosaics for each sensor as measured against check points. ... 84
Table 4.3 - Co-registration accuracy of mini-Multi Camera Array (mini-MCA) and Thermal Infrared (TIR) mosaics as compared to the visible mosaic. ... 84
Table 5.2 - Evaluation of relative elevation accuracy for each pair of DSMs before and after offsets were applied, differences between the DSMs were measured over 4,578,868 pixels (1830 m2) outside
the active landslide area. ... 103
Table 5.3 - Summary of spatial errors for Home Hill landslide DSMs and orthophotos ... 105
Table 5.4 - Changes in area and leading edge slope of Home Hill landslide ... 107
Table 5.5 - Volumetric changes in m3 for the small toe of Home Hill landslide, including estimated errors at one sigma, also reported is the bulking factor, the ratio of accumulated material to lost material. ... 107
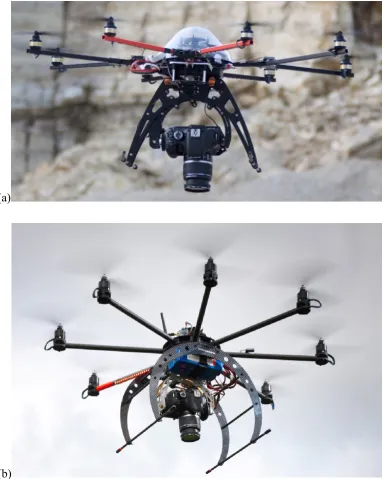
Figure 1.1 - The two Oktokopters used in this study : (a) Mikrokopter Oktokopter airframe, (b) Droidworx AD-Heavy Lift airframe ... 4
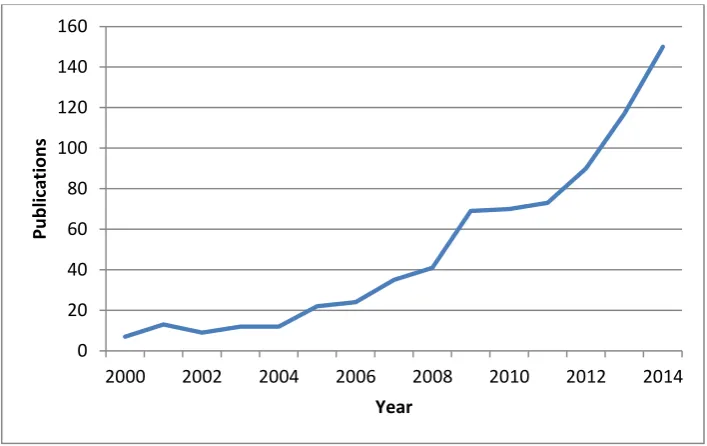
Figure 1.2 - Number of UAV publications per year (excluding robotics and engineering fields of research), source Scopus (2015) ... 7
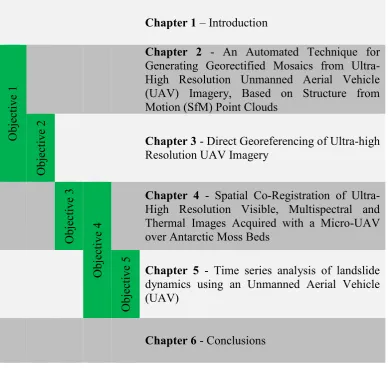
Figure 1.3 - Structure of thesis and achievement of objectives ... 17
Figure 2.1 - Oktokopter fitted with Canon 550D ... 26
Figure 2.2 - Software to plan flight over Antarctic moss bed ... 27
xxii
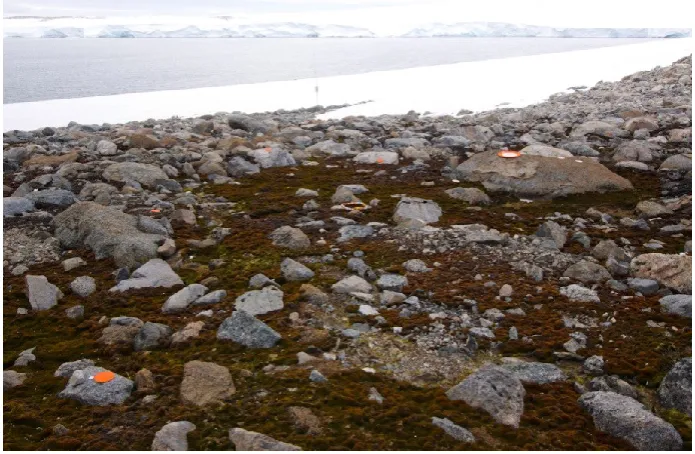
Figure 2.4 - Moss bed area at the Robinson Ridge site with a variety of healthy moss (green), stressed moss (red/brown), and dead moss (black). Small orange discs (~10 cm diameter) and trays (~30 cm diameter) used as GCPs for geometric correction and
validation are visible in the photograph ... 36
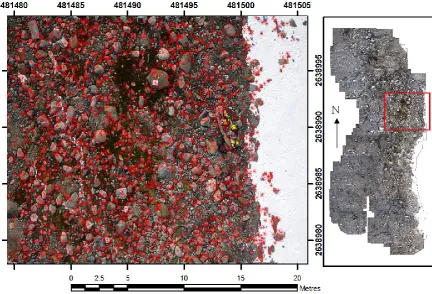
Figure 2.5 - Example of 2888 of control points (shown in red—extracted from the process described in Section 2.2.5) on a single
photograph ... 38
Figure 2.6 - Detailed section of a typical region within the image mosaic of Robinson’s Ridge highlighting accuracy of seam lines (yellow
box highlights seam line). ... 39
Figure 2.7 - Detailed section of an image mosaic of Robinson’s Ridge showing typical spatial errors of direct and GCP techniques in
relation to the actual GCPs (the small orange discs)... 41
Figure 3.1 - Oktokopter in flight with Canon™ 550D fitted. ... 49
Figure 3.2 - Image capture and position determination system. Based on: Camera with synchronisation adapter, GPS with data logging
board, battery, and GPS antenna. ... 50
Figure 3.3 - Mosaic of study site with location map and UAV flight path
overlaid (coordinate system: GDA94 UTM55S). ... 56
Figure 3.4 - Close up of one GCP showing the spatial error for each method
(coordinate system: GDA94 UTM55S). ... 59
Figure 3.5 - Estimated focal length and Z Translation residual errors for
Bundler processing method ... 62
Figure 4.1 - Site location map for the three Antarctic test sites ... 70
Figure 4.2 - Oktokopter fitted with FLIR Photon 320 Thermal Infrared
Figure 4.3 - Comparison of two consecutive TIR frames; (a) blurry image with blur index of 0.32, and
(b) sharp image with blur index of 0.22. ... 76
Figure 4.4 - Robinson Ridge study site: (a) visible mosaic of entire area, (b) RGB image subset, (c) multispectral image subset, (d) thermal infrared image subset, and (e) typical multi-spectral reflectance
function of a healthy Antarctic moss turf. ... 83
Figure 4.5 - Statistical relationship between the ground-measured moss health and the MTVI2 index computed from mosaic of multispectral mini-MCA images obtained at Robinson Ridge
test site. ... 86
Figure 4.6 - Spatially co-registered thematic maps; (a) Overview; (b) Moss health derived from MTVI2 vegetation index and (c) Moss surface temperature at ultra-high spatial resolution (a red circle
highlights thermal shadow cast by a large boulder). ... 87
Figure 4.7 - Statistical relationship between thermal infrared DN values from UAV imagery and ground measured surface temperature
for 19 sample points at the Robinson Ridge test site. ... 88
Figure 5.1 - Oktokopter in flight, fitted with Canon 550D camera ... 98
Figure 5.2 - December 2011 ortho-mosaic of Homehill landslide area highlighting the main features. (a) location map, (b) example of GCP with actual location marked with a black cross giving a typical example of absolute spatial errors (coordinate system:
GDA94 UTM55S). ... 99
Figure 5.3 - Transects through leading edge of the large toe ... 106
Figure 5.4 - 2012A to 2013A DSM change,
(a) area of scarp collapse, (b) areas of toe advance
xxiv
Figure 5.5 - 3D model of the Home Hill landslide as constructed from 1984
aerial photography. The landslide area is circled in red... 110
Figure 5.6 - Cosi-Corr surface movement maps; a) 2011B - 2012A, b) 2012A - 2013A, c) 2013A - 2013B, and d) 2013B - 2014A
(coordinate system: GDA94 UTM55S). ... 112
Figure 5.7 - Comparison of annual rate of rainfall and annual rate of accumulation of material for the little toe area of the Home
Chapter 1 - Introduction
Chapter 1
Introduction
1.1 Unmanned Aerial Vehicles
1.1.1 Background
In the past, Unmanned Aerial Vehicles, (UAVs) have primarily been used in the military domain. With the increased availability of low-cost and lightweight Global Positioning System (GPS) receivers, Inertial Measurement Units (IMUs), digital cameras, and autopilot systems, the civilian use of UAVs has increased dramatically in recent times (Nebiker et al., 2008; Zhou et al., 2009). In particular, the use of UAVs for photogrammetry and remote sensing presents many new and exciting opportunities (Colomina and Molina, 2014). The collection of ultra-high resolution data (~1 cm / pixel) with centimetre level accuracy is one area in which small UAVs offer the greatest potential (Colomina and Molina, 2014; Anderson and Gaston, 2013). UAVs have a high level of operational flexibility, enabling data to be collected with a high temporal resolution. For environmental applications such as monitoring vegetation change, the re-visit time of satellites is often insufficient (Berni et al., 2009), providing a niche opportunity for UAVs. The development of UAV airframe technology has delivered a wider selection of miniature optical sensors (such as multispectral and thermal infrared) that can be carried by UAVs. Also, there are now many low-cost UAVs based on affordable and readily available remote controlled aircraft, thus UAV surveys can potentially be more economical than traditional field-based surveys and/or commercial airborne/satellite based acquisitions. Anderson and Gaston (2013) identified the many and varied areas of research that UAV imagery could be applied to, such as ecology, vegetation dynamics, and ecosystems.
1.1.2 Definition
Chapter 1 - Introduction
2
on the ground, implying that the system is highly autonomous. The term UAS refers to the entire “system”, including ground control station, sensors, and communication systems, rather than just the airborne platform.
In Australia, the legal definition of a UAV or UAS is defined in “Civil Aviation Safety Regulation 101 – Unmanned aircraft and rocket operations” (CASA, 2014). The difference between a UAV and a Radio Controlled (RC) aircraft is not defined by any characteristic of the airframe, but rather by its use. Once an unmanned aircraft is no longer used solely for recreational purposes and is operated for commercial gain, it is then legally considered by the Civil Aviation Safety Authority (CASA) to be a UAV (CASA, 2014). At the time of writing this thesis, CASA do not have a category to cover the use of UAVs for research purposes. Thus, the same rules that govern commercial operations also apply to scientific research UAV flights.
1.1.3 Types, Classifications and Platforms
UAVs vary in size from extremely small micro-UAVs usually designed to fly indoors, up to what would be considered a full-size aircraft, such as the United States’ military weaponised Predator UAV that can seek out and destroy ground and air based targets. Some mid-sized UAVs such as the Aerosonde (www.aerosonde.com) can fly to high levels (e.g. 6 km) of the atmosphere with flight durations of up to 30 hours. These UAVs are known as High Altitude Long Endurance (HALE) UAVs. Based on size and function, UAVs can therefore be classified into various categories (see Table 1.1).
Table 1.1 – UAV categories as defined by UVS-international (Unmanned Vehicle Systems) (Eisenbeiss, 2004)
Category name Mass (kg)
Range (km)
Flight Altitude (m)
Endurance (hours)
Micro <5 <10 250 1
Mini <25 <10 300 <2
Close Range 25-150 10-30 3000 2-4
Medium Range 50-250 30-70 3000 3-6
Chapter 1 - Introduction
Long duration flights are typically carried out at higher altitudes and designed to collect data over a large area. In this study, the focus is on the improved utilisation of UAVs for environmental remote sensing. Applications across this discipline are sometimes characterised by the requirement for sub-decimetre resolution data collected over small sample areas (< 10 ha), for which micro-UAVs are most suitable.
When choosing a UAV platform for high resolution remote sensing there are a number of considerations to be made. It is important that the UAV is relatively easy to fly and capable of flying low and slow (Hardin and Jensen, 2011). At this time there are few UAVs on the market that have been optimised for scientific purposes such as environmental mapping (Hardin and Jensen, 2011). A common problem for civilian UAV users is that many UAV manufacturers continue to primarily market UAVs that have been designed for the military sector (Rango et al., 2009).
When it comes to the choice between fixed wing UAVs and Vertical Take Off and Landing (VTOL) UAVs there are more differences to be considered than just their modes of flight. A fixed wing aircraft travels faster than a VTOL aircraft and thus can cover a larger area in the same amount of time, however, to maintain a sufficient image overlap the fixed wing needs to fly higher such that the footprint and thus the overlap is larger. As a VTOL UAV can capture images at virtually any overlap, it is possible to fly very low and capture extremely high resolution data if required. Fixed wing platforms can also have issues with image overlap if wind causes the UAV to deviate too far from the desired flight path (Hardin and Jensen, 2011). Tail winds can result in excessive ground speed and hence it can become difficult for the image capture system to maintain sufficient forward overlap. In addition, motion blur can become an issue. VTOL aircraft can fly at effectively any groundspeed required regardless of wind direction (within reason) and hence do not suffer as much from overlap and motion blur issues.
Chapter 1 - Introduction
4
(< 10 ha) at an ultra-high resolution (~1 cm / pixel) with a high level of image overlap. Thus a VTOL Micro-UAV (MUAV) was deemed to be most suitable. Two multi-rotor “OktoKopters” (see Figure 1.1) that use autopilot systems developed by Mikrokopter (www.mikrokopter.com) were chosen (see Table 1.2 for specifications). They are relatively straightforward to operate, requiring only a small flat area from which to take off and land, and they come with their own pre-configured and reliable autopilots.
(a)
[image:28.595.130.514.236.716.2](b)
Chapter 1 - Introduction
Table 1.2 – Specification of the two Oktokopters used in this study
Specification Mikrokopter Oktokopter Droidworx Oktokopter
Payload 1.2 kg max 2.0 kg max
Flight time 5 minutes 5 minutes
Construction Aluminium tube Carbon Fibre
Propeller size 10 inch diameter
2.7 inch pitch
12 inch diameter 3.8 inch pitch
Camera mount MKTR Professional Photoship One Photohigher AV130
Autopilot
Mikrokopter Flight-Ctrl 2.0, Navi-Ctrl 2,0, and
MKGPS 2.0
Mikrokopter Flight-Ctrl 2.0, Navi-Ctrl 2,0, and
MKGPS 2.0
1.1.4 Recent trends in UAV utilisation
UAVs have been in use since the dawn of aviation (Wong and Bil, 2006; Colomina and Molina, 2014). Some of the earliest civilian experiments with RC-based UAVs were undertaken in 1979 (Eisenbeiss, 2004). However, UAVs have been predominantly used by the military for such purposes as reconnaissance, target practice, and seek and destroy missions (Everaerts, 2008). This military focus has resulted in the UAV industry being driven primarily by military funding and hence the technology developments have not been focused on civilian applications such as mapping and environmental monitoring (Horcher and Visser, 2004). In addition, much of the developed military UAV technology requires stringent standards and is therefore costly (Wong, 2001). Finally, military operations are usually mission centric where safety and retrieval are not the main focus, such that the platform is often considered expendable (Marchbank, 2009a).
Chapter 1 - Introduction
6
weight, physical size, and cost of sensors and electronic components have all decreased allowing smaller and cheaper UAV airframes to be able to carry a functional payload (Berni et al., 2009; Horcher and Visser, 2004). The miniaturisation of sensors, such as accelerometers and gyroscopes as found in personal devices like smart phones, has provided the technology on which the miniature autopilots are based. Autonomous capabilities of UAV control systems (autopilots) are now mature enough and economically viable for widespread use (Wong and Bil, 2006).
Worldwide the use of civilian UAVs is increasing while the military share of the market is stabilising (Wong and Bil, 2006). In 2010, it was estimated that the civilian UAV industry in Australia was worth AUD$20 million and employed 150 people (Wilson, 2010). However, civilian activities are still limited, partly due to a lack of confidence and investment in unproven technology (Wong, 2001). Aviation regulations governing the use of UAVs are also seen by some as a hindrance to the uptake of civilian UAV use, particularly in places like the USA where obtaining a permit to fly can be difficult (Rango and Laliberte, 2010). As the potential cost savings of UAVs become apparent, the commercial push from industry is likely to pick up the pace of development (Marchbank, 2009a). There is also a growing public acceptance of UAVs and their usefulness, but this acceptance is vulnerable to activities conducted by unlicensed hobbyist operators that could affect market confidence (Marchbank, 2009b).
Chapter 1 - Introduction
Figure 1.2 - Number of UAV publications per year (excluding robotics and engineering fields of research), source Scopus (2015)
1.2 Advantages of MUAVs
In the context of environmental remote sensing applications for which high resolution data is required, a number of clear advantages and limitations of micro UAVs emerge.
1.2.1 Spatial resolution
The spatial resolution obtainable from an MUAV is much higher compared to conventional remote sensing platforms, such as satellites and manned aircraft. Typically, the highest spatial resolution available from commercial satellite sensors is 50 - 60 cm / pixel (Digitalglobe, 2011) and from aerial photography platforms the best available resolution commonly available is 15 - 25 cm / pixel (Nebiker et al., 2008). MUAVs are typically flown at lower altitudes than manned aircraft, thus increasing the spatial resolution of the data collected (Hunt et al., 2010b; Scaioni et al., 2009). MUAVs can collect imagery at sub-decimetre resolution, even as detailed as 1 cm / pixel. Rango et al (2009) proposed the term “hyperspatial” resolution for when the spatial resolution of the imagery collected is finer than the object of interest. Hyperspatial data enables the
0 20 40 60 80 100 120 140 160
2000 2002 2004 2006 2008 2010 2012 2014
Pu
b
lic
ation
s
Chapter 1 - Introduction
8
production of maps similar detail to a ground survey but over a much larger area (Nagai et al., 2009).
Conventional remote sensing platforms often have a fixed spatial resolution; MUAVs have the ability to fly at different levels to obtain datasets at various spatial resolutions enabling multi-scale data collection (Rango et al., 2006). The spatial resolution of MUAV imagery fills the gap between ground-based measurements and aerial photography from manned aircraft (Hakala et al., 2010). For the purposes of vegetation mapping, hyperspatial MUAV imagery allows areas that are predominately background, such as soil, to be identified and thus ignored in further image analysis (Hunt et al., 2008; Sugiura et al., 2005).
Whilst the typical resolution of satellite and aerial photography data is sufficient for studies undertaken at a regional scale it is insufficient to answer many of the questions asked by ecosystem modellers and agencies (Rango et al., 2006; Anderson and Gaston, 2013). Coarser resolution data can result in pixels representing two different surface types. For example, at edges of vegetation, a pixel’s reflectance will be made up the vegetation’s reflectance and the reflectance of the neighbouring surface, such as soil. With high resolution MUAV imagery it is possible to segment the vegetation from background pixels (Hunt et al., 2008), which has the potential to improve the accuracy of any vegetation indices that are calculated (e.g. Normalised Difference Vegetation Index and/or Photochemical Reflective Index) and associated derivatives, such as Leaf Area Index (LAI) (Sugiura et al., 2005). In addition, high resolution MUAV imagery enables the determination of the spatial characteristics of vegetation such as canopy size and the gaps between vegetation that are associated with erosion risk and habitat condition (Rango et al., 2006; Laliberte and Rango, 2009).
1.2.2 Temporal resolution
Chapter 1 - Introduction
re-visits an area of interest with sufficient frequency, there is no guarantee that it will be able to collect cloud free data.
MUAVs have the advantage that they can be deployed on-demand to map an area of interest at critical times. For example, UAV imagery can be collected before and after a specific treatment has been applied to a crop, such as fertilisation or irrigation, to ascertain the effectiveness of the treatment over the immediate short term. UAVs are also suitable for “target of opportunity” events, such as mapping changes in vegetation after a storm (Rango et al., 2006). The on-demand capability of UAV data acquisition gives rise to the term ‘hypertemporal’ resolution of the acquired data.
1.2.3 Costs
Operational costs of MUAVs are low in comparison to other platforms. Manned aerial photography has high operational costs (Berni et al., 2009) and is often unavailable if the aircraft and/or operators have been deployed on another task. Purchase of high resolution satellite imagery can also be prohibitively expensive, particularly for a small agriculturalist that only requires data spanning a relatively small area (< 1000 ha), but has to purchase a satellite image at a fixed spatial extent. Conducting a ground survey is labour intensive, time-consuming and thus expensive to complete (Nagai et al., 2009).
The cost of the UAV platform should be compared to the cost of manned aircraft and satellites. Some UAVs are very complex and are the product of years of extensive research and development, resulting in expensive systems that are no cheaper than the cost of conventional aircraft. In this study, however, the focus is on MUAVs, based on airframes that only cost a few thousand dollars to purchase.
Chapter 1 - Introduction
10
1.2.4 Other advantages
UAVs are also ideally suited to particular tasks which are often described colloquially as dirty, dull and dangerous. That is, UAVs can operate in environments dangerous to humans (Everaerts, 2008). An example would be to assist with relief by producing near-real time imagery of a disaster zone. Access to dangerous areas, such as this, is of particular advantage if the imagery can be georeferenced without the need for human access to place Ground Control Points (GCPs) (Tsai et al., 2010).
The low operating altitude of an MUAV has advantages other than allowing for high resolution data to be collected. An MUAV can operate on a cloudy day, whereas a conventional aircraft would have its view of the ground obscured by low cloud (Thrun et al., 2003). An MUAV can fly at low altitudes at which it is illegal to fly a manned aircraft (Kaneko et al., 2011), allowing it to carry out tasks such as atmospheric measurements (Marchbank, 2009a). The flexibility of an MUAV and the ability to have control over image acquisition can also be of advantage (Oleire-Oltmanns et al., 2012) in order to match the scale of aerial observations to the scale of the spatial objects of interest.
1.3 Limitations of MUAVs
1.3.1 Coverage
Chapter 1 - Introduction
and cover larger areas, they do so at the price of spatial resolution. As a consequence of their higher flying speed, the fixed wing MUAV needs to fly higher to increase image footprint and hence maintain sufficient image overlap.
Collecting a large number of images to cover an area of interest can also dictate that a large number of GCPs will be required to enable accurate georectification of the imagery (Grenzdörffer et al., 2008). GCPs can have a high cost of collection and in some cases may be difficult or impossible to collect (Hruska et al., 2005). Long processing times and the resources required to collect a large number of GCPs can make MUAV surveys inefficient and thus detract from the other benefits of MUAV imagery. Larger areas may well be suited to a different type of UAV, more conventional aerial photography platforms, or even satellite imagery.
1.3.2 Sensor quality
A limiting factor for UAVs, and in particular MUAVs, is the payload capacity of the system. An MUAV is, at best, only capable of carrying a few kilograms, which limits the choice and often the quality of the sensors that can be carried. It is typical for uncalibrated, low-cost, compact cameras to be used for photography, which tend to have low spectral and radiometric resolutions (Laliberte and Rango, 2011) and have lenses for which the distortion is unknown (Grenzdörffer et al., 2008).
The limited payload also limits the available options for a range of other sensors that maybe required for specific applications. Traditional methods of processing aerial photography can make use of high quality GPS/IMU hardware that records the payload (in this case the camera) position and orientation to assist with orthorectification of the imagery. However, accurate GPS/IMUs are typically large and heavy, and thus unsuitable for MUAVs. Miniaturisation of similar hardware often sacrifices accuracy – an inexpensive GPS/IMU small enough to be carried by an MUAV is for example, 1 to 2 orders of magnitude less precise than traditional “full-scale” hardware (Grenzdörffer et al., 2008).
Chapter 1 - Introduction
12
about their biochemical and biophysical properties at these wavelengths (Asner, 1998). However, due to a lack of market demand and therefore a lack of research and development investment by manufacturers, there are very few lightweight sensors capable of capturing true NIR or multispectral imagery. The most common alternative at this time is to modify a consumer grade digital camera to have the NIR blocking filter removed (Dunford et al., 2009), which results in the camera being capable of capturing what is known as Colour Infrared (CIR) imagery. However, the NIR signal, in this case, is mixed with the visible spectrum (particularly the red wavelengths), which makes it difficult to extract true NIR reflectance in a quantitative fashion.
1.3.3 Regulations
Airspace safety organisations around the world have widely varied approaches to governance of UAV operations within their country’s airspace. However, in a large number of countries the use of UAVs is prohibited, or highly regulated. In the USA, the Federal Aviation Administration (FAA) does not permit civilian UAVs access to USA airspace on a continuing basis. Currently, these regulations are being reassessed to allow better access for UAVs (Rango et al., 2006; Colomina and Molina, 2014). The FAA have been directed to develop a “comprehensive plan for integrating UAS into the national airspace by no later than September 2015” (Colomina and Molina, 2014).
Chapter 1 - Introduction
for maintaining and operating the UAVs to be used and the safety systems that are to be put in place.
UAV regulations have been described by some authors as a limiting factor when it comes to the uptake of UAVs by the scientific community for research purposes (Rango et al., 2009; Laliberte et al., 2011b). However, with the increase in civilian use of UAVs around the world, there is increasing pressure on regulatory bodies to modify the regulations to improve access to airspace for UAVs, which in turn will result in more use of UAVs as remote sensing platforms (Everaerts, 2008). In Australia, UAVs can be operated by civilians if the prescribed conditions are met. It may seem onerous at first, but it must be remembered that the purpose of the regulations is to maintain airspace safety standards for all residents of Australia.
1.4 Problem statement
The benefits of UAVs for remote sensing applications include high spatial and temporal resolution, simplicity, and lower costs, making UAVs an ideal tool for collecting scientific data for a wide range of discipline areas. Applications that could benefit from UAVs include natural vegetation monitoring and mapping, precision agriculture, geological mapping, and surveying. Until recently, the uptake of UAVs within these disciplines has been limited. One of the primary reasons for this is a series of unique challenges associated with processing aerial imagery acquired by UAVs (Laliberte and Rango, 2011). Specific challenges associated with collecting scientific data with a UAV are:
1. Mosaicking of the (potentially hundreds of) images collected during a UAV flight in an efficient, accurate, and automated fashion.
2. Directly georeferencing of UAV imagery at a high level of accuracy, such that the need for GCPs is reduced or removed entirely.
3. Accurate co-registration of datasets from multiple flights with multiple sensors.
Chapter 1 - Introduction
14
5. Accurate co-registration and quantification of change in multi-temporal datasets.
A potential solution to overcome the first challenge is to use mainstream photogrammetry software packages. However, these packages are not designed to deal with the characteristics of a typical UAV survey (Eisenbeiss, 2009). UAV imagery differs from conventional aerial photography in a number of important ways;
Flight and camera configurations are often arbitrary (Eisenbeiss, 2009). Flying height is low in relation to the height of objects on the ground,
resulting in significant perspective distortions (Zhang et al., 2011; Wischounig-Strucl and Rinner, 2010)
There is a greater variation in the amount of image overlap and the rotation angles between images (Zhang et al., 2011).
In terms of the direct georeferencing challenge, there has been limited published work, e.g. Chiang et al. (2012), Eugster and Nebiker (2007), Pfeifer et al. (2012). These studies reported relatively low absolute spatial accuracy due to the use of navigation-grade GPS receivers. The other key to this challenge is an accurate synchronisation between the time of camera exposure and the spatial location (GPS derived) of the UAV, both derived from relatively low-cost and lightweight hardware.
For the co-registration challenge, there are several studies that have collected multi-sensor UAV datasets for application in precision agriculture and natural vegetation mapping, e.g. Berni et al. (2009), Bryson et al. (2013), and Bendig et al. (2012). However, there has been limited research into methodologies to co-register multi-sensor datasets and into the accuracy of the co-registration that can be achieved. It is important that such a methodology is as automated as possible and that the imagery can be used to create end-products that can be used to monitor real-world parameters such as vegetation health.
Chapter 1 - Introduction
can create 3D models of a surface from overlapping photos and several studies have demonstrated the power of these algorithms for mapping and monitoring landslides and glaciers (Immerzeel et al., 2014; Lucieer et al., 2013; Niethammer et al., 2010; Niethammer et al., 2009; Niethammer et al., 2011). This thesis will extend this research by demonstrating that change detection can be applied to a multi-temporal dataset that encompasses multiple years of data.
1.5 Research Objectives
The aim of this thesis is to develop image processing routines for direct georeferencing, image mosaicking, and co-registration of ultra-high resolution MUAV imagery from multiple sensors and with a high temporal resolution for environmental remote sensing and change detection applications. This study will make use of an existing multi-rotor VTOL MUAV platform that has a high level of operational flexibility. This platform can be operated in restrictive areas (i.e. does not require a runway) and has a low cost and low operational complexity. The five challenges outlined in Section 1.4 will form the basis for the key research objectives of this thesis:
Objective 1 – To assess existing methods to georectify and mosaic UAV imagery, and subsequently develop an algorithm that overcomes limitations in traditional approaches and enhances existing techniques to enable automated and accurate georectification and mosaicking of UAV imagery.
Objective 2 – To reduce or completely remove the need for GCPs when collecting a UAV image dataset. To develop a hardware and software solution to accurately synchronise camera exposure with GPS position. To assess the accuracy of direct georeferencing in several Structure from Motion (SfM) processing approaches.
Chapter 1 - Introduction
16
Objective 4 – To demonstrate that multispectral and thermal imagery can be related to real-world surface properties such as vegetation health and surface temperature.
Objective 5 – To demonstrate that the combination of high spatial and temporal resolution UAV datasets provide sufficiently accurate data such that change detection can be undertaken across the datasets. To measure the accuracy of the changes quantified, and to minimise any errors in the co-registration of the temporal datasets.
1.6 Thesis Structure
Chapter 1 - Introduction
Chapter 1 – Introduction
Obje
cti
ve
1
Chapter 2 - An Automated Technique for Generating Georectified Mosaics from Ultra-High Resolution Unmanned Aerial Vehicle (UAV) Imagery, Based on Structure from Motion (SfM) Point Clouds
Obje
cti
ve
2
Chapter 3 - Direct Georeferencing of Ultra-high Resolution UAV Imagery
Obje
cti
ve
3
Obje
cti
ve
4
Chapter 4 - Spatial Co-Registration of Ultra-High Resolution Visible, Multispectral and Thermal Images Acquired with a Micro-UAV over Antarctic Moss Beds
Obje
cti
ve
5
Chapter 5 - Time series analysis of landslide dynamics using an Unmanned Aerial Vehicle (UAV)
[image:41.595.124.513.80.448.2]Chapter 6 - Conclusions
Chapter 2 – Georectification and Mosaicking
Chapter 2
An Automated Technique for Generating
Georectified Mosaics from Ultra-High Resolution
Unmanned Aerial Vehicle (UAV) Imagery, Based on
Structure from Motion (SfM) Point Clouds
Chapter 2 describes a novel technique to georectify UAV imagery and has been published in Remote Sensing14th May 2012.
Turner, D., A. Lucieer and C. Watson (2012). "An Automated Technique for Generating Georectified Mosaics from Ultra-High Resolution Unmanned Aerial Vehicle (UAV) Imagery, Based on Structure from Motion (SfM) Point Clouds." Remote Sensing 4(12): 1392-1410.
Abstract
Chapter 2 – Georectification and Mosaicking
20
2.1 Introduction
Historically, Unmanned Aerial Vehicles (UAVs) have primarily been used for military applications. More recently, the use of UAVs in the civilian domain as remote sensing tools presents new and exciting opportunities. Improvements in the availability of accurate and miniature Global Positioning Systems (GPS) and Inertial Measurement Units (IMUs), along with the availability of quality off-the-shelf consumer grade digital cameras and other miniature sensors have resulted in an increased use of civilian UAVs (Nebiker et al., 2008). The highest spatial resolution data available from conventional platforms, such as satellites and manned aircraft, is typically in the range of 20–50 cm/pixel. UAVs are capable of flying much lower and hence can collect imagery at a much higher resolution (Hunt et al., 2010b; Scaioni et al., 2009), often at a sub-decimetre resolution, even as detailed as 1 cm/pixel. The temporal resolution of conventional systems is limited by the availability of aircraft platforms and orbit characteristics of satellites. For the purpose of monitoring highly dynamic vegetation, satellite sensors are often limited due to unfavourable re-visit times (Berni et al., 2009).
Many studies have successfully used UAVs to map and monitor areas of vegetation that are of an agricultural and/or an environmental interest, see for example (Dunford et al., 2009; Johnson et al., 2003; Lelong et al., 2008; Rango et al., 2009). Johnson et al. (2003) used a small fixed wing UAV to collect imagery over a commercial vineyard in California. The imagery had a spatial resolution of 20 cm/pixel and was processed to segment the scenes into vegetation and soil areas and to subsequently calculate percentage vegetation cover. Monitoring of small plots within wheat crops in southwest France Lelong et al., (2008) is another example of UAVs assisting with agricultural processes. Lelong et al. (2008) used a modified digital camera to collect imagery in four bands, red, green, blue and near-infrared to enable the calculation of vegetation indices such as the Normalized Difference Vegetation Index (NDVI).
Chapter 2 – Georectification and Mosaicking
Mexico rangelands, but also used a six band multispectral camera to capture high resolution data in the near infrared. Imagery of such high spatial resolution can provide a lot of information, such as detailed area of vegetation and bare soil coverage, composition by functional or structural group, spatial distribution of plants, inter canopy gaps and in some cases, vegetation type (Rango et al., 2006). In another study, Dunford et al. (2009) used a paraglider type UAV to acquire imagery with a spatial resolution of 6-21 cm/pixel over 179 ha of riparian forest in France. An object-based classification approach was then found to be the most accurate classifier for the detection of dead wood within the forested area (Dunford et al., 2009).
Despite significant evidence highlighting the value of UAVs in the fields of precision agriculture and environmental monitoring, the collection of ultra-high resolution UAV imagery presents a number of challenges. Due to the relatively low flying height (e.g., 50–120 m) of micro-UAVs (<5 kg), the images have a small footprint (e.g., 50 × 40 m when flying at 50 m above ground level with a typical camera and lens configuration). This necessitates the capture of a large number of images to achieve the spatial coverage required for many applications. For example, a single flight covering approximately 2 ha can yield around 150–200 images. To maximise the potential of the UAV technology for environmental and agricultural applications, it is essential that an automated, efficient, and accurate technique be developed to rectify and mosaic the large volume of images generated.
Chapter 2 – Georectification and Mosaicking
22
terrestrial photography, and there are opportunities to use image processing algorithms that are applicable to both types of imagery, as suggested by Barazzetti et al. (2010a).
Recently there have been advances in the realm of Computer Vision (CV), resulting in new algorithms for processing terrestrial photography. Examples are the powerful Scale Invariant Feature Transform (SIFT) (Lowe, 2005) feature detector, and the Structure from Motion (SfM) algorithms that make use of SIFT features to create 3D models from a series of overlapping photos (Snavely, 2010). SIFT is a region detector, rather than an interest point extractor that would typically be used by traditional photogrammetric software (Lingua et al., 2009). As a region detector it has been demonstrated that SIFT is applicable to UAV imagery due to its robustness against changes in rotation, scale, and translation between images (Lingua et al., 2009).
The standard approach in modern photogrammetry is to employ a Bundle Block Adjustment (BBA) to solve for the exterior orientation of each photograph and, if required and provided the geometry of the block of photographs allows it, to solve for additional parameters such as the interior orientation (IO). An introduction to the BBA is provided by e.g., Wolf and Dewitt (2000). Most commonly, metric mapping cameras are used for aerial photography for which the IO parameters are known. UAV imagery is typically collected with consumer grade cameras for which IO parameters are neither known nor stable. Measured values for EO parameters, typically captured at relatively low accuracy in the case of UAV photography, can be included in the BBA, and provide approximate measurements for the bundle adjustment (Barazzetti et al., 2010b).
Chapter 2 – Georectification and Mosaicking
accuracy of the GPS/IMU data and because of the very large scale of the imagery and map products.
Tie/pass points are required to complete a BBA and are typically automatically generated in the case of traditional aerial photography by an interest point extractor algorithm. For UAV imagery, a SIFT algorithm can be used and has the potential to generate a large number of features that can be used as tie/pass points, supplying more redundant observations for a BBA and thus improving the accuracy of the results (Zhang et al., 2011).
Chapter 2 – Georectification and Mosaicking
[image:48.595.139.527.106.612.2]24
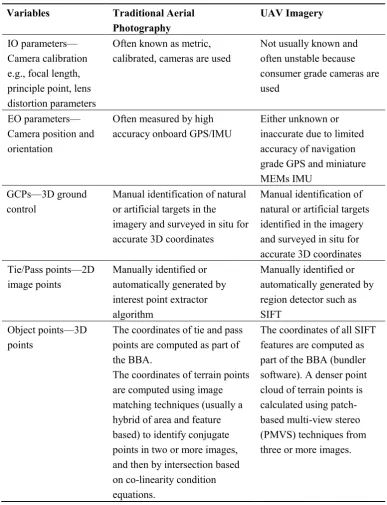
Table 2.1 - Comparison of Bundle Block Adjustment variables.
Variables Traditional Aerial Photography
UAV Imagery
IO parameters— Camera calibration e.g., focal length, principle point, lens distortion parameters
Often known as metric, calibrated, cameras are used
Not usually known and often unstable because consumer grade cameras are used
EO parameters— Camera position and orientation
Often measured by high accuracy onboard GPS/IMU
Either unknown or inaccurate due to limited accuracy of navigation grade GPS and miniature MEMs IMU
GCPs—3D ground control
Manual identification of natural or artificial targets in the imagery and surveyed in situ for accurate 3D coordinates
Manual identification of natural or artificial targets identified in the imagery and surveyed in situ for accurate 3D coordinates Tie/Pass points—2D
image points
Manually identified or automatically generated by interest point extractor algorithm
Manually identified or automatically generated by region detector such as SIFT
Object points—3D points
The coordinates of tie and pass points are computed as part of the BBA.
The coordinates of terrain points are computed using image matching techniques (usually a hybrid of area and feature based) to identify conjugate points in two or more images, and then by intersection based on co-linearity condition equations.
The coordinates of all SIFT features are computed as part of the BBA (bundler software). A denser point cloud of terrain points is calculated using patch-based multi-view stereo (PMVS) techniques from three or more images.
Chapter 2 – Georectification and Mosaicking
photogrammetric software used the EO parameters and GCPs to orthorectify the images and generate a seamless mosaic. Laliberte et al. (2008) identified that their methodology has a number of limitations: it requires pre-existing orthophotos that can quickly become out of date, the 10 m DEMs used for orthorectification were not detailed enough compared to the resolution of the UAV imagery, it suffered from problems finding accurate EO parameters, and achieved variable accuracy of the automatically generated tie points. The overall accuracy of the method was reported to have an RMS error of 0.48 m, (corresponding to ~10 pixels), however, it was acknowledged that the method had only been tested over relatively flat terrain and algorithm performance in areas with higher vertical variability had not been confirmed (Laliberte et al., 2008).
Bryson et al. (2010) presented a georectification and mosaicking technique that used onboard IMU/GPS data to initially estimate camera pose and then image features were matched across the image dataset. A bundle adjustment then used the initial camera pose estimates and the matched features to refine the camera poses; subsequently the images are then rectified and mosaicked using these poses. The method described by Bryson et al. (2010) is similar to the method that we propose in that it uses similar processes (e.g., bundle adjustment, feature matching). However, there are significant differences in the platform used (rotary wing versus fixed wing) and the resolution of the imagery collected. Also, in this study we do not use onboard IMU data; we can automatically identify GCPs, and we integrate the use of multiview stereopsis algorithms into the solution.
These techniques performed well but many are based on traditional photogrammetric software designed to process imagery collected from conventional platforms. Some of these techniques have some key disadvantages: they use existing underlying DTMs and base orthophotos, they rely on complex workflows to estimate camera EO parameters, and, in some cases, require human intervention to identify GCPs.
Chapter 2 – Georectification and Mosaicking
26
real-world coordinates. Alternatively, GCPs can be automatically identified to improve the spatial accuracy of the final product. The automation and simplicity of our technique is ideally suited to UAV operations that generate large image data sets that require rectification and mosaicking prior to subsequent analysis.
2.2 Methodology
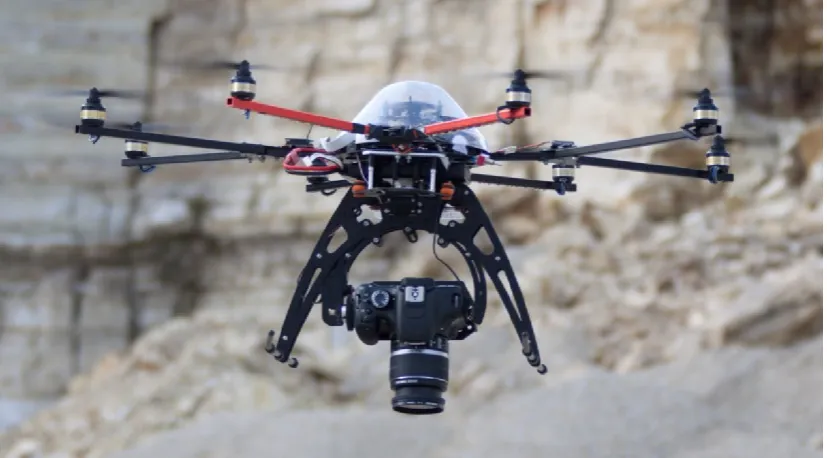
2.2.1 UAV Platform and Photo Acquisition
[image:50.595.130.544.486.715.2]The UAV platform used in this study is a multi-rotor OktoKopter (Figure 2.1). This platform is purpose designed for aerial photography (Mikrokopter, 2011) and has a stabilised camera mount, to which we have fitted a small format digital camera (Canon 550D 18 Megapixel, 5,184 × 3,456 pixels, DSLR, with Canon EF-S 18-55 mm F/3.5–5.6 IS lens).Image resolution (ground pixel size) at a typical flying height above terrain of 50 m is approximately 1 cm/pixel. The OktoKopter has a payload limit of approximately one kilogram and with a full payload has a flight duration of around 5–6 min. A single flight conducted at 50 m above ground level (AGL) can cover an area of around 4–5 ha, producing approximately 200–300 images under a standard operating configuration. Larger areas are covered with multiple flights, or by increasing the flying height and lowering the spatial resolution.
Chapter 2 – Georectification and Mosaicking
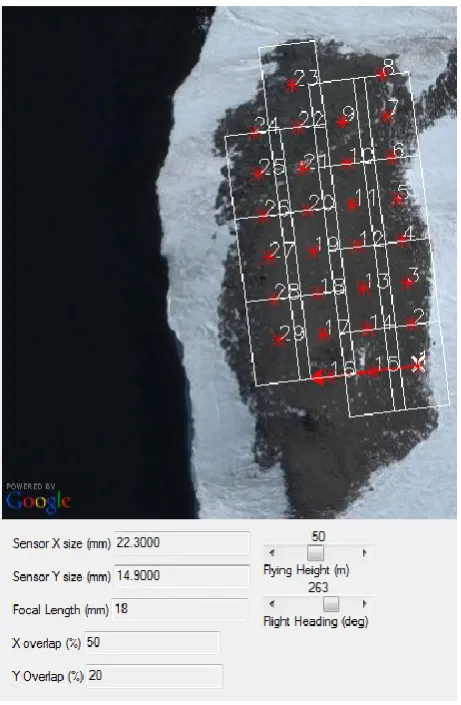
Figure 2.2 - Software to plan flight over Antarctic moss bed
The Oktokopter has an onboard navigation system based on a navigation grade GPS receiver (U-blox LEA6S) and a small Microelectromechanical System (MEMS)-based IMU (Mikrokopter Flight Controller ME V2.0) enabling it to fly autonomously through a pre-defined set of waypoints. As part of this study, we developed flight planning software that calculates the spacing and layout of waypoints to optimise the image acquisition over a region of interest at a nominated image scale (see Figure 2.2). Imagery is acquired at the maximum rate allowed by the camera (approximately 1 Hz), providing ample image overlap in addition to redundancy to account for occasional outlier acquisitions (excessive tilt or poor exposure).
2.2.2 Block adjustment and Point Cloud Generation