Rochester Institute of Technology
RIT Scholar Works
Theses
Thesis/Dissertation Collections
8-2005
Product development knowledge-processing
system
Jiefei Qiu
Follow this and additional works at:
http://scholarworks.rit.edu/theses
This Thesis is brought to you for free and open access by the Thesis/Dissertation Collections at RIT Scholar Works. It has been accepted for inclusion in Theses by an authorized administrator of RIT Scholar Works. For more information, please [email protected].
Recommended Citation
Rochester Institute of
Technology
PRODUCT DEVELOPMENT KNOWLEDGE-PROCESSING SYSTEM
A Thesis
Submitted inpartialfulfillmentofthe
requirementsforthedegreeof
MasterofScience in Industrial
Engineering
inthe
DepartmentofIndustrial & Systems
Engineering
Kate Gleason College of
Engineering
by
Jiefei Qiu
B.E.,Industrial Design,Hefei
University
ofTechnology,2003DEPARTMENT OF INDUSTRIAL AND SYSTEMS ENGINEERING
KATE GLEASON COLLEGE OF ENGINEERING
ROCHESTER INSTITUTE OF TECHNOLOGY
ROCHESTER, NEW YORK
CERTIFICA TE OF APPROVAL
M.S.
DEGREE THESIS
The M.S. Degree Thesis of liefei Qiu
has been examined and approved by the
thesis committee as satisfactory for the
thesis requirement for the
Master of Science degree
Approved by:
Paul H. Stiebitz
Professor Paul Stiebitz, Thesis Advisor
Edward Hensel
Thesis/Dissertation Author Permission Statement
Title of thesis or dissertation: _ _ _ _ _ _ _ _ _ -:-_---=,---_____
-fNldud
!Jeve~ &4~ P/'4)t:'~7 -¥~
Nrumeofauthor:
~~JjL/~·e~f~~~/-·--~Ql~/u'u~---Degree: /Vl,rs ~
(21-
J'u
'e-y:.eProgram: J~f~ ~~
College: u~
C?j
~eec7I understand that I must submit a print copy of my thesis or dissertation to the RIT Archives, per current RIT guidelines for the completion of my degree. I hereby grant to the Rochester Institute of Technology and its agents the non-exclusive license to archive and make accessible my thesis or dissertation in whole or in part in all forms of media in perpetuity. I retain all other ownership rights to the copyright of the thesis or dissertation. I also retain the right to use in future works (such as articles or books) all or part of this thesis or dissertation.
Print Reproduction Permission Granted:
I, , hereby grant permission to the Rochester Institute Technology to reproduce my print thesis or dissertation in whole or in part. Any reproduction will not be for commercial use or profit.
Signature of Author: _ _ _ _ _ _ _ _ _ _ _ _ _ _ _ _ _ Date: ______ __
Print Reproduction Permission Denied:
L
,
T/e
f
e
i'a "
u , hereby deny permission to the RIT Library of theRochester Institute of Technology to reproduce my print thesis or dissertation in whole or in part.
Jiefei Qiu
ySignature of Author: _ _ _ _ _ _ _ _ _ _ _ _ _ _ _ _ Date:
"J/
1)6/
[2 0 t>.JInclusion in the RIT Digital Media I1brary Electronic Thesis
&
Dissertation (ETD) Archive
I, , additionally grant to the Rochester Institute of Technology Digital Media Library (RIT DML) the non-exclusive license to archive and provide electronic access to my thesis or dissertation in whole or in part in all forms of media in perpetuity.
I understand that my work, in addition to its bibliographic record and abstract, will be available to the world-wide community of scholars and researchers through the RIT DML. I retain all other ownership rights to the copyright of the thesis or dissertation. I also retain the right to use in future works (such as articles or books) all or part of this thesis or dissertation. I rum aware that the Rochester Institute of Technology does not require registration of copyright for EIDs.
I hereby certify that, if appropriate, I have obtained and attached written permission statements from the owners of each third party copyrighted matter to be included in my thesis or dissertation. I certify that the version I submitted is the same as that approved by my committee.
ABSTRACT
Thisthesis develops amethodology that integrates
Quality
Function Deployment(QFD),
Theory
of Inventive ProblemSolving (TRIZ)
and Design Structure Matrix(DSM)toaddresstheproblem ofanalyzing, interpreting,andtransformingtheknowledge
dataflow
during
theproductdevelopmentprocess.A product development process is the sequence of steps an enterprise takes to
conceive, design, andcommercialize aproduct. The general process includes: Planning,
Concept Development, System-Level Design, Detail Design,
Testing
and Refinement,and Production Ramp-Up. One way to think about the development process is as a
knowledge-processing
system.Priorto thisstudy,therearefewarticles
integrating
TRIZ andQFD. QFDis atoolfor "identifying the needs ofthe customer and translating the language ofthe customer
into the language of the engineer". The QFD process also identifies engineering
contradictions within the existing system. TRIZ can provide solutions for these
contradictions. Itoffers one ofthe most efficientmeansto generate creative solutionsfor
thedesired improvementsprioritizedin QFD. Oncea creative solutionisdeveloped using
TRIZ,thecorrespondingpart characteristics canbefurtherdecomposedusing QFD.
If we think ofknowledge-processing as a work process, then both rework and
iterative design requires additional project resources and time. Iteration is the repetition
of activities due to the input of new information. DSM is an effective tool to plan and
manage product development processes through information flow analysis
by helping
ACKNOWLEDGEMENTS
First, I thank my advisor Paul Stiebitz, for his continuous support in my MS
program. Paulhas beenafriend and mentor. He was alwaysthereto meet and talkabout
myideas, tosolveanyunsolvableproblems, toproofreadand markup mypapers. He had
confidence in me when I doubted myself and brought out the good ideas in me. More
importantly, he taught me how to work hard and play hard, and how to reduce stress!
Withouthisencouragement and constantguidance, Icould nothave finishedthis thesis. I
also thank my co-advisor, Dr. Edward Hensel, who guided my thesis and gave me
insightful comments. He always asked me good questions to
help
me thinkthrough myproblems.
I am also grateful to the
following
people at RIT: Marilyn, Dr. Mozrall, Dr.Esterman andDr. Thorn,for
helping
me at anytime with various aspects ofthis thesis. Ialso appreciatethecontributionfromthe Industrial and Systems
Engineering
Departmentfor providingmethenecessary computing facilitiestowork onthisthesis.
All others, who have provided direct or indirect assistance to me, are also
gratefully acknowledged. The preparation ofthis thesis would not have been possible
withoutthesupport and valuable contributions oftheseindividualsand organizations.
Last, butnot least, I thankmy family: myparents,
Guoqiang
Qiu, and ShuiChen,for giving me life, for educating me for unconditional support and encouragement to
pursue my interests, even when the interests went beyond boundaries oflanguage and
geography; my elder brother Jiewen Qiu, for sharing his experience of how to do
TABLE OF
CONTENTS
LIST OFFIGURES vi
LIST OFTABLES ix
NOMENCLATURE x
1 PROBLEM STATEMENT 1
2 INTRODUCTION 4
2.1 IntroductiontoQFD 4
2.2 IntroductiontoTRIZ 9
2.3 IntroductiontoDSM 11
3 LITERATURE REVIEW 14
3.1 AnIntroductionto QFD,TRIZandDSM 14
3.2 TheQFD,TRIZandTaguchi Connection: Customer-Driven Robust Innovation
(Terninko) 17
3.3 A Frameworkfor Design Process Specifications Management(Yassine,and
Falkenburg) 18
3.4 Product Development Process Captureand
Display Using
Web-BasedTechnologies(Sabbaghian, EppingerandMurman) 19
3.5
Apply
theDesign Structure Matrixto System DecompositionandIntegrationProblems: A ReviewandNewDirections(Browning) 20
3.6 DesignofObjective Functions for OptimizationofMulti-DomainSystems
(Andersson,JochenandPetter) 21
3.7 The Design Structure System: A Method for
Managing
theDesignofComplexSystems(Steward "The Design Structure
System")
233.8
Planning
andManaging
theDesignofSystems (Steward"Planning
and4 PRODUCTDEVELOPMENT KNOWLEDGE-PROCESSINGSYSTEM 27
4.1 ArchitectureofHPDeskJet 1200C 27
4.2 The NetworkofICOMs overview 29
4.3 NetworkofICOMs forQFD 31
4.4 NetworkofICOMsbetweenQFDandTRIZ 39
4.5 NetworkofICOMs betweenQFDandDSM 53
5 RECOMMENDATIONSANDCONCLUSION 69
5.1 Conclusions fromthisresearch 69
5.2 Futureresearch 71
6BIBLIOGRAPHY 72
APPENDIX 1 House of
Quality
Model description 77APPENDIX2 Customer Requirements Definitions 78
APPENDIX 3
Engineering
Characteristics Definitions 79APPENDEX4 RelationshipbetweenCRs andECs 85
APPENDIX5 House 1 for QFD 86
APPENDIX6 TRIZ Report using CREAX 87
LIST OF FIGURES
Figure 1 1
Figure 2 Dataflow betweenTRIZand QFD 1
Figure3 Data flowbetweenDSMandQFD 2
Figure4 Data flow inTRIZ, QFD,DSM (Time sequence) 2
Figure 5 ICOM 3
Figure 6 ICOMexample 3
Figure 7 Houseof
Quality
4Figure 8 Graph fora system 12
Figure 9 Matrixforthesystem 12
Figure 10 DSMtaxonomy 15
Figure 11 Sample Task-based DesignStructureMatrix 15
Figure 12 Sample DSMwith explicitinformation flow 16
Figure 13 Multi-tiered DSM configuration sample 16
Figure 14 Design Structure Matrixforthe
landing
geardesignprocess 22Figure 15
Relationship
matrixforthelanding
gear system 23Figure 16 25
Figure 17 26
Figure 18 26
Figure 19 DeskJet 1200Carchitecture (Dangelo69) 27
Figure20 Overviewofthemedia path oftheHP DeskJet 1200Cprinter(Broder72)
28
Figure 21 ICOM 29
Figure 22 ICOMexample 29
Figure23 HOQ Model (Adapted from Fig. 2ofLai-Kow's paper) 31
Figure 24 A graphic network ofICOMs for QFD 31
Figure 25
Using
ICOMstorepresentthesetransforms 31Figure26 Fl transformfromthenetwork 32
Figure27 Thepair-wise comparison method 32
Figure 30 F4transformfromthenetwork 37
Figure 31 Houseof
Quality
(Adapted fromQFDCapture)
38Figure 32 TheNetworkofICOMs betweenQFDandTRIZ 39
Figure 33 TheNetworkofICOMs betweenQFD andTRIZ 39
Figure 34
Using
ICOMstorepresentthese transforms 39Figure35 F5transformfromthenetwork 40
Figure 36Content forF5transform 41
Figure 37 F6transformfromthenetwork 42
Figure 38 TRIZprocess 42
Figure 39Contentfor F6transform 46
Figure 40 F7transformfromthenetwork 47
Figure 41 Content for F7transform 48
Figure 42 F8 transformfromthenetwork 48
Figure 43 F8transformfromthenetwork 49
Figure 44 F9transformfromthenetwork 50
Figure 45 Contentfor F9transform 50
Figure46 F10transformfromthenetwork 51
Figure 47 F8toF10transform 51
Figure48 Content for F10transform 51
Figure 49 HOQ 1 53
Figure 50HOQ2 52
Figure5 1 Linked housesfromCustomer RequirementstoProduction Requirements
52
Figure 52The NetworkofICOMs between QFDandDSM 53
Figure 53 53
Figure 54 Fl 1 transformfromthenetwork 54
Figure55 Contentforthe originalDSM 55
Figure56 F12transformfromthenetwork 56
Figure 57 Content for Fl 2transform 57
Figure 58 F13transform fromthenetwork 58
Figure 60 Relative Importance from
HOQ
1 61Figure 61 F15transform fromthenetwork 62
Figure 62 PartitionedDSMwithTechnicalRisk & Relative Importance 63
Figure 63
Tearing
heuristics 63Figure 64 DSMafterprocessA,B 65
Figure 65 DSMafterprocess C 66
Figure66 DSMafter processD 67
Figure 67 DSMafterprocessE 68
Figure 68Houseof
Quality
Model 77Figure 69 Curl 78
Figure 70
Drop
placementerrors causedby
swath advance 79Figure 71
Banding
causedby
misdirection 80Figure 72 Waittime
banding
80Figure 73
Mottling
81Figure 74 Bleed 82
Figure 75
Spray
83Figure 76 Shim spray 83
Figure 77Jagged lines 83
Figure 78
Relationship
between CRandEC 85Figure 79 House 1 for QFD (Adapted from QFDCapture) 86
Figure 80 Linkedhousesfrom Customer Requirementsto Production Requirements
LIST
OF TABLES
Table 1 SevenCustomer Requirements forour product 33
Table 2 ImportancePriorities forCRs 33
Table 3 Eighteen
Engineering
Characteristics 35Table 4Content forF3transform 36
Table 5 Final Importance Ratings 38
Table 6 14solutions fromTRIZ 45
Table7 Content for EC 55
Table 8 Technical Risks forthe
Engineering
Characteristics 59Table 9
Tearing
heuristics 64NOMENCLATURE
ICOM:
1. "The term ICOM refers collectively to the group of information flows
between activities which have one offour roles in the activity"
(Department
of Defense par. 5). I, C, O and M represent Input, Control, Output and
Mechanismrespectively.
2. I represents a matrix as the input of data "used to produce the output of an
activity"
(Department ofDefensepar. 5). Orepresents a matrix as theoutput
of data "produced
by
or resultingfromthe activity"(Department ofDefense
par. 5). Both I andO are usually expressed
by
two orthree capital characterssuch as CR, ECand so on.
3. Therectangle represents the function process,
including
the Mechanism thatis under constraint of Control. Control is defined as "Information that
constrains or controls an
activity"
(Department of Defense par. 5).
Mechanism is defined as
"Usually
people, machines, or systemsthatperformtheactivity"
(DepartmentofDefensepar. 5).
4. Thesubscript ontherightofI/Orepresentsthe sequence oftheinputs/outputs
throughthatfunction.
5. This thesis focuses on the data exchange
during
the product developmentprocess, sothecontentforM andOwill notbe discussed here.
Ordered Set:
A=
(ai,a2,a3,...,aj) isan"orderedset"
withj elements,andalsoa
lxj
matrixincaseswhenaj e
1R (
Jechpar.2). The definition for"orderedset"is introducedon
http://plato.stanford.edU/entries/set-theory/primer.html#l.
B=
(bi,b2,b3,...,
bj)
is justanordered setwithj elementsincases whenbj
gR
C2, '12
-22
'\N
'IN
CM\ CM2 'MN
isa matrix suchthat cmn e
CRm,m=l,2, ..
., M (M=7inthiscase): Customer Requirements forour product.
IPm,m=l,l,...,M (M=7 inthiscase): Importance PrioritiesforCRs.
Fl represents the assignment of relative importance IPm to the customer requirement
CRm,usingthepair-wise comparisonmethod.
(ECj
|
CRj depends onECj), i =1,2,...,M andj
= 1,2,.
..,N: Anordered set of
Engineering
\f
Characteristics upon which a given Customer Requirement depends, EC =
(_J
(ECj
|
/=iCRjdepends onECj).
F2 isthemappingofCRtoEC.
MT: A MxNmatrix, showingtheextenttowhich eachCRmis dependentupon eachECn..
F3: Define MTmn=
0 if CRmis independentofECn;
MTmn=
1 ifCRmdepends weaklyonECn;
MTmn=
MTmn=
9ifCRmdependsstronglyonECn.
\/m,n m=l,2,...,Mandn=l,2,...,N.
FR: The FinalImportanceratingsforeachelementofEC.
F4: Thetransform togettheFRvalues.
FR= IPT x MT.
CT =
(CTU
CT,,3CTM
... CT,jN CT2,3 CT2,4 ... CT2,N CTN.,,N), showing"1" or
"0"
for the contradiction relationship between every two elements of the
Engineering
Characteristics.
Where
CT^y
=0 ifthereisno contradictionbetweenECXandECy;
CTx,y
= 1 ifthereisacontradictionbetweenECX andECy.
Vx,y
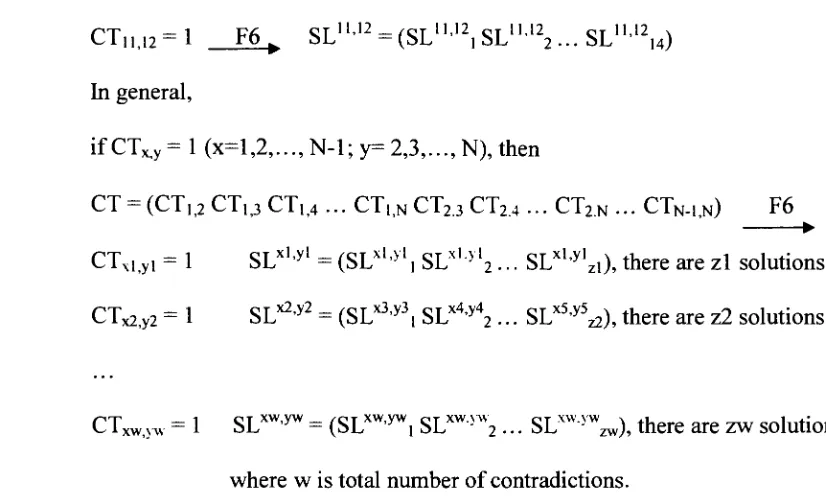
x=l,2,...,N-l andy=2,...,N.F5: It represents the contradiction selection from the
Engineering
Characteristics, usingtheknowledge fromengineering, physics,designandotherfields.
SL"'5' =
(SLxyiSL"0^... SL*^): Anordered set ofsolutions,only if
CT^
= 1.
F6 represents the TRIZ process, using the contradiction to provide creative solutions
(SL).
SS: Anordered set ofsolutions, selectedfrom yl
USL^U... SLxwyw.
F7 represents the selected solutions
(SS)
from SLX yU SL y U ... SLxwyw, based on
ouranalysis andknowledge.
NPC =
(NPCiNPC2... NPCpi+P2+...+pw)
=
(NPCi NPC2 ... NPCE), E is the total number
of part characteristics: Anorderedset showscorrespondingpartcharacteristicsfor SS.
F8: To
identify
thepart characteristics(NPC)relatedwithSS.F9 transforms the engineering characteristics in House 1 into the new engineering
characteristicsinHouse2.
F10: Oncethiscreative solution is developed usingTRIZ, thecorrespondingengineering
characteristicscanbe further decomposed intoHouse 2.
DM: ItshowstheDSM relationship matrix with 18 variables.
Fl 1 representstheDSMprocess.
DP: The DSM relationshipmatrix after
being
partitioned.F12represents thepartitioningprocess.
TR: The Technical Riskvaluesforcorresponding engineeringcharacteristics.
F13: To accesstheTechnical Riskvaluesforeach oftheengineeringcharacteristics.
RI: The Relative Importance valuesfor corresponding engineeringcharacteristics.
F14: ToaccesstheRelative Importancevalues foreach oftheengineeringcharacteristics.
TS: Themoreeffectivetimesequencefortheproductdevelopmentplan.
1
PROBLEM
STATEMENT
As Fig. 1 shows, this thesis develops a methodology, which integrates
Quality
Function Deployment (QFD),
Theory
ofInventive ProblemSolving (TRIZ)
andDesignStructure Matrix
(DSM)
to transform the knowledge data flowduring
the productdevelopmentprocess.
A
**"
TRIZ
QFD
DSM
Figure 1
The process to apply this methodology is described as follow. First ofall, QFD
identifies the language of the customers and translates them into the language of the
engineers, which is referred to as "engineering
characteristics"
(Terninko par. 1). The
QFDprocess also identifiesengineeringcontradictions withintheexistingproduct. TRIZ
thenprovides creative solutions using these contradictions forthe desired improvements
prioritizedin QFD. Once a creative solutionis developed using TRIZ,the corresponding
part characteristics ofthis solution canbe further decomposedinto House 2 using QFD.
Thisistheprocesstointegrate QFDandTRIZ,whichis shownin Fig. 2 below.
Designsolutions
Eng.Char.
TRIZ
Contradictions
QFD
Secondly, these engineering characteristics become variables in DSM.
By
reordering the variables, DSM provides a more effective product development plan for
the complexprocess system throughinformationflowanalysis, withtheinput parameters
such asRelative Importanceand TechnicalRisk.Thisprocessis shownin Fig. 3 below.
Time SequenceforEC,s
DSM QFD
EngineeringCharacteristics RelativeImportance
Figure3 Dataflow betweenDSMandQFD
Fig. 4 showsthedataflowinQFD,TRIZandDSM usingtimesequence.
Time SequenceforPCs
Customer Needs
Relative Importance! i-\Q*7
QFD
Eng Char
Contradiction^*
TRIZ
Designsolutions
Eng. Char.
Figure4 Data flow inTRIZ, QFD,DSM(Timesequence)
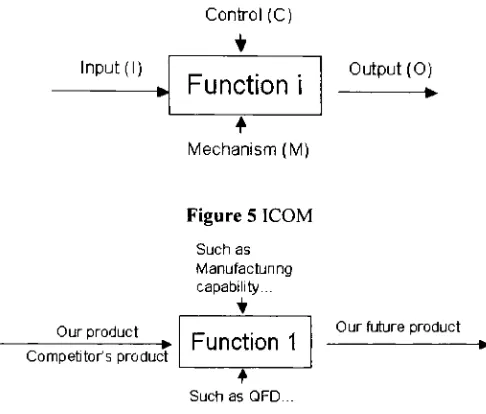
WeuseatoolcalledICOMas shownin
Fig
5 and6during
thisprocess. I, C,OandM represent Input, Control, Output and Mechanism respectively. Input is transformed
intoOutput
by
usingtheMechanismthatisunder constraint ofControl.Thisfunction canbe expressed as Fi. i is the sequence ofthe function. Function is defined as: "A rule of
correspondence between two sets such that there is a unique element in the second set
assignedtoeach elementinthefirstset"
(Dictionary
par.2). Forexample, inFig. 5 and6,represents the control such as our manufacturing capability and so on; M represents the
mechanism such as QFD and so on. Based on our manufacturing capability, Fl means
that we can use QFD as a tool to analyze our product and our competitor's product, to
establishthedetails forourfutureproduct.
Control(C)
Input(I)
Function i
Mechanism(M)
Output(0)
[image:19.539.139.382.156.363.2]?
Figure 5 ICOM
Suchas Manufacturing capability...
Ourproduct
Competitor'sproduct
Function 1
Our futureproduct
SuchasQFD...
Figure 6 ICOMexample
Priorto this study, there are fewarticles
integrating
TRIZ, QFD, and DSM. It isan innovative trial, but is it reasonable? In particular, the
following
research questionswill beanswer:
1. Whatnewknowledgeis gained
by
combingQFD, TRIZandDSMduring
thedesignphase of a product?
2. Whatprocessshouldbe followedtoobtainthenewknowledge?
3. What datastructure representstheknowledge?
In an effort to answer these questions, this paper uses the product development
process from a knowledge processing perspective. The knowledge processing system is
2
INTRODUCTION
2.1 Introduction to QFD
Quality
Function Deployment(QFD)
is astructured methodto translatethe voice of customers into the voice ofthe engineers to meet the needs (Terninko par. 1). TheHouse of
Quality
is a basic design tool of QFD. It is composed of several tables,including
the Customer Requirement (CR),Engineering
Characteristics (EC), theRelationship
Matrix between CR&EC, the TradeoffTable, Benchmarking, and Overall Importance Table. Alloftheseparts are shownbelowin Fig. 7.Figure7 HouseofQuality
Theprocess for using Houseof
Quality
is explainedasbelow:1. ListtheCustomer Requirements(CR)onthe leftside ofthe matrix.The
Customer Requirements are usually acquired through customer
[image:20.539.79.443.307.575.2]First of all, the customers for a product are identified. In the consumer
market, theremightbe different kindsof customers. Forexample,iftheproductis
a cellphone, the customers include both the young students and old people. The
driven desire to purchase the cellphone for these two kinds of people is usually
different. "There are evenmultiple customervoices within a single organization:
thevoice oftheprocuring organization,thevoice ofthe user, andthevoice ofthe
supportingormaintenanceorganization"
(Crowpar. 1).
Secondly, the voice of the customers, which is also called Customer
Requirements (CR), should be collected. These Customer Requirements are
usually acquired from observations, surveys, feedbacks, interviews and group
meetings. "Interviews are useful because they allow youto effectively probe for
detail. Focus groups are productive because they allow you to
develop
a lot ofcreative ideas
by having
the participants buildupon one another's comments.In-context customer visits allow team members to actually observe how customers
useexistingproductsor perform existingfunctionsand can leadtoa
dramatically
improvedunderstandingof whatthecustomerreally
needs"
(QFD Capturepar. 2).
ThislistofCRisthenenteredintotheleftside ofthematrix as shown above.
2. EvaluatetheImportance Priorities fortheCustomerRequirements.
Inthis process, compare all ofthe Customer Requirements to each otherto
determine the customer Importance
Priority
using a 1 to 5 rating for eachCustomer Requirement. "Use ranking techniques and paired comparisons to
develop
priorities"3.
Develop
thebenchmarking
evaluation between our product andcompetitive products.
The development team compares ourproduct with competitive products, in
orderto betterunderstandwhatthefactorsare
leading
to thepurchase. Therefore,the development teamknows whatthe customer likes anddislikes. Based onthis
Customer Competitive Analysis, the development team should determine the
Customer Competitive
Priority
Ratings, Customer Performance Goals for theCustomerRequirements,andCustomer Improvement Ratio.
4. Establish the
Engineering
Matrix (EM), which is composed ofEngineering
Characteristics (EC), to respond to customerrequirements.
Establish the technical requirements, which are called
Engineering
Characteristics here, to respondto each Customer Requirement. All
Engineering
Characteristics are then formulated the
Engineering
Matrix as the Fig. 7. TheEngineering
Characteristics should be measurable and practical. That is to say,"The measurement should be determined without extensive data collection or
testing"
(Crowpar. 3).
5. Decide the improvement direction for each of the
Engineering
Characteristics.
The development team should decide whether each
Engineering
6.
Develop
theRelationship
Matrix between CR andEC.The relationship between CR and EC represents how these two lists are
related with each other. This relationship might be defined
by
asking, "To whatdegree does this
Engineering
Characteristic predict the customer's satisfactionwiththis requirement?"
(Crowpar. 4). The developmentteam can determine the
scale usedto definetherelationship. Forexample, itcan be used with values of1
through 10. "Standard QFD practice usually supports the values 1, 3, and 9"
(Crowpar. 4). Askthis question for each CR and EC combination, and then the
answers canbe usedto
develop
therelationshipmatrix,which isshown above.7.
Develop
the Target Values and Final Importance Ratings for theEngineeringCharacteristics.
Setting
Target Values shouldbe basedonthedata followed:"The team has benchmarked the existing products to gain a good
understanding of whatlevel of actual performanceis required inordertoproduce
thedesired levelof perceived performance.
By
evaluatingthe Tradeoffs between everytwoEngineering
Characteristicsin order to determine what compromises may be required and how those
compromises wouldbe
made"
(QFD Capturepar.26).
After considering so many data, the team sets the Target Values for each
are we really going to do with respectto this product or
service?" (QFD Capture
par. 26).
BasedonthisTechnical CompetitiveAnalysis,thedevelopmentteamshould
determine the Initial Technical Ratings, the Technical Competitive
Priority
Ratings, Technical Target Values for the
Engineering
Characteristics, TechnicalImprovement Ratio andFinalImportance ratings.
8. Use symbols to determine potential positive and negative interactions
between everytwo
Engineering
CharacteristicsThis can be determined
by
asking "Ifwe improve our performance foroneelement of the
Engineering
Characteristics, what is the impact on every otherEC?"
(QFD Capture par. 27). The development team will determine whether
improvement ofthis
Engineering
Characteristics helps or weaken the effect ofeveryotherEngineeringCharacteristics and markthemusingpositive or negative
symbols.
9. Analyze the matrix and finalize the product development strategy and
product plans. Determinerequired actions and areas offocus.
"Finalize target values. Are target values properly set to reflect appropriate
tradeoffs? Do target values need tobe adjusted consideringthe
difficulty
rating?Are they realistic with respect to the price points, available technology, and the
difficulty
rating? Are they reasonable with respect to the importance ratings?2.2 Introduction to TRIZ
TRIZ is the acronym for
"Theory
of Inventive Problem Solving" in Russian.ARIZisthe acronymfor "Algorithm forInventive ProblemSolving"
in Russian. It is the
mainTRIZmethodforsolvingcontradiction.
ARIZhas been developedfor manyyears, sothereare several versionsfor it. The
main parts ofdifferentversions are the same, though everyversionhas its ownfeatures.
For example, the ARIZ presented in thebook And
Suddenly
the Inventor Appeared hassevensteps,comparedtoanotherAmericanizedversion ofARIZ,whichhasninesteps.
The Americanized version of ARIZ is used as example to introduce ARIZ as
below.
1.0 "AnalyzetheSystem" (Marconipar.
15)
The purpose ofthis step is to build a model forthe problem. The 9-screen
methodisoneofthemethods usedto definetheproblem.
2.0 "Analyzethe Resources"(Marconipar.
15)
The resources include space, time, substances and fields.
By
analyzing theresources ofthe system,subsystem, supersystemandthe environment, itprovides
usinformationtodealwiththeupcomingContradictions.
3.0 "Define the Ideal Final Result and Formulate the Contradiction"
Improving
onepartofa systemmayimpairother partsofthesystem. This iscalled a Contradiction. The Contradictions are stated here, which we need to
remove later. The Ideal Final Resultgivesusthe targetoftheproblem.
Ideal Final Result
(IFR)
cannot be reached sometimes, but it allows us tobuildapathto thesolution.
4.0 "Separatethe Contradiction"
(Marconipar.
16)
By
using resources which have been analyzed in step 2, we separate theContradictioninordertoeliminateit inthelatersteps.
5.0
"Apply
the Knowledge Base: Effects, Standards, and Principles"(Marconipar. 16)
Apply
the40principles toprovidethesolutionsfortheContradiction.6.0 "Changethe 'Mini-Problem'" (Marconipar.
16)
Sometimes, the definition and contradictions of the problem contain the
limitationsof psychological inertia, and then this step offers waysto revisit both
ofthem.
7.0 "Review the Solution and Analyze the Removal of the Contradiction"
(Marconi par.
17)
The solutions will be evaluated to see how well it fits the requirements of
8.0
"Develop
Maximum Usage ofthe Solution" (Marconipar.17)
We generalize the solution into a method, and then we would like to
maximize the usage ofthis solution. Can this solution be applied to other cases?
Seeking
this answer is the purpose ofthe step. This step cannot give us muchinformation forourproduct,butwillgiveus useful resources inthefuture.
9.0 "Review All the Stages in ARIZ in 'RealTime' Application."
(Marconi
par.17)
Review what our actual steps were in using ARIZ. Compare the steps with
the standard process, and then specify the difference, add the solutions to our
knowledgedatabase.
2.3 Introduction to DSM
The definition of a system is as follow: "A system is a collection of parts and
relations betweentheparts suchthat thebehavior ofthewhole is afunctionnot onlythe behaviorofthe parts,but also oftherelationsamong
them"
(Steward "SystemsAnalysis"
1).
Generally
speaking, we can considertheproductdevelopmentprocess as a system.Asthe system gets larger, it becomes more complex. Therefore, one way tounderstand the
system is to take it apart to study the relations. As we break a system into smaller and
smallerparts, thepartsusually becomeeasierand easiertounderstand.
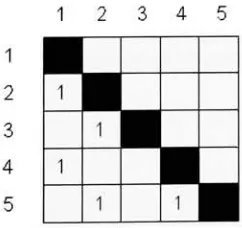
Therearetwowaystorepresentthestructure ofthesystem: graph andmatrix.
which is drawnfrom one vertex to another vertex showsthat the behaviorofthe one part
affects the behavior ofthe other part"
(Steward "Systems Analysis"
12). In Fig. 8, the
arrowfromvertex 1 tovertex2 impliesthatpart 1 affects part2.
(3; y
*0
>
Figure 8 Graphfora system
Another way ofrepresenting the structure of a system is using a matrix called
Design Structure Matrix (DSM). It is a matrixrepresentation of a project. Thepurpose of
DSM is to findthebest way to sequence activities. Forexample, thegraph in Fig. 8 can
be representedusing the matrixin Fig. 9. The cells onthe diagonal are filled. The rows
and the columns correspond to the parts of a system. Each cell with value
"1"
in the
matrix correspondstoanarcinthe graph. Thatisto say, acellwithvalue
"1"
incolumni
row
j
represents anarc from vertexi tovertexj. Forexample, thecell inrow2 column 1representsan arcfrom vertex 1 tovertex2.
12 3 4 5
1
2
3 '
4 1
5 1 1
[image:28.540.196.317.516.630.2]"Reading
along a single row reveals all ofthe tasks whose output is required toperform the task corresponding to that
(Reading
the DSM par. 3). For example,activity 2relies oninformation fromactivities 1.
"Reading
down a specific column reveals which task receives information fromthe taskcorrespondingto thatcolumn"
(Reading
theDSMpar.3). Forexample,activity 1delivers informationtoactivities2 and4.
TheprocesstobuildaDSMisasbelow:
1)
Interview the engineers toidentify
the appropriate system elements. Listthem intheDSMas labelsfortherows and columns. Both oftheelements
intherow and column shouldbe inthesame order.
2)
Determinetherelationship betweenthe elements,including
theinputsandoutputs ofthesysteminteraction.
3)
Fillthecells onthediagonal.4)
Fill the value of"1"
into a cell in column i row
j
ifthere is an arc fromvertexitovertexj.
5)
Double-check thematrix with engineers and managerstoverifytheDSM.Just as what was mentioned before, a system is usually broken into smaller and
smaller parts to become easier to understand. There are two approaches to do this:
partitioningandtearing. Thesetwoprocesses willbe introducedwhentheyare appliedin
3
LITERATURE
REVIEW
3.1 An Introduction to
QFD,
TRIZ and DSMTRIZ istheacronym for
"Theory
ofInventive Problem Solving"in Russian.DSM isatool to representthe task interactions of a project. It is a matrix with m
rows and columns. "Ifthere is aninformation
dependency
from task i totaskj, thenthecell of element
ij
is marked with an X. Otherwise, the cell of elementij
is leftempty"
(Yassineand
Falkenburg
224).There aretwo main categories ofDSMs: static and time-based. Terninko gave us
thedefinitionas below:
1)
"Component-Based or Architecture DSM: Used for modeling systemarchitecturesbasedon components and/or subsystems andtheirrelationships.
2)
Team-Based or Organization DSM: Used for modelingorganization structuresbasedon people and/or groups andtheirinteractions.
3)
Activity-Based or Schedule DSM: Used for modeling processes and activitynetworksbasedon activitiesandtheirinformation flowand otherdependencies.
4)
Parameter-Based(orLow-Level Schedule) DSM: Usedfor modelinglow-levelrelationships between design decisions andparameters, systems ofequations, subroutine
parameterexchanges
etc"
(292-293).
Design Structure Matrices (DSMs) I Static Time-Based
I
Component-based DSM People-based DSM Activity-based DSM Parameter-basedDSMFigure 10 DSMtaxonomy
Sabbaghian, Eppingerand Murmanintroducedthree types oftask interactions of
DSM. "In Figure 11, Tasks 1 and2 are 'independent' since no information isexchanged
betweenthem. Thesetaskscanbe executedsimultaneously (inparallel). Tasks3, 4, and5
are engaged ina sequentialinformationtransferand considered 'dependent'. These tasks
wouldtypically beperformed inseries. Tasks 7 and8, however, aremutually dependent
on information. These are
'interdependent'
or 'coupled' tasks often requiring multiple
iterationsforcompletion" (par. 12).
Task S^quenc
r: r. - \\
5 r-Taskl Ta5K2 Ta*3 TS6K4 Tasks Task6 Task7 I Task3 Tasks J
)
y
<ndep?r i-^i Taski U 1-^fTast 3|->fTask!]_>jTask5}~> JDependent
Jilouftied ^_
TsskDependency
Figure11 Sample Task-based Design Structure Matrix
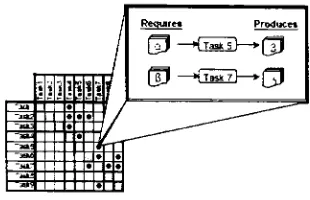
Sabbaghian, Eppinger and Murman also introduced Data-Driven Approach as
follow. "A
dependency
(marked cell) iscreated once atask'soutput isdefined asinputtoinformation flow. As seen, the
dependency
between tasks 5 and 7 in the DSM resultsfromtask7"(par. 15).
Pfrq'-iirg-i
S3 rF^ni >fTj
Figure 12 Sample DSMwith explicitinformationflow
DSM can be decomposed into a
hierarchy
of smaller DSMs as Figure 13. "Themodeling effort begins from the highest level activities and deliverables in a project
(called Level 1). Next, eachhigh-level taskis further decomposed into a set of sub-tasks
forming
a series oflevel 2DSMs"
(Sabbaghian, EppingerandMurmanpar. 19).
Level 3
Level 1
[image:32.539.179.334.106.206.2]3.2 The
QFD,
TRIZ and Taguchi Connection: Customer-DrivenRobust Innovation
(Terninko)
Thispaper combines
Quality
Function Deployment(QFD), TRIZ, andTaguchi inthe designprocess. In my thesis, I also combine QFD and TRIZ, but the approaches of
these two papers are different. This paper just gave me some thoughts about how to
combinethem.
After gathering the customer requirements (the voice of the customer), QFD
translates them into design requirements (the voice ofthe engineer) (par. 1). The TRIZ
methodologyprovides creativesolutionsforthedesignimprovements.
Theprocess combining QFDandTRIZisasfollow.
> "The first step isto
identify
the customerrequirements, and thenrankthepriorityofthe requirements. TRIZ allows a more aggressive attitudebecause
ofthepossibilities offered
by
thetechnicallinesof evolution.> The second step is to understand the customer's needs. The voice ofthe
customer context table should add the system and environment resources to
the"who," "what," "where," "when" and"how"informationneededin TRIZ.
> The third step maps the subjective demanded quality information ofthe
customer into the objective measures of performance used
by
the engineer.The matrix used is called the House of Quality. If a product is a model
upgrade, it is important to
identify
contradictions between different> The fourth step is concept generation. This is one ofthe most powerful
aspectsofTRIZ. TRIZwouldgenerate manyalternativesforthe improvement
inthereliability, manufacturability, cost,and environmentalimpact.
> The last step is about the manufacturing process. TRIZ provides for a
search for technologies which can improve process, the equipment and the
capabilityoftheircurrenttechnology"(par. 31-66).
3.3 A FrameworkforDesign Process Specifications Management
(Yassine,
andFalkenburg)
This paper mainly focuses on Design Process Specification Management, but
thereare still someuseful approachestoDSM, which are related withmythesis.
Firstly, the paper introduced DSM in section 2. Then it introduced axiomatic
design in section 3. Section 4 combined them through a sensitivity design structure
matrix
(SDSM)
representation. Section 5 was about the new concept of specificationmanagement. Section 6 presented an application example ofthe new method. Section 7
proposed a generalized graphical solution. Finally, Section 8 presented a summary and
someconcludingremarks.
SDSM can be considered as the improved DSM. It gives us a new method to
improvethedesignprocess,
by
combing DSMand axiomatic. "Inthe SDSMmatrix, theoff-diagonal entries inrowiand column
j
representthepartialderivative fortheoutput oftaskito theoutput oftaskj:
-Oj/-Oj.
Extending
theclassical DSMrepresentationby
theinclusion ofthe sensitivity coefficients allows us to understand and capture the design
Fromthis paper, Icanlearnthreemethods.
> Sometimes, we can use mathematical knowledge to improve existing
models.
> Wecanalso combinetwomethods
(models)
inour research.
r-It is a good choice to use graphical tools in some research. From the
graphical perspective, the
relationship between the parameters will become
moreobvious.
3.4 Product Development Process Captureand
Display
Using
Web-Based Technologies
(Sabbaghian,
Eppinger andMurman)
"Today's large product development programs can be divided into hundreds of
cross-functional teams, characterized
by
the participation of thousands of designers,working on hundreds of thousands of tasks over a period of several
years"
(par. 5).
Automobiles,rockets, or satellitesaretypicalexamples of such products.
Now, the information needed in the developmentprocess is usually obtained
by
tremendous interviews and cross-function group meetings. However, there are some
problems
during
this process. Just as what Sabbaghian, Eppinger and Murman said,"Significant effort is spent
facilitating
interactions among users in order to resolve dataintegration issues". "This synchronousdataacquisition approachis
logistically
difficulttocarry out andis therefore time
consuming"
(par. 27-28). Internettechnology was chosen
as the most suitable infrastructure for the proposed system due its ease of
deployment,
"The systemhasbeendevelopedontheWindowsNTplatformusingJava, Active
Server Pages(ASP), MS SQL-Server RDBMSandJDBC
middleware"
(par. 24).
3.5
Apply
the Design Structure Matrixto System DecompositionandIntegration Problems: A Review and New Directions
(Browning)
This paper reviews four DSM applications: Component-Based or Architecture,
Team-Based or Organization DSM, Activity-Based or Schedule DSM, and
Parameter-Based DSM. Italsodiscusses researchdirectionsand newDSMapplications.
The fourth part of the paper focuses on Information Flow-Based Process
Modeling Using
the Activity-Based DSM. The knowledge here is much related with mythesis, so Iwould liketo focus onthispart. It is helpfulto think of productdevelopment
from an information processing perspective. First, we use the DSM to describe the
input/outputactivitiesbasedontheinformationflow,toshowthe
dependency
structure ofa process. Then,theDSM isrearrangedto showtheimprovedprocessarchitecture,which
will minimizetheunintentionaliteration.
1)Decomposetheprocessintoactivities;
2)
Documenttheinformation flow amongtheactivities(theirintegration);3)
Analyze the sequencing of the activities into a(generally)
maximally feedforwardprocessflow.
The widely practiced initial step in analysis is called partitioning. Besides these
methods,there are several other methodstoresolve thecoupledblocksofactivitiesinto a
feasible execution sequence. The
following
two methods are the ones related with my"Aggregation: While aggregating two or more activities into a single activityto
reduce subdiagonal marks and simplify the DSM may seem attractive,
doing
so makesthemodelless useful
by
'sweepingundertherug'
theveryissues it should expose.
Decomposition:
Decomposing
coupled activities can reveal ways tointerminglethelower-levelactivitiesthateliminate feedback" (299).
3.6 Design ofObjectiveFunctions for Optimization ofMulti-Domain
Systems
(Andersson,
Jochen andPetter)
Multi-domainsystems can be characterized as complex systems, which combine
different fieldsofengineering (1). Theaircraft
landing
gearinthepaperis atrueexampleof a multi-domain simulationproblem, because it is combined ofmechanical, electrical
andhydraulic sub systems.
"The
landing
gear system consists of the actuallanding
gear, the hydraulicactuatorthatcreatestheretardation movement andthehydraulic supplysystem"
(1).
First ofall, thepaper used DSM toanalyze the system. As we can see from Fig.
14, the DSM method can visualize the coupling between different design tasks for the
gear design process. We also find that the parameters for the system that creates the
movement are totally dependent on the
landing
gear parameters but not the other wayLandinggearleg Movementcontrol
1Actuation Supply
A B c D E F G H 1 J K L M
A X Wheel diameter
B X Numberof wheels
C X X Leglength
D X Legdiameter
E X X Supportingbeam
F X X X X XXX X X Lengthoflever
G X X X X X X X X X Angleoflever
H
1 X
X
X X
X
X X
X X
X
X Piston Area
Pistonstroke
J X Systempressure
K XXX
X X
Valvesize
L X Pumpsize
M XXX X Accumulatorsize
Figure 14 Design Structure Matrix forthelandinggeardesignprocess
Secondly,itusedQFDtoanalyzethesystem.
> "Establish the characteristics ofthe
landing
gear system on the verticalaxis on the left in Figure 14. Some characteristics come from aircraft
regulations
(FAR)
that have to be fulfilled, i.e. these are demands that thesystemhas to meet, for instance minimum
descending
velocity or maximumbrake distance" (3). Other characteristics come from the customer
requirements.
> List the system parameters
(engineering
characteristic) on the horizontalaxis.
> As
being
shown in Fig. 15, fill the matrix to express ^he relationshipwe&t
Descendingvetocgy
FtetraeSonftne
Energycorcsunplion
Price
Crowdcarrying capacity
Loctaig tendiqgear
Brakedistance
E
Wheel
System Parameters
Landinggearteg Actuator Hvd.SuppV
Figure 15Relationshipmatrixforthelandinggearsystem
Then the paper used the simulation package Pro Mechanica Motion, which is a
Multi-Body-Simulation (MBS) environment and HOPSAN package to analyze the
system.
3.7 The Design Structure System: A Method for
Managing
the DesignofComplex Systems (Steward "The Design Structure
System")
This paper applied the techniques ofthe Design Structure System to
develop
aneffectiveengineeringplanintheprocessofthedesignofa system.
System design involves the determination of interdependent variables. "Before
some variables can be determined, other variables must first be knownor assumed. For
example, A cannot be determined unless B is first known or assumed, but B cannot be
determined unless A is first known or assumed. This implies a precedence order ofthe
variables,andconsequentlyofthetasksofdeterminingthese (71).
This paper introducedtwo approaches to rearrange the DSM to generate a faster
"Partitioning
is the process ofmanipulating (i.e.reordering) the DSM rows and
columns suchthat thenewDSM arrangementdoes notcontainanyfeedbackmarks."
Itis
anidealwayto transform the DSM intoalowertriangularform. However,it ishardto do
so forcomplex engineering systems. Therefore, "the variables can be reordered so as to
confine the marks in the matrix to appear either below the diagonal or within square
blocks on the diagonal." "The variables with the block each depend on all the other
variables in the same block and, therefore, cannotbe determined one at a time without
making
estimates."
Then,the nextstepistobreakthecircuits tofinda placetobeginthe
iteration.
(72)
"Tearing is to choose a set of marks representing where we might make
estimates."
We want to remove these marks so that no marks then would appear above
the diagonal. That means no additional estimates need to be made. The marks we
removed are calledtears. "The firstchoice of marksto tearisthose that theengineerfeels
would make good estimates. These are the predecessors that he already has a good
estimatefor,or, can make a poor estimateforwithoutsignificantly affectingthevariables
theyprecede. We assigntheseahigh-levelnumber, e.g., 9. Highnumbersmay beusedto
indicatethebetterplacestotear, lowernumbersmay beusedto indicate where estimates
are harder to make. We usually use level numbers inthe range from 6 to 9 to indicate
these sensitivities. Ifthis tearing leaves a reduced matrix with blocks containing more
thanonevariable, thenwe stillhave circuitsthathavenotbeentornyet. We haveto make
furthertears to breakthesecircuits. We usuallyuse levelnumbers in therangefrom 1 to
3.8
Planning
andManaging
the Design ofSystems (Steward"Planning
and
Managing")
This paper presents a method for planning the design process
by
applyingpartitioning,tearingandusingshuntdiagrams into DSM.
The paper
by
the same author The Design Structure System: A Method forManaging
the Design ofComplex Systems has introduced partitioning andtearing well,so I will focus onhowtouse shunt diagramshere. Thepurpose oftearing isto choose a
set of marks where we might makeestimates,andthenwecanbreaktheiteration.
First, there are some concepts we shall know. A principal circuit is the longest
circuit we canfindinthe block. Nowthereare fourpaths betweennodesinthisprincipal
circuit whichhave no arc or other node in common withtheprincipal circuit. These are
called shunts. Two paths between the same nodes inthe same directions are said to be
parallel. Otherwise, they are called ant parallel. In Fig. 16, B representsthe shuntbegins
atthenode; Erepresentstheend ofthe shunt; Pshowsthenumber of shuntsthatpassthis
node neither
beginning
nor ending here; S showsthenumber of parallel shunts; I showsthelargest indexofanyoftheparallel shunts.
Index
6SS42 BEPS1
b I B I I 0 2 3 5
i 3 K I 12 125
11 IB 1 0 2 3 S
_i_ _E_ _E_.t..20 2 1 12
e 1 0 0 112
9 B I 1 0 1 2 S
Graph - Principal
Circuit and shunts Shunt diagram Shunt diagram summary
There is no unique or optimal answer for tearing. The paper here gives us three
methods thatcan beused. The first is to tear theprincipal circuit whereP is low. Wecan
tear eitherthe arcs entering the node (just above the node) or the arcs exiting the node
(just belowthe node). The secondisto tearwhere S issmall,givinga
big
drop
inthe sizeoftheremainingblock,asin Fig. 17. We can choose multipletearsintheprincipal circuit
so no single shunt crosses allthelines,asin Fig. 18.
Index
5 4 4 3 3 2 _d c 1 a h_
d
B B
B
1
I
E
d
c
10 1 SI
c IXI02I 1
1 1 B 1 1 B 1 1 I^X 0^1 1
a E 1 r E 1 a f X X X t_0_l i
h E E l_ h 1 X X X 1 0 1
Tear to get small block inside
Tear with low I in Shunt Diagram Summary
Figure 17
5 4 4 3 3 2
a b i
_C B_ B I E_
1 I B II B
a E I IE I
h E E I_
.d_ 1 c a b_
a i_o_t 5 i
i I 10 2 1 I
C I X l_X 0_l I
a I X X X l_0_l I
h I x x x_f_o_l
Multiple tsars in Principal Circuit
sono one shunt crosses all the tear lines in Shunt Diagram
4
PRODUCT
DEVELOPMENT
KNOWLEDGE-PROCESSING
SYSTEM
4.1 Architecture ofHP DeskJet 1200C
Inorderto explainthenewmethodology inthis thesis clearly,the methodologyis
appliedintotheHPDeskJet 1200CPrintercase.
"The DeskJet 1200C made a quantum
leap
in the already impressive DeskJetcapabilities"
(Printer Workspar. 1).
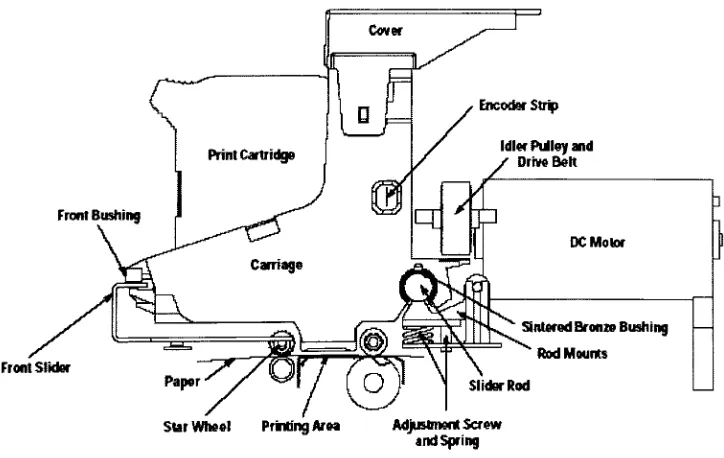
Firstofall, theprintingmechanismisexplainedinthispart.
As the Fig. 19 belowshows, theprinting system components consist ofthe paper
advance mechanism (stepper motor, drive shafts, and gearing system), the print
cartridges, the carriage and its axis, the carriage drive (dc motor, belt, pulleys, etc.), the mainheater,andthevapor removal system.
Front Sfidec
EncoderStrip
IdlerPulleyand
Drive Bell
DC Motor
Sintered BronzeBushing j
RodMourns
Star Wheel PrimingArea AdjustmentScrew
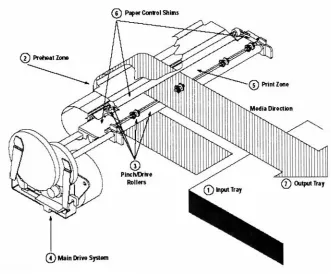
[image:43.539.84.446.418.647.2]The printingprocessisexplained asfollowed."Mediastackedinthe inputtray(1)
is
individually
pickedby
a media pick roller (not shown) and driven around the curvedpreheat zone
(2)
where it ispreconditioned (moisture is drivenoffandthe temperatureisraised). Whenthepage reachesthepinch/drive rollers(3),themaindrivesystem(4)takes
overfromthepick rollerdrive (notshown). Onceintheprint zone
(5)
themediais heatedfurther and ink is sprayed onto the page. The heating, soaking, and
drying
causes themediatomove out ofitsplane, butthemediacontrol shims
(6)
help
holditflatforbetterprint quality. Thepage is then
incrementally
advanced and printed upon until the entirepage has beenprinted. Finally,thepage isfedout intotheoutputtray
(7)
andtheprocessis readyto repeat"
[image:44.540.93.424.348.622.2](Broder 74). Thiswhole processcould beunderstood withthe
help
ofFig. 20.
Pap.erCon*IShins
(T)Main Drive Sjttem
4.2 The NetworkofICOMs overview
Weuse atoolcalled ICOM as shownin
Fig
21 and 22during
thisprocess.I, C, OandMrepresentInput, Control,Outputand Mechanismrespectively. Inputistransformed
into Output
by
usingtheMechanismthatisunderconstraintofControl. This functioncanbe expressed as Fi. i is the sequence ofthe function. Function is defined as: "A rule of
correspondence between two sets such that there is a unique element in the second set
assignedtoeach element inthe first set"
(Dictionary
par. 2). Forexample,in Fig. 21 and22, I represents our product and the competitor's product; O represents our future
product; C represents the control such as our manufacturing capability and so on; M
represents the mechanism such as QFD and so on. Based on our manufacturing
capability, Fl means that we can use QFD as a tool to analyze our product and our
competitor'sproduct, toestablishthedetails forourfutureproduct.
Control(C)
Input(1)
Function i
Output(0)
t Mechanism (M)
Figure 21 ICOM
Suchas
Manufacturing
capability.
Ourproduct
Function 1
Our futureproduct
Competitor'sproduct
f SuchasQFD.
Figure 22 ICOMexample
For the purpose of representing the data movement in the whole product
Throughoutthe followdiscussion,thedefinitions for thesymbolsused inFigures
23
-67are asfollow:
1. "The term ICOM refers collectively to the group of information flows
between activities which have one offour roles in the activity"
(Department
of Defense par. 5). I, C, O and M represent Input, Control, Output and
Mechanismrespectively.
2. I represents a matrix as the input of data "used to produce the output of an
(Department ofDefensepar. 5). Orepresents a matrix astheoutput
of data "produced
by
orresulting fromthe activity"(DepartmentofDefense
par. 5). Both I and O areusuallyexpressed
by
two or three capital characterssuch as CR, ECand so on.
3. Therectangle represents thefunction process, whichtransforms input datato
unique output data. This process includes the Mechanism that is under
constraint of Control. Control is defined as "Information that constrains or
controlsan
activity"
(DepartmentofDefensepar. 5). Mechanism is definedas
"Usually
people, machines,or systemsthatperformtheactivity"(Department
ofDefensepar. 5).
4. The subscript ontherightofI/Orepresentsthesequence oftheinputs/outputs
through thatfunction.
5. This thesis focuses on the data exchange
during
the product developmentprocess, sothecontentforMandOwill notbe discussed here.
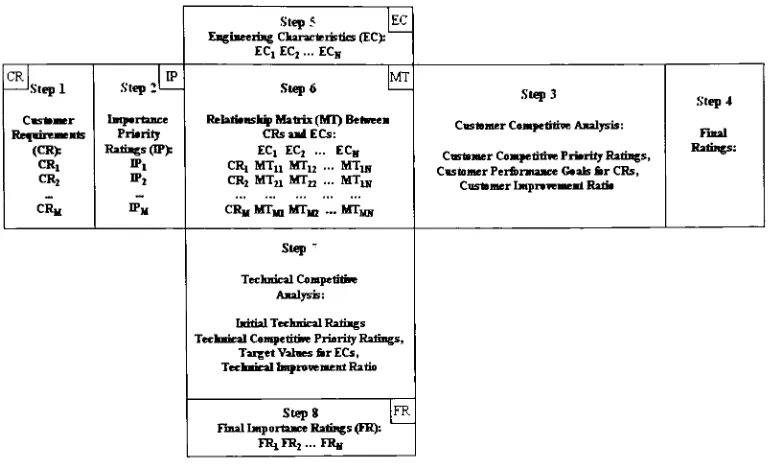
4.3 Network ofICOMs for QFD
Figure 23 isadescription fortheHouse of
Quality
model. It is based onFig. 2 ofLai-Kow'spaper.
Step5
EngineeringCharacteristics (EC):
EC, EC,...ECH
CR Step1 Customer Refniremeitis (CR): CR, CR, CRh Step: Importance Priority Ratings (TP): IP. IP* IPm Step6
RelationshipMatrix(MT)Between CRsaniECs:
EC, ECj ... EC,
CR, MT MT,2 MTlH
CR2MTa WTn...MTu,
CRH MTh, MT^, ...MTujj MT
Step3 CustomerCompetitive Analysis:
Customer CompetitivePriority'
Ratings,
CustomerPerformance GoalsforCRs,
Customer ImprovementRatio
Step4 final Ratings: SeepT TechnicalCompetitive Analysis:
InitialTechnical Ratings Technical CompetitivePriorityRatings,
Target Values for EC's. Technical ImprovementRatio
Step8 Final Importance Ratings (FR):
FR,FR2...FRg
FR
Figure23HOQModel (Adapted from Fig. 2ofLai-Kow's paper)
This network ofICOMs showshowthe datamoves from one process to another
during
QFD. Thereare fourtransformsduring
this process,which are showninFig
24. [image:47.539.68.457.138.373.2]CR CR F2 IP F1 EC CR F3 MT F4 FR
Figure 24 Agraphic network ofICOMs for QFD
Allofthese transformscanberepresentedusing ICOMsasFig.25.
CR
[image:47.539.165.360.482.554.2]Fl Transform
Fig. 26, 27, Table 1 and 2 represent the 1st transform ofthe network. Fig. 26 is
derived from Fig.24. Table 1 and 2arethecontentsforthis transform.
According
to whatClausing
says "The language of the customer tends to besubjective, qualitative, and nontechnical", seven Customer Requirements are acquired
through surveys and interviews with the customers
(Clausing
65).They
are denoted asCRm, m=l,2, ..., M. Inthis case, M equals 7, so CR is anordered set with 7 elements.
TheelementsofCRare shownin Table 1.
IP stands forthe Importance Priorities foreach element ofthe CR. Inthis case it
isan ordered set as well as a7x1 matrix, thevalues of which are showninTable 2.
CR
F1
IP
Figure 26 Fl transformfromthenetwork
Fl represents the assignment of relative importance IPm to the customer
requirement CRm.
"Relative"
here means this is an example of"ordinal and
rational"
scale. Thatis to say, inFig. 27, Color quality is five times as importantas Archivability,
because of IPi=5 and IP7=1. The value of IPm can be determined using a number of
attributeweightingmethods. Inthis example, thepair-wise comparisonmethod was used
(basedonUlrich 135),as illustratedin Figure 27.
i CR, Desigrtype
reference(egone ofCanonpunter Rating
1 Colorquality 3 5
2 Air fillquahty 3 4
3 lineand edgequality 3 4
4 Archivability 3 1
5 Cockle 3 3
6 Curl 3 3
7 "Whiteness 3 2
First ofall, the elements ofCR are listed inthe second column ofthe matrix, as
shownin Fig. 27. Secondly,giventheexistenceofadesignreference, aweightingof5 is
assigned ifthe design attribute is much better that the reference; a weighting of4 is
assigned ifthe designattribute is betterthan the reference; 3 ifthe designattribute isthe
same as the reference; 2 if it is worse than the reference; and 1 if it is much worsethan
the reference. A competitive product or alternate design ofknown performance may be
used as areference, forexample, one type ofCanonprinter. Theresult is shown in Table
2. Inourexample, thepurpose istoexplainhow touse this method, sotheelements ofIP
might be different from the real values, because this determination of these values
requires alotofresources, such as real data, enoughtimeand experience. However, what
willbe discussed inthis thesisis suretobecorrectusingthesevalues.
Seven Customer Requirements forour product Importance Priorities
CRi: Color quality IP,: 5
CR2: Airfill quality IP2: 4
CR3: Lineand edgequality Fl IP3: 4
CR4: Cockle IP4: 3
CR5: Curl IP5: 3
CRe: Whiteness IP6: 2
CR7:
Archivability
IP7: 1F2 Transform
Fig. 28 andTable 3 representthe2ndtransformofthenetwork.
Define
(ECj
|
CR,depends onECj). i=1,2,...,M andj
= 1,2,...,Nas an ordered set
of
Engineering
Characteristics upon which a given Customer Requirementdepends,thenM
EC =
(J
(EQ
|
CR depends on ECj). There are N=18Engineering
Characteristics int=t
this case, all ofwhich are given on Hunt's paper (Hunt 18-20). The elements ofEC are
shown in Table 3 below and the definitions for these
Engineering
Characteristics aregiven onAppendix 3.
F2 isthemappingofCRtoEC (see Fig. 28).
CR
F2
EC
Figure 28 F2transformfromthenetwork
Ed:
[<->]
Color GamutEC2:
[I] Drop
placementaccuracyEC3:
[I]
BandingEC4:
[|]
Waittimebanding
EC5:
[|] Mottling
EC6:
[1]
BleedEC7:
[<-]
CoalescenceEC8:
[<-]
RegistrationECio:
EC,,:
EC12:
EC13:
EC14:
EC15:
EC,6:
EC17:
EC18:
I]
Spray, leathering, andjaggy
linesI]
Visual measurementof paperflatnessI]
Visual measurementoftheheightofthecornerson aflatsurface-] Theamountofinkplacedonthemedia
|]Dot
density
?] The consistencyofthe
drop
volume?] The consistencyofthe
drop
size>]Inkpenetration rate
?] Orifice diameter
Note: "|"representstodecreasetheamount;
"j"
representsto increase;"-"
representsit
isnotnecessaryorhardtodecidethedirection.
Table 3 EighteenEngineeringCharacteristics
F3 Transform
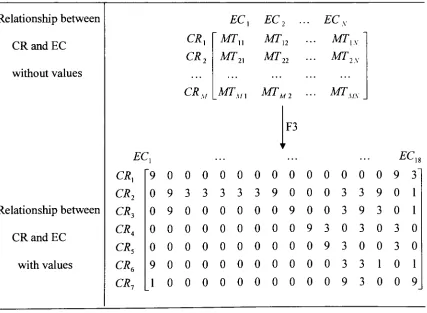
Fig. 29 andTable 4representthe3rdtransformofthenetwork
MT
>
EC
F3 CR
Figure 29 F3transformfromthenetwork
MTisthe matrixthatrepresentstheextent towhicheach CRm is dependentupon
(Crowpar. 4). In this case, the rational scale 1. 3, 9
(corresponding
to weak, moderate,andstrongdependencerespectively)isused.ThetransformF3 is definedas followed:
DefineMTmn=
0ifCRmisindependentofECn;
MTmn =
1 ifCRmdependsweaklyon
ECn;
MTmn=3 if
CRmdependsmoderatelyonECn;and
MTmn=
9 ifCRmdependsstronglyonECn.
Vm,n m=l,2,...,M and n=l,2,...,N.
The fullmatrix oftheserelationships isshownin Table 3 below. Forexample,the
relationshipbetweenCR, andEC, is considered as
"strong"
thatcorresponds to thevalue
MT,,=
9. Theprocesstogetthesevalues isshownin Appendix 4.
Relationship
betweenEC,
EC2 .ECS
CRandEC
CR,
CR2
-MT
MT2,
MT,2
MT22
MT,S
-MT2S
without valuesCRXI
MTA
42 MTm- _F3
'r
EC,
ECCR,
"9 0 0 0 0 0 0 0 0 0 0 0 0 0 9CR2
0 9 3 3 3 3 3 9 0 0 0 3 3 9 0 1Relationshipbetween
CR3
0 9 0 0 0 0 0 0 9 0 0 3