City, University of London Institutional Repository
Citation
:
Emami, S. D., Lee, H. L., Rahman, M. M., Abdullah, F., Abdul-Rashid, H. A.,
Dashtabi, M. M. & Rahman, B. M. (2017). Evolution of Surface Acoustic Waves in an Optical
Microfiber. IEEE Journal of Quantum Electronics, 53(5), 6800808.. doi:
10.1109/JQE.2017.2747152
This is the accepted version of the paper.
This version of the publication may differ from the final published
version.
Permanent repository link:
http://openaccess.city.ac.uk/18292/
Link to published version
:
http://dx.doi.org/10.1109/JQE.2017.2747152
Copyright and reuse:
City Research Online aims to make research
outputs of City, University of London available to a wider audience.
Copyright and Moral Rights remain with the author(s) and/or copyright
holders. URLs from City Research Online may be freely distributed and
linked to.
City Research Online:
http://openaccess.city.ac.uk/
[email protected]
Abstract— This paper reports SBS characterization in a
tapered optical fiber using full-vectorial finite element based numerical methods. Numerical simulations of both optical and acoustic waves’ propagation through a tapered microfiber have been carried out. Acoustic modes over a range of wavenumber for different fiber core radii are obtained and nature of their both dominant and non-dominant displacement vector profiles are studied and discussed. Acoustic mode profiles show confinement of the acoustic wave predominantly at the core cladding interface. In addition, the acousto-optical overlap factors at different fiber radii are also presented.
Index Terms— Optical Microfiber, Surface Acoustic Wave,
SBS, FEM.
I. INTRODUCTION
Stimulated Brillouin Scattering (SBS) is an optical scattering process caused by nonlinear interaction between stoke and pump lights via electrostriction process [1,2]. The incident optical power which is also known as the pump wave has to be higher than the threshold power to generate acoustic wave. Sound vibration will fluctuate the refractive index of optical waveguide, creates a moving grating, therefore scatter the injected pump wave. The scattering effect will transfer power from pump wave to Stoke wave which propagates in the opposite direction and is termed as GAWBS (guided acoustic wave Brillouin scattering) [3]. Loss in energy is expected due to fiber vibration. Because of this, acoustic frequency shift lowers the frequency of Stoke wave from the original pump wave frequency [4]. When acoustic wave travels along the surface of a medium, it is then called the Surface acoustic wave (SAW) [5].
The SAW was first reported by Lord Rayleigh in 1904 [6], formed by a combination of shear and longitudinal acoustic waves at the surface of a solid medium. SAW has a finite total
Manuscript
Siamak Dawazdah Emami and Mahdi Mozdoor Dashtabi are with Laser and Plasma Research Institute, Shahid Beheshti University, Evin, Tehran, Iran(e-mail: [email protected]).
Hairul Azhar Abdul-Rashid, is with Faculty of Engineering, Multimedia University, 63100 Cyberjaya, Selangor, Malaysia.
Lee Hui Jing and Fairuz Abdullah are with Photonic Technologies Research Group, College of Engineering, Universiti Tenaga Nasional, 43000 Kajang, Selangor, Malaysia
B. M. Azizur Rahman and Moseeur Rahman are with Department of Electrical and Electronic Engineering, City University London, London EC1V 0HB, U.K. (e-mail: [email protected].)
energy however; energy distribution in SAW is more concentrated near the surface and decays away from the boundary [7]. SAWs have many potential applications as the energy is confined approximately within one wavelength at the surface hence it can easily be detected by sensors [8] and this functionality has been exploited as a vapor sensor [9] and chemical sensor [10-11]. Velocity of SAW is lower than both the shear and longitudinal acoustic wave velocities [12].
SAW has recently drawn the attention of researchers when Beugnot observed SAW propagation in Brillouin scattering on the surface of a silica microfiber [13]. It is demonstrated that such an effect is dependent on both the electrostriction and radiation pressure [14]. In addition, recent paper from his group presented experimental SAW results in a small core photonics crystal fiber (PCF) [15]. SAW for both silica microfiber and PCF recorded a lower acoustic frequency shift as compare to the normal acoustic wave. Potential applications of both silica microfiber and PCF in optical sensing were also reported.
To study the light-sound interactions, numerical method should be capable of accurate modal solutions in such guided-wave structures. A wide variety of analytical and numerical techniques have been developed to characterise optical waveguides and also acoustic waveguides. In 1969, Waldran reported on the modal solution approach for a circular acoustic waveguide by using a field expansion method. This was similar to the classic paper by Smith [1] on the field expansion in cylindrical coordinates and field continuity matching at core-cladding interface for weakly guiding optical fibers. Solution of a waveguide with small index contrast (either optical or acoustic) can be satisfactory by considering circular symmetry of such a solution. However, waveguides with strong index discontinuity, the modal profiles may not be circularly symmetric due to the boundary conditions, as shown for nanowires [16]. SAW generation which involves both optical and acoustic modes has been studied, and co-existence of both longitudinal and shear acoustic waves were observed [12]. However, although the SAW was confirmed by using commercial software but however, many of these approaches can be less than satisfactory, particularly for strong index contrast waveguides, if a simpler scalar formulation is used. Silica microfiber shows immense potential to exploit strong light-matter interactions [17] however, only a limited number of full-vectorial approaches have been reported so far. Therefore, there is a need and interest to develop rigorous approaches and use them to optimize the performances of such
Evolution of Surface Acoustic Waves in an
Optical Microfiber
Element Method (FEM), and presents both the fundamental longitudinal and shear SAWs for silica microfiber with R = 1 µm and 2 µm at various wavenumbers. Evolutions of the dominant displacement vector are shown which can be utilized to predict the SAWs behavior of silica microfiber at different fiber radii, optical wavelengths and acoustic wavenumbers. The overlap factors between the optical and acoustic waves for Stimulated Brillouin Scattering (SBS) at different wavenumbers are also calculated.
II. FEMMODELING
The FEM was first introduced in 1960 solving for complex engineering problems where the solution region is divided into suitable number of smaller constituent elements and then nodal points are assigned at the boundary of these elements. Based on the discretisation, interpolation functions are used to define the functional variable to solve for the element properties using a matrix equation [18]. The cross-sectional area of a structure under study is represented by using a large number of elements, which are often triangular in shape. The shape functions and nodal field values are used to determine the field profile over the waveguide cross-section [19-20].
A. Optical Model
Full-vectorial formulation for optical waveguide is presented as [18].
dxdy H H dxdy H H H H
( ) ( ) ( ) ( ) 12 (1)
In which * is the complex conjugate, ɛ is the permittivity and µ is the permeability constants. Equation (1) solves for the propagation constant of optical modes in optical waveguides, which can also guide acoustic mode. The propagation constant of optical wave, β, is defined as:
eff optic n 2 (2)
where, neff is the effective index of the optical modes which falls between the refractive indices of the core and clad and λ is the wavelength of incident light wave.
B. Acoustic modes
There are two basic types of acoustic waves, namely the shear and longitudinal acoustic waves. Shear wave associated with dominant material dispersion in the transverse directions which is perpendicular to the direction of propagation, taken here as the z-axis. On the other hand, for a longitudinal wave, expansion and contraction of wave associated with the particle
through a waveguide can be a combination of shear and longitudinal acoustic waves [22]. Brillouin frequency shift of the Stoke wave is given as:
ac eff B V nf 2 (3)
where, Vac is the acoustic velocity. Acoustic wave satisfies the Hooke’s Law which relates the stress (tensor) and strain (force) of the waveguiding materials [23-27].
C. Phase Matched Condition
Electric field associated with a high power optical wave cause molecular movements due to electrostriction process. The material movement can generate acoustic waves. Associated material movements of the acoustic wave cause density variation along the waveguide. The time and space dependent density variation changes refractive index profile and produces a moving optical grating. This grating can reflect an incoming light when its wavelength matches the spatial period of the gratings generated by the acoustic wave. Above a threshold power if phase matching conditions are satisfied, it can inhibit forward guidance of the incoming light. The backward scattered reflected wave is frequency shifted, which explains the occurrence of the Stoke Wave [27]. The relationship between optic and acoustic propagation for phase matching condition can be given as:
optic acoustic
k
2
(4)where
k
acousticis the acoustic propagation constant and this will be double of theoptic
, the optic propagation constant. The frequency shift of the Stoke wave is given by Eq. (3).
For the SBS characterization in a tapered microfiber, both its guided optical and acoustic modes were obtained by using the FEM. The neff for the optical mode in a tapered fiber for a given radius is first calculated using H-field based FEM model [28]. First the finite element mesh topologies of the tapered fiber cross-section is generated and then used to solve the eigenvalue equation (1) to simulate the desired optical modes at 1550 nm of input wavelength. Based on the value of neff generated, optical propagation constant is calculated by using Eq. (2). Eigenvector and eigenvalue of acoustic waves are also obtained and then the acoustic mode patterns are generated. At the phase matched condition, the acoustic wave propagation constant is double of the optical wave propagation constant value:
k
acoustic
2
optic.III. RESULTS
fiber, when the fiber diameter is reduced from typical 125 µm to only a few microns, then the light cannot be confined anymore inside the small core. In this situation, optical mode moves out of the core and extends into the cladding region and subsequently confined by the surrounding air. In this case, the earlier core and cladding together behave like a smaller core with outside air as its cladding. Here, the refractive index of silica core and air cladding are taken as 1.4447 and 1.0 [5], at the operating wavelength. The shear and longitudinal acoustic velocities for silica core are taken as 3677 m/s and 5736 m/s, respectively with material density equal to 2202 kg/m3. Air does not support acoustic shear mode, but only supports longitudinal modes with acoustic velocity of 343 m/s and 1.225 kg/m3 as its density [29].
Simulation results verify confinement of the SAW at the surface of the microfiber. Evolution of acoustic wave profiles for microfiber with R = 1 µm and 2 µm at various propagation constants were carried out. Such results are fundamental to predict the behavior of SAW in a microfiber with various core radii. Optical modes for microfiber with radius from 1 µm to 6 µm were obtained and these optical parameters are used to simulate acoustic wave at the phase matched condition followed by calculation of acousto-optic overlap factors.
A. Optical solutions
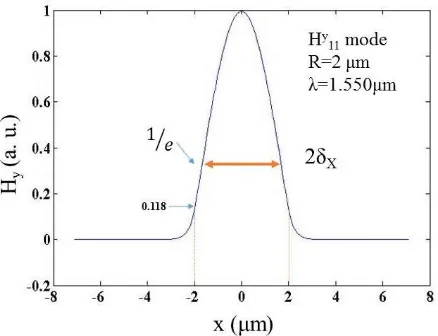
[image:4.612.329.547.52.224.2]First, optical modal solution of a tapered optical microfiber is carried out. When the overall fiber dimension is reduced, its original core become smaller hence the whole fiber will now behave as the core and surrounding air as the clad. Figure 1 and 2 show the dominant Hy and Ex field profile of the Hy11 (fundamental quasi-TE) optical mode for a microfiber with R = 2 µm at operating wavelength of 1550 nm. This shows a circular symmetric mode profile. Figure 3 shows its variation along the radial direction (also the same along x-direction). The numerically simulated results demonstrate a strong optical confinement inside the core of microfiber. It can be observed that the normalized Hy field reduces monotonically along the radial direction. Its value at the core cladding interface was calculated as 0.118. The spot size, 2δx as shown in Fig.3 is calculated as 3.7 µmwhen R = 2µm. For this quasi-TE mode, its x-component of the Electric field, Ex is dominant. In this case, Ex reduces monotonically along the y-direction, but this profile along the x-direction shows two peaks at the left and right-hand side core-cladding interfaces, but not shown here. As Ex is not circularly symmetric, so the resultant intensity profile (Poynting vector) will also not be circularly symmetric [16] for a microfiber with a strong index contrast. Variation of the effective index with the core radius for the Hy11 mode is shown in Fig.4. The effective index, neff increases rapidly as the radius increases; then converges slowly for R > 3 µm. When its radius is very large, most of the light would be confined in the silica core and its effective index would asymptotically approach the refractive index value of silica, taken here as 1.4447.
[image:4.612.316.563.249.427.2]Fig. 1. Hy field contour for the Hy11 mode when R = 2 µm and λ = 1550 nm.
Fig. 2. Ex field contour for the Ex11 mode when R = 2 µm and λ = 1550 nm.
Fig. 3. Variation of the Hy field profile along the x direction for the Hy11
[image:4.612.323.542.453.621.2]Fig. 4. Variation of the effective index, neff with the fiber radius, R for the Hy11
mode
B. Acoustic solutions
The microfiber also supports various acoustic modes which can be either quasi-longitudinal, or quasi-shear acoustic mode, as these modes are fully hybrid in nature, where other non-dominant displacement vector components are also present. Some of these dominant acoustic modes are studied next. In this paper, evolutions of these acoustic modes with microfiber diameter and wavenumber are thoroughly studied. The longitudinal acoustic modes have their dominant displacement vector, Uz, along the axial direction, z.
[image:5.612.58.291.59.239.2]The dominant Uz(x,y) displacement vector profile of the fundamental longitudinal Uz11mode is shown in Fig.5, when R = 2 µm and propagation constant, k = 7 µm-1. It clearly shows the profile is circularly symmetric. Although its variation along the radial direction can be guessed, but to show this profile clearly, variation Uz along the radial direction is shown in Fig. 6. For this mode, variation of Uz along the x and y-directions are almost similar, so its variation along the x-direction is shown only. This shows a very different mode profile than the typical optical mode profiles. This clearly shows the large peak at the core-cladding interface, x = R= 2 µm, identified here as ‘A’. This also shows rapid change in the sign with a secondary peak (of opposite sign) close to interface but inside the core, shown here as ‘B’ and another maxima at the center of the core, shown here as ‘C’. Nature of these profiles continuously evolves with the change in the wavenumber or the microfiber diameter. Non-dominant Ux and Uy displacement vectors for this Uz11 mode also show confinement close to the core-cladding interface, but now shown here. Ux vector shows two peaks (positive and negative) on the left and right sides of the core and Uy vector shows two peaks at the upper and lower sides of the core. There are also higher order longitudinal acoustic modes, but these are not shown here.
Fig. 5.Dominant Uz (x,y) contour profile of the Uz11 mode, R = 2 µm, k = 7
µm-1
Fig. 6.Variation of Uz vector of the Uz11 mode along the x-direction. On the other hand, the shear acoustic, also called as transverse modes, have their dominant displacement component as either Ux or Uy. These modes are also degenerate as this waveguide has a 90 degree rotational symmetry. However, we have exploited the different boundary conditions of these two modes at the vertical and horizontal axes to isolate them. Figure 7 shows the dominant Ux (x,y) displacement vector profile of the fundamental Ux11 mode when R = 2 µm and k = 7 µm-1. This profile is clearly not circularly symmetric. The boundary condition of Ux and Uy at the vertical or horizontal interfaces are different and this destroyed the circular symmetry of these mode profiles. Two peaks on the left and right sides demonstrate that this acoustic wave is confined at surface of microfiber in the x-direction. Next, its variations along the x and y-directions are shown.
[image:5.612.324.552.264.427.2]Variation of the Ux vector for the fundamental Ux11 mode along the y-direction through the center of the microfiber is shown in Fig.8. Here it can be observed that its peak values are much smaller than the two peaks along the horizontal direction, as was shown in Fig.8. The two peaks in this case appear slightly inside the fiber core. A small discontinuity of the Ux vector at the upper and lower interfaces, due to the boundary condition, can also be observed as shown here by two arrows. The lowest value shown here as ‘I’, is the same as that shown in Fig.9 at the center of the microfiber.
Fig. 7. Dominant Ux (x,y) profile of the fundamental Ux11 mode for R = 2 µm,
[image:6.612.316.561.364.542.2]k = 7 µm-1
Fig. 8.Variation of the dominant Ux vector of the fundamental Ux11 shear
[image:6.612.70.283.388.536.2]mode along the x-axis.
Fig. 9. Variation of the dominant Ux vector of the fundamental Ux11 mode
along the y-axis
For both the Uz11 and U x
11 modes, the mode profile strongly depends on the fiber radius and also on the frequency and wavenumber. Next, their evolutions with the fiber radius and wavenumber are thoroughly studied.
The Uz vector profile of the Uz11 mode evolves with the wavenumbers and also with the fiber radius. Figure 10 plots the ratio of maximum peak (A) and minimum peak (B) as shown here by the upper-right inset (also identified in Fig. 5), with the wavenumber, k for core radius 1 µm and 2 µm. For the microfiber radius of 2 µm, the |B/A| ratio, shown here by a dashed line, increases from 0.2308 to 0.5333 when wavenumber k is reduced from 12 µm-1 to 3 µm-1. Similarly, for a microfiber with radius, R = 1 µm the |B/A| ratio increases from 0.2214 to 0.6969 when k is reduced from 12 µm-1 to 5 µm-1 as shown here by a solid black line. To illustrate the variations of their profiles, 3 additional insets are also shown. For R = 1 µm and k = 10 µm-1, Uz profile is shown by the lower-right inset, when |B/A| = 0.3192, and this increases to 0.4615 when k = 7 µm-1, shown by the upper-left inset. On the other hand, as R is increased to 2 µm, for the same value of k = 7 µm-1, |B/A| is reduced to 0.24 as shown by lower-left inset. These clearly suggest that, displacement vector inside the core increases when k and R are reduced.
Fig. 10.Variation of the |B/A| ratio with the acoustic wavenumber for R = 1 µm and R = 2 µm
[image:6.612.66.283.573.723.2]can be controlled by selecting a suitable optical wavelength and the resultant optical propagation constant, β, (and so the phase matched k) would be depending on the optical wavelength and the fiber radius.
Fig. 11.Variation of C/B ratio of the Uz displacement vector with the
acoustic wavenumber
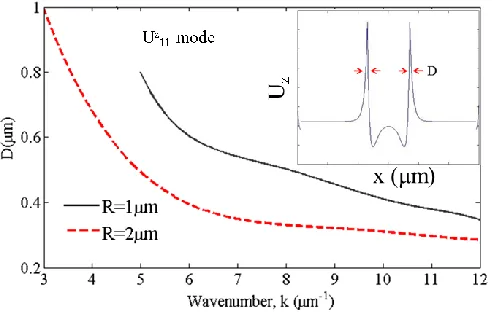
[image:7.612.317.568.269.428.2]It was also observed that width of the displacement vector peak also varied with the microfiber radius and acoustic wavenumber. Variations of the Full-Width-Half-Maximum (FWHM) of the Uz vector with the wavenumber are shown in Fig.12. Here the FWHM is defined as sum of the two peaks, when their values drop to the half of the maximum value, as shown by red arrows in the inset. It can be observed that this value reduces when acoustic wavenumber, k is larger or the microfiber radius is increased, signifying that peaks becomes very narrow in these cases and confines predominantly at the core-cladding
[image:7.612.49.295.493.649.2]interfaces.
Fig. 12.Variation of the peak width, FWHM with the acoustic wavenumber for the Uz
11 mode.
Similarly evolution of the fundamental Ux11 shear acoustic mode is studied next. In this case, Ux is the dominant displacement vector and its 2-D contour profiles and
identified here as I/H ratio in the upper-right inset, with the wavenumber is shown in Fig. 13. The upper-left and lower-right insets are for k = 4.0 and 9.0 µm-1 for R = 2 µm, respectively. It can be noticed that for a range of k and R values this ratio can be close to zero, which implies displacement vector is nearly zero at the center of the microfiber. For R = 2 µm, shown here by a dashed red line, when k is reduced to 3 µm-1, this ratio is increased to nearly 0.5, which means the value at the center of the core would be half of the peak value at the core-cladding interface. On the other hand, as fiber radius is reduced, as shown by a solid black line for R = 1 µm, this ratio increases. This signifies that overlap between the Ux vector of the fundamental shear mode with the optical mode would increase when the wavenumber and fiber radius are lower.
Fig. 13.Variation of the I/H ratio for the Ux
11 mode with the acoustic
wavenumber.
C. Light Sound Interaction
Finally, the acousto-optic interaction is studied by using the fundamental acoustic longitudinal mode to calculate the overlap with the fundamental quasi-TE optical mode. Equation 5 shows the overlap integral depends on the optical and acoustic mode profiles and this can be controlled by fiber refractive index profile and acoustic velocity profile designs
[30-31].
dA y x Uj dA y x U
dA y x U y x H
i
j i
ij 4 2
2 2
2
) , ( )
, (
) , ( ) , (
(5)
Here, ij is the normalized overlap integral between the optical and acoustic fields, where Hi(x,y) is the ith component of the optical field associated with the fundamental mode, and Uj(x,y) is the j
th
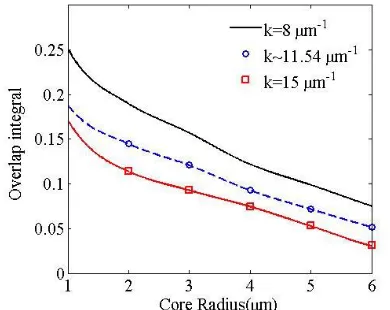
are shown by a solid line and a solid line with square symbols. It can be observed that overlap increases when fiber radius is reduced and also acoustic wavenumber is reduced. It should be noted that when microfiber radius is reduced both the optical and acoustic mode profiles changes. However, for the SBS gain, the propagation constant also need to phase matched with the optical propagation constant, β, which varies with the fiber radius. We have noted that this value remains very close to k 11.54 µm-1, and shown here as the blue dashed line with circles.
Fig. 14.Overlap for k = 8 µm-1, k ~ 11.54 µm-1 and k = 15 µm-1 IV. CONCLUSION
Accurate calculations of fully hybrid fundamental longitudinal and shear modes are presented. For both the modes, evolution of the dominant displacement vectors with the acoustic propagation constant and microfiber radius are shown here. It has been shown that for most of the cases acoustic energy would be confined to a narrow region close to core-cladding interfaces, which can allow efficient sensing at the surface of the microfiber. It is also shown here that when the acoustic wavenumber and the fiber radius are reduced, acoustic mode inside the fiber core increase and their overlap with the optical mode is expected to increase. Variation of the overlap between the dominant Uz displacement vector of the Uz11 mode and the Hy field of the quasi-TE H
y
11 optical mode with the fiber radius for phase matched cases are also shown here. Understanding of these would be crucial in the optimisation of light-sound interactions in microfiber for various applications. Besides, the fundamental modes, optimization with other higher order longitudinal and transverse acoustic modes can also be carried out to optimize a multi (acoustic) moded microfiber, if necessary, such as to sense simultaneously both strain and temperature. The fully-vectorial approaches reported here using computationally efficient FEM would be suitable to characterize light-sound interactions in many practical waveguides with strong index contrast.
REFERENCES
[1] R. G. Smith, "Optical power handling capacity of low loss optical fibers as determined by stimulated Raman and Brillouin
scattering" Applied Optics, vol. 11, no. 11, pp. 2489-2494, 1972.
[2] W. R. Boyd, “Nonlinear Optics”, Academic press, 2003.
[3] R. M. Shelby, M. D. Levenson, and P. W. Bayer. "Guided acoustic-wave Brillouin scattering." Physical Review B 31, no. 8: 5244-5252,1985. [4] K. Shiraki, M. Ohashi, and M. Tateda,"SBS threshold of a fiber with a
Brillouin frequency shift distribution" Lightwave Technology, Journal of, vol.14, no. 1, pp.50-57, 1996.
[5] L. Kuhn, M. L Dakss, P. F. Heidrich, and B. A. Scott, "Deflection of an optical guided wave by a surface acoustic wave" Applied Physics Letters, vol. 17, no. 6, pp. 265-267, 1970.
[6] I. A. Viktorov "Rayleigh and Lamb waves: Physical theory and applications", Plenum press, 1970.
[7] S. Sriratanavaree, "The characterisation of acoustic waves in pticalwaveguides". PhD thesis, City University London, 2014.
[8] P. Dainese, P. St. J.Russell, N. Joly, J. C.Knight, G. S.Wiederhecker, H. L. Fragnito, V. Laude, and A. Khelif, “Stimulated Brillouin scattering from multi-GHz-guided coustic phonons in nanostructured photonic crystal fibers,” Nature Phys., vol. 2, pp. 88-392, 2006.
[9] H. Wohltjen, "Mechanism of operation and design considerations for surface acoustic wave device vapour sensors" Sensors and Actuators, vol. 5, no. 4, pp. 307-325, 1984.
[10]G. Schmera and L. B. Kish, " Surface diffusion enhanced chemical sensing by surface acoustic waves" Sensors and Actuators B: Chemical, vol. 93, no. 1, pp. 159-163, 2003.
[11]M. Cole, I. Spulber, and J. W. Gardner, "Surface acoustic wave electronic tongue for robust analysis of sensory components" Sensors and Actuators B: Chemical, vol. 207, pp. 1147-1153, 2015.
[12] P. R. Stoddart, J. D. Comins, and A. G. Every "Brillouin-scattering measurements of surface-acoustic-wave velocities in silicon at high temperatures" Physical Review B, vol. 51, no. 24, pp. 17574, 1995. [13] J. C. Beugnot, S. Lebrun, G. Pauliat, H. Maillotte, V. Laude, and T.
Sylvestre, "Observation of surface acoustic wave Brillouin scattering in optical microfibers," in Workshop on Specialty Optical Fibers and their Applications, OSA. paper W3.19, 2013.
[14] O. Florez, P. F. Jarschel, Y. A. V. Espinel, C. M. B. Cordeiro, T. P. Mayer Alegre, G. S. Wiederhecker and P. Dainese, "Brillouin scattering self-cancellation." Nature communications 7 (2016): 11759
[15] J. C. Tchahame, T. Sylvestre, K. P., A. Kudlinsk, V. Laude, and J. C. Beugnot "Experimental observation of surface acoustic wave Brillouin scattering in a small core photonic crystal fiber". Proc. SPIE 9894, Nonlinear Optics and its Applications IV, pp. 98941J, April 27, 2016. [16] N. Kejalakshmy, A. Agrawal, Y. Aden, D. M. Leung, B. M. Rahman,
and K. T. V. Grattan, "Characterization of silicon nanowire by use of full-vectorial finite element method". Applied Optics, 49(16), pp. 3173-3181, 2010.
[17] G. Brambilla, "Optical fibre nanowires and microwires: a review". Journal of Optics, vol. 12,pp. 043001, 2010.
[18] B. M. A. Rahman and A. Agrawal, "Finite Element Modeling Methods for Photonics" Artech House, 2013.
[19] C. Johnson, "Numerical solution of partial differential equations by the finite element method" Courier Corporation, 2012.
[20] B. M. A. Rahman and J. B.Davies, "Finite-element solution of integrated optical waveguides" Lightwave Technology, Journal of, vol. 2 no. 5, pp. 682-688, 1984.
[21] P. Göransson, "Acoustic finite element formulation of a flexible porous material—a correction for inertial effects", Journal of sound and vibration, 185(4), 559-580, 1995
[22] R. L. Higdon, "Absorbing boundary conditions for acoustic and elastic waves in stratified media" Journal of Computational Physics, vol. 101, no. 2, pp. 386-418, 1992.
[23] M. E. Potter, M. Lamoureux, and M. D. Nauta, "An FDTD scheme on a face-centered-cubic (FCC) grid for the solution of the wave equation" Journal of Computational Physics, vol. 230, no. 15, pp. 6169-6183, 2011.
[24] A. N. Norris "Acoustic cloaking theory" In Proceedings of the Royal Society of London A: Mathematical, Physical and Engineering Sciences vol. 464, no. 2097, pp. 2411-2434, September 2008,
U.S. Patent and Trademark Office, 1989.
[27] M. R.Mokhtar "Bragg grating filters for optical networks", Doctoral dissertation, University of Southampton, 2005.
[28] S. D. Emami, H. J. Lee, and F. Abdullah, "Modal solution for fiber using the H-field finite element method", MATLAB Central, May 2016. [29] Y. Li, B.Liang, Z. M. Gu, X. Y. Zou, and J. C. Cheng "Unidirectional
acoustic transmission through a prism with near-zero refractive index" Applied Physics Letters, vol. 103, no. 5, pp. 053505, 2013.
[30] C. Wolff, M. J. Steel, B. J. Eggleton, and C. G. Poulton, "Stimulated Brillouin scattering in integrated photonic waveguides: forces, scattering mechanisms, and coupled-mode analysis", Phys. Rev. A 92, 013836 2015.
[31] S. G. Johnson, M. Ibanescu, M. A. Skorobogatiy, O. Weisberg, J. D. Joannopoulos, and Y. Fink, "Perturbation theory for Maxwell’s equations with shifting material boundaries", Phys. Rev. E 65, 066611 2002.
S. D. Emami received his Ph.D. degree in 2014 from university of Malaya, Malaysia. Between 2009 and 2014 he did research on Telecommunication major in fiber optic communication system, devices and waveguides. Later he he joined Telekom Malaysia as a research fellow from 2014 to 1016. Currently he is serving as a visiting lecturer in laser and plasma institute, Shahid Beheshti University, iran. He has published over 70 articles in international scientific journals /conferences.
H. J. Lee received her Degree in Electrical Engineering from McGill University, Canada in May 2014. Then, she received her Master of Electrical Engineering from Universiti Tenaga Nasional, Malaysia in June 2016. Her Master research’s work focuses on Modeling of Stimulated Brillouin Scattering using Finite Element Method. She is currently a lecturer in Department of Electrical Power Engineering, College of Engineering, Universiti Tenaga Nasional, Malaysia since 2016.
M. M. Rahman received his B.Sc. (Eng.) in 1987 from Bangladesh Institute of Technology, Chittagong with distinction. He was awarded Institute Gold Medal for securing the highest percentage of marks among all the recipients of Bachelor's degree in the passing session. He earned his M.Sc. (Eng.) in 2001 from The University of Alabama with CGPA 4.00 (out of 4.00). Later he obtained his Ph.D. in photonics from City University London in the year 2016. At present he is serving as Post Doctoral Research Assistant in the Photonics Modelling Group under the Research Centre for Photonics and Instrumentation, City, University of London.
M. M. Dashtabi received his B.Sc. in 2007 from Persian Gulf university, Iran. He earned his M.Sc. in photonics in 2011 from Shahid Beheshti University, iran . Currently he is serving as PhD student in laser and plasma institute, Shahid Beheshti University, iran.
H. A. Abdul-Rashid received his Bachelor's of Engineering from University College London. He later received his Masters and PhD from Multimedia University, Malaysia, where he leads the Fiber optic Research Center, focusing on Specialty Optical Fiber for communications and sensing. Hairul is currently the Vice President (Research and Innovation) at Multimedia University
Fairuz Abdullah received the B.Eng. degree in electronics from Universiti Tenaga Nasional, Malaysia, in 2001. He then completed M.Sc. in network and communication engineering from Universiti Putra Malaysia in 2004 and his doctoral degree in fiber laser sensor from Universiti Tenaga Nasional in 2012. He is currently an Associate Professor in Department of Electronics & Communication Engineering, College of Engineering, Universiti Tenaga Nasional and seconded to Innovation &
Research Group focusing on optical communications, fiber lasers, amplifiers and sensors mainly for application in power enginering. To date, he has published more than 70 journal and conference papers. His research interests include fibre amplifiers, fiber lasers and optical sensors. He is also a senior member of IEEE Photonic Society and has been actively involve since 2003.
B. M. Azizur Rahman (S’80–M’82–SM’93–F’2016) received the B.Sc.Eng and M.Sc.Eng. degrees in electrical engineering with distinctions from Bangladesh University of Engineering and Technology (BUET), Dhaka, Bangladesh, in 1976 and 1979, respectively, and the Ph.D. degree in Electronics from the University College London, London, U.K., in 1982.